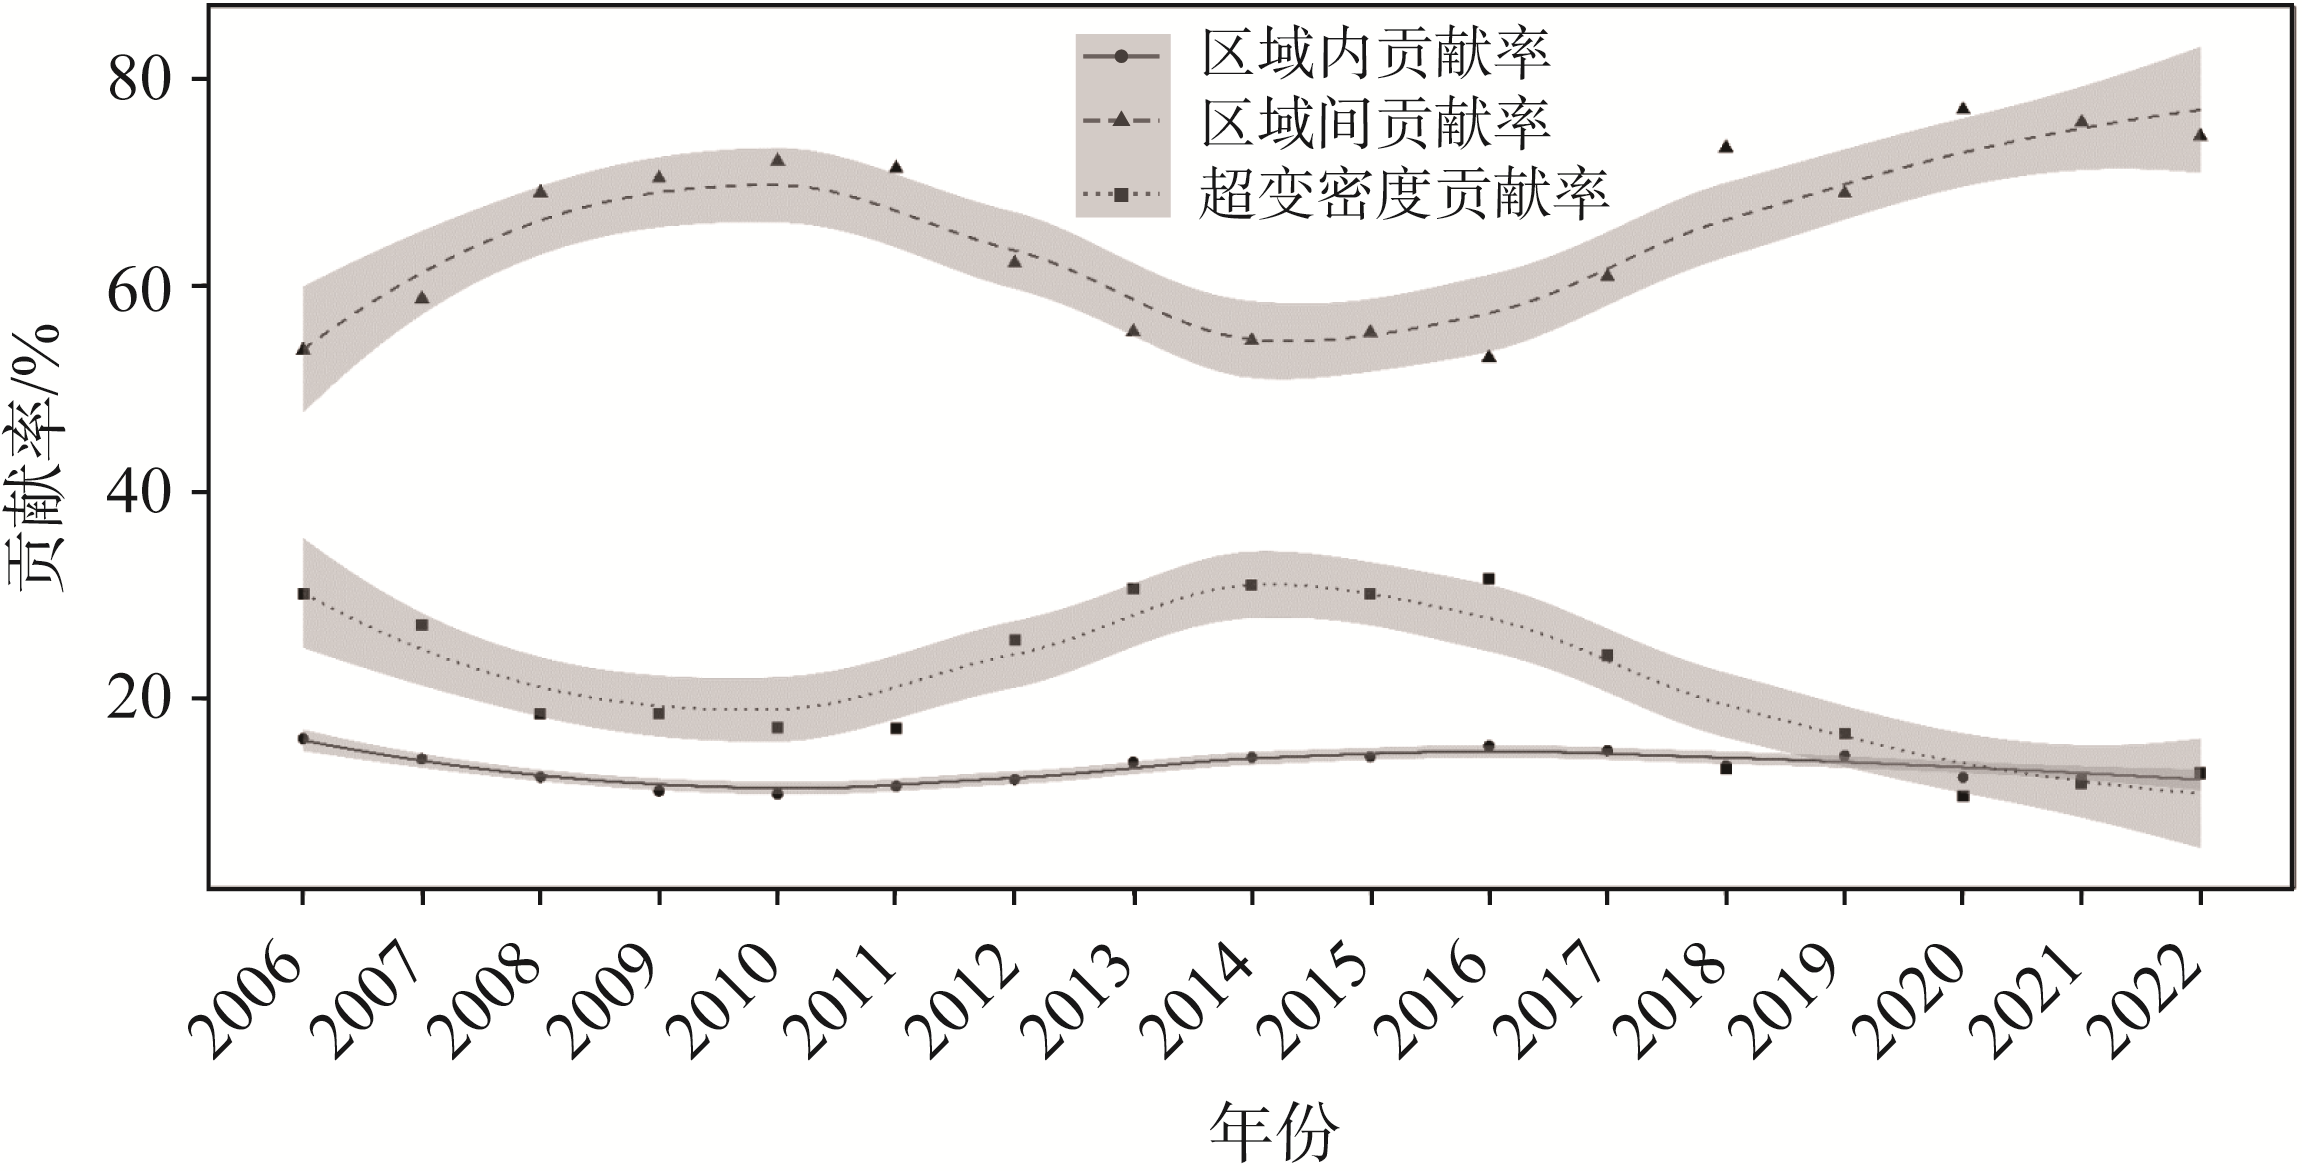
| 年份 | 总体 | 区域内 | 区域间 | 区域间 超变密度 | 贡献率 | ||
|---|---|---|---|---|---|---|---|
| 区域内 | 区域间 | 超变密度 | |||||
| 2006 | 0.1863 | 0.0300 | 0.1001 | 0.0562 | 16.121 | 53.731 | 30.148 |
| 2007 | 0.1862 | 0.0264 | 0.1093 | 0.0505 | 14.164 | 58.717 | 27.119 |
| 2008 | 0.1789 | 0.0222 | 0.1234 | 0.0333 | 12.421 | 68.985 | 18.594 |
| 2009 | 0.1741 | 0.0193 | 0.1225 | 0.0323 | 11.076 | 70.359 | 18.564 |
| 2010 | 0.1954 | 0.0211 | 0.1407 | 0.0336 | 10.808 | 72.019 | 17.173 |
| 2011 | 0.1947 | 0.0225 | 0.1388 | 0.0334 | 11.535 | 71.308 | 17.157 |
| 2012 | 0.1972 | 0.0240 | 0.1226 | 0.0506 | 12.188 | 62.155 | 25.657 |
| 2013 | 0.1944 | 0.0270 | 0.1079 | 0.0595 | 13.865 | 55.509 | 30.626 |
| 2014 | 0.1993 | 0.0285 | 0.1089 | 0.0619 | 14.313 | 54.650 | 31.036 |
| 2015 | 0.1932 | 0.0278 | 0.1071 | 0.0583 | 14.377 | 55.442 | 30.182 |
| 2016 | 0.1907 | 0.0294 | 0.1011 | 0.0602 | 15.420 | 53.002 | 31.578 |
| 2017 | 0.1947 | 0.0291 | 0.1185 | 0.0471 | 14.966 | 60.852 | 24.182 |
| 2018 | 0.1939 | 0.0262 | 0.1421 | 0.0256 | 13.500 | 73.300 | 13.201 |
| 2019 | 0.1923 | 0.0279 | 0.1325 | 0.0319 | 14.495 | 68.896 | 16.609 |
| 2020 | 0.2040 | 0.0253 | 0.1571 | 0.0217 | 12.396 | 76.991 | 10.613 |
| 2021 | 0.2128 | 0.0265 | 0.1612 | 0.0251 | 12.433 | 75.774 | 11.793 |
| 2022 | 0.2151 | 0.0274 | 0.1601 | 0.0276 | 12.753 | 74.437 | 12.810 |