×
模态框(Modal)标题
在这里添加一些文本
Close
Close
Submit
Cancel
Confirm
×
模态框(Modal)标题
×
Journal
Article
Figure
Search
EN
中文
Home
About Journal
Overview
Indexing
Awards
Editorial Board
Guide for Authors
Browse
Current Issue
Online First
Archive
Highlights
Topic
Archive by Subject
Most Viewed
Most Download
Most Cited
E-mail Alert
RSS
Subscription
Guidelines
Contact Us
EN
中文
Figure/Table detail
Scale effects and driving factors of spatiotemporal evolution of carbon emission efficiency: A case study of Henan province
XIAO Dong-yang, LUO Yu-hong, LI Ming-qiu, NIU Hai-peng
JOURNAL OF NATURAL RESOURCES
, 2025, 40(
11
): 3073-3095. DOI:
10.31497/zrzyxb.20251111
变量名称
数据来源
能源投入
电能
《中国城市统计年鉴》
2007—2023年
交通运输
《中国城市统计年鉴》
2007—2023年
天然气
《中国城市统计年鉴》
2007—2023年
液化石油气
《中国城市统计年鉴》
2007—2023年
热能
《中国城市统计年鉴》
2007—2023年
劳动力投入
年末从业人员总数
《河南省统计年鉴》
2007—2023年
期望产出
实际地区生产总值
《河南省统计年鉴》
2007—2023年
Table 4
Data sources
Other figure/table from this article
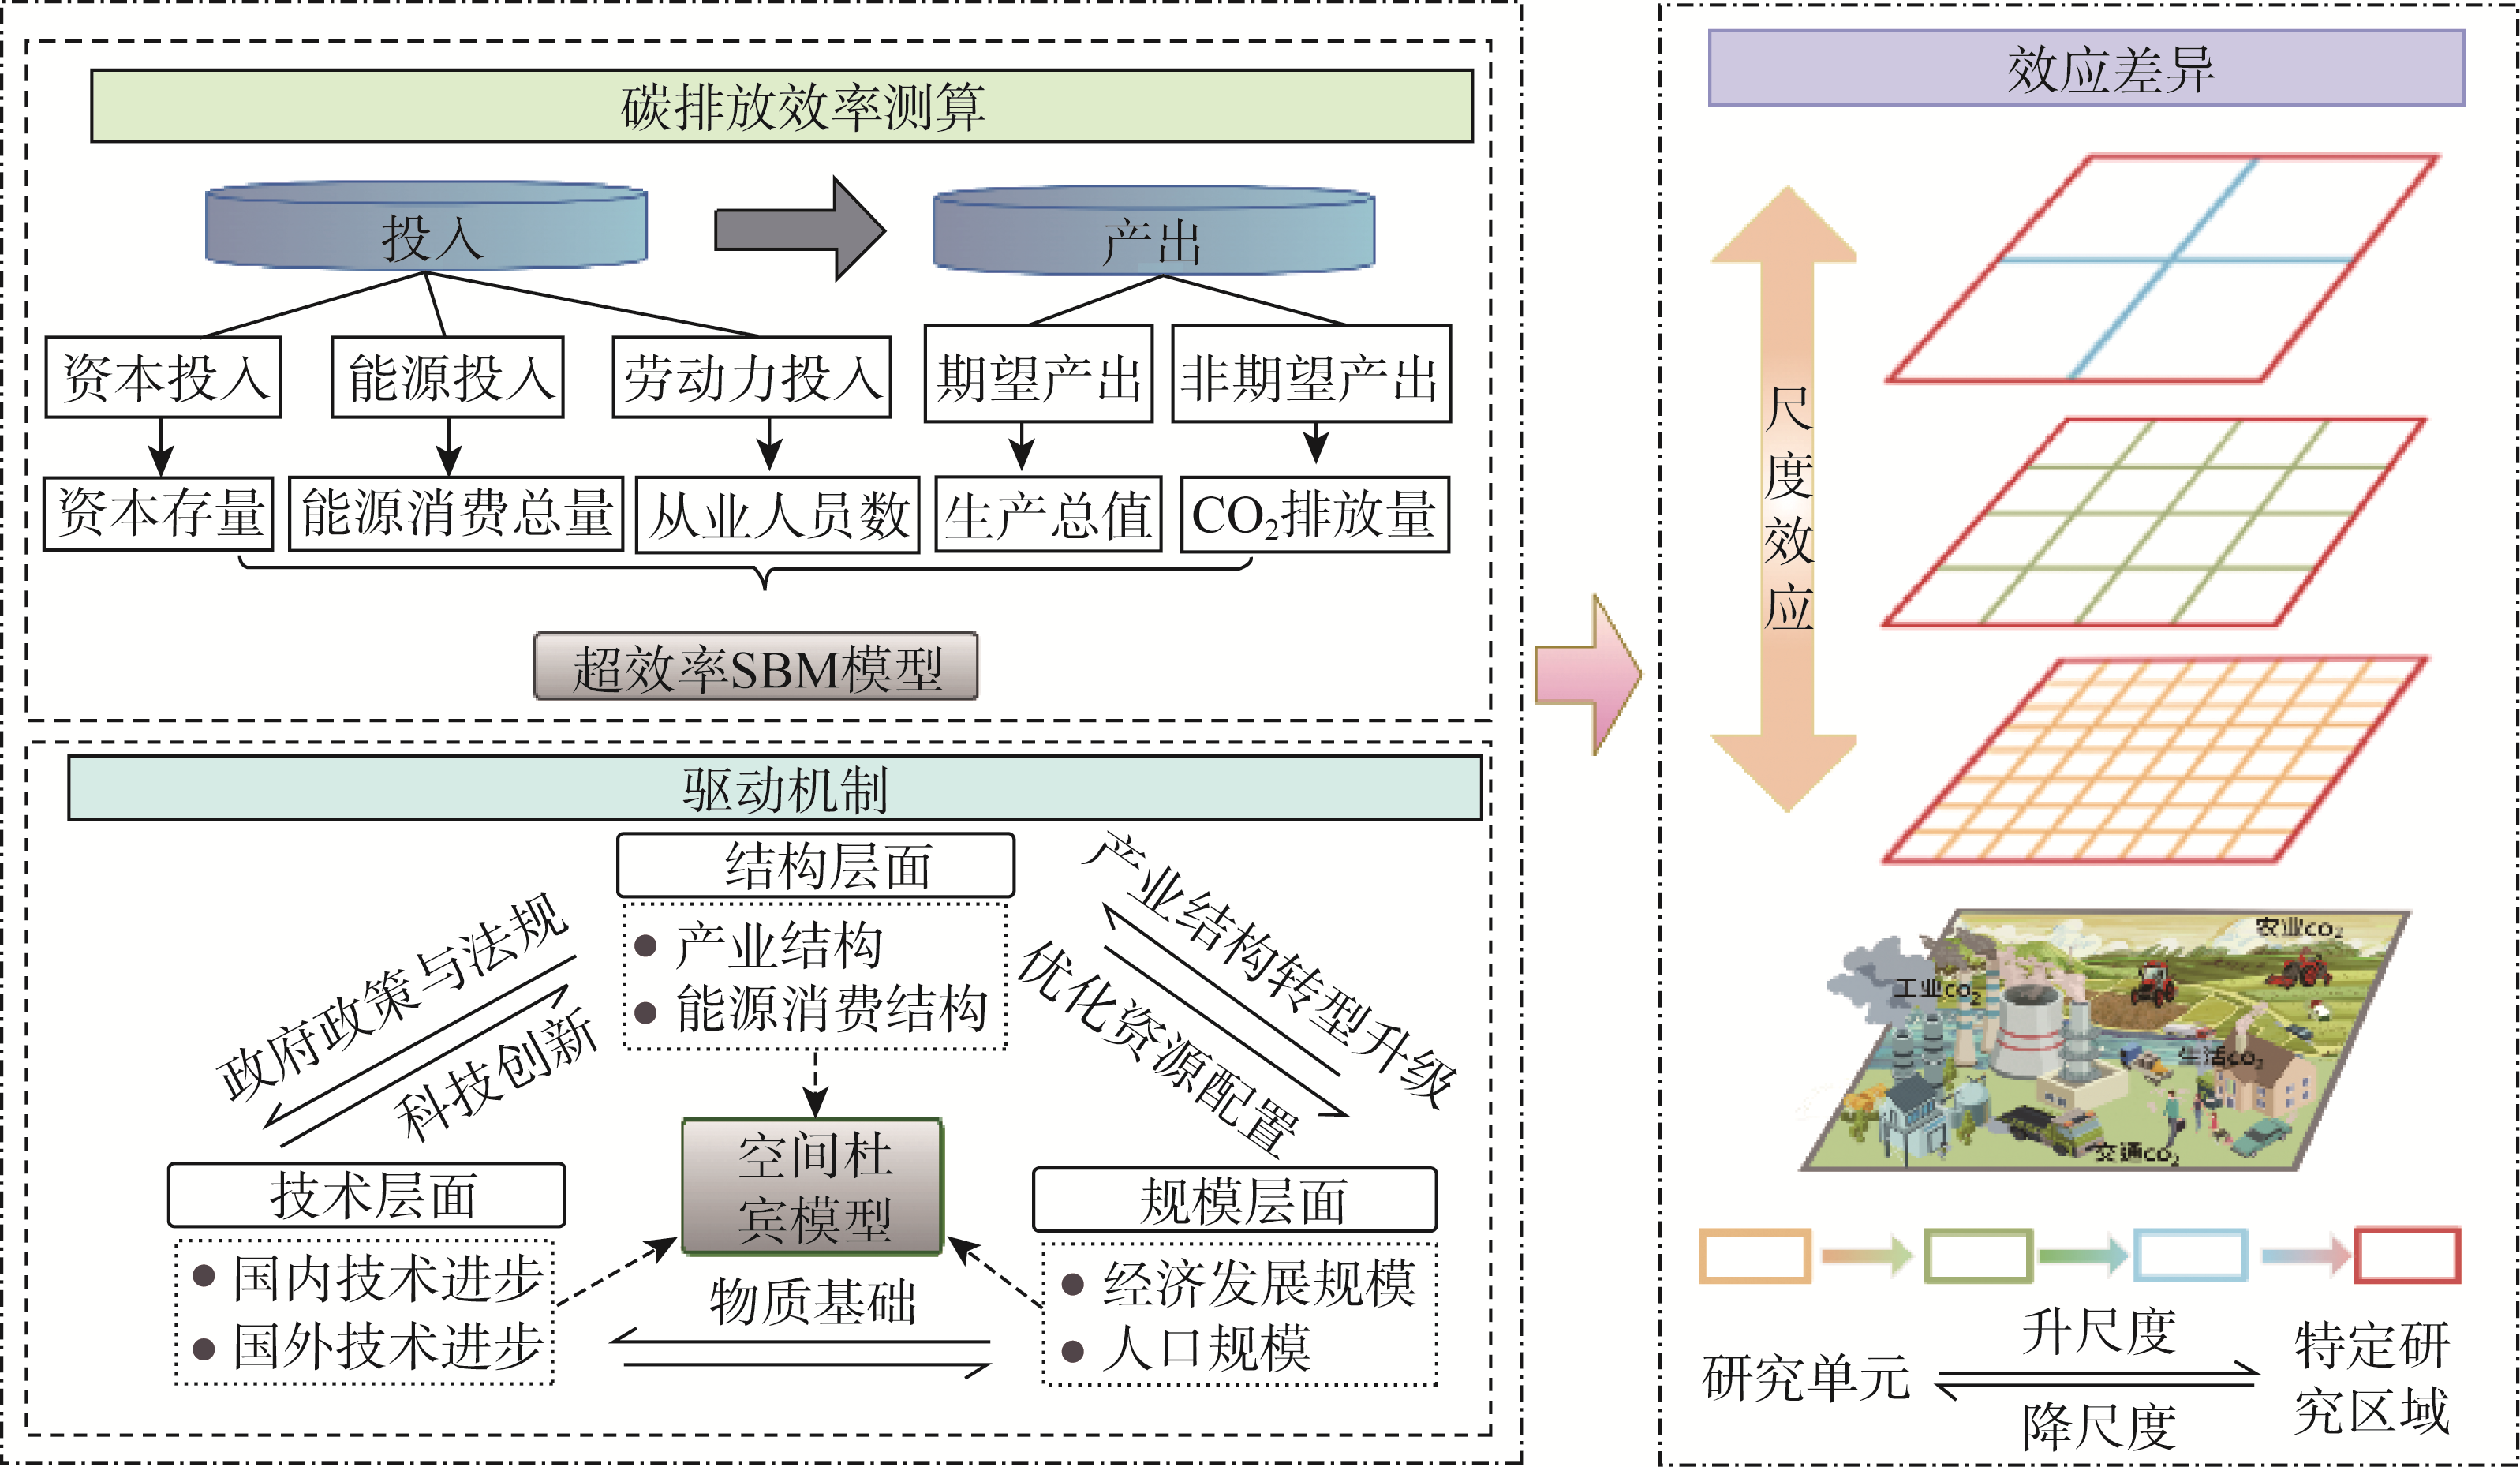
Fig. 1
Research framework of scale effects and driving factors of carbon emission efficiency
Table 1
Input and output indicator system of carbon emission efficiency
Table 2
Influencing factors of carbon emission efficiency
Table 3
Results of LM test, Hausman test, Wald test and LR test
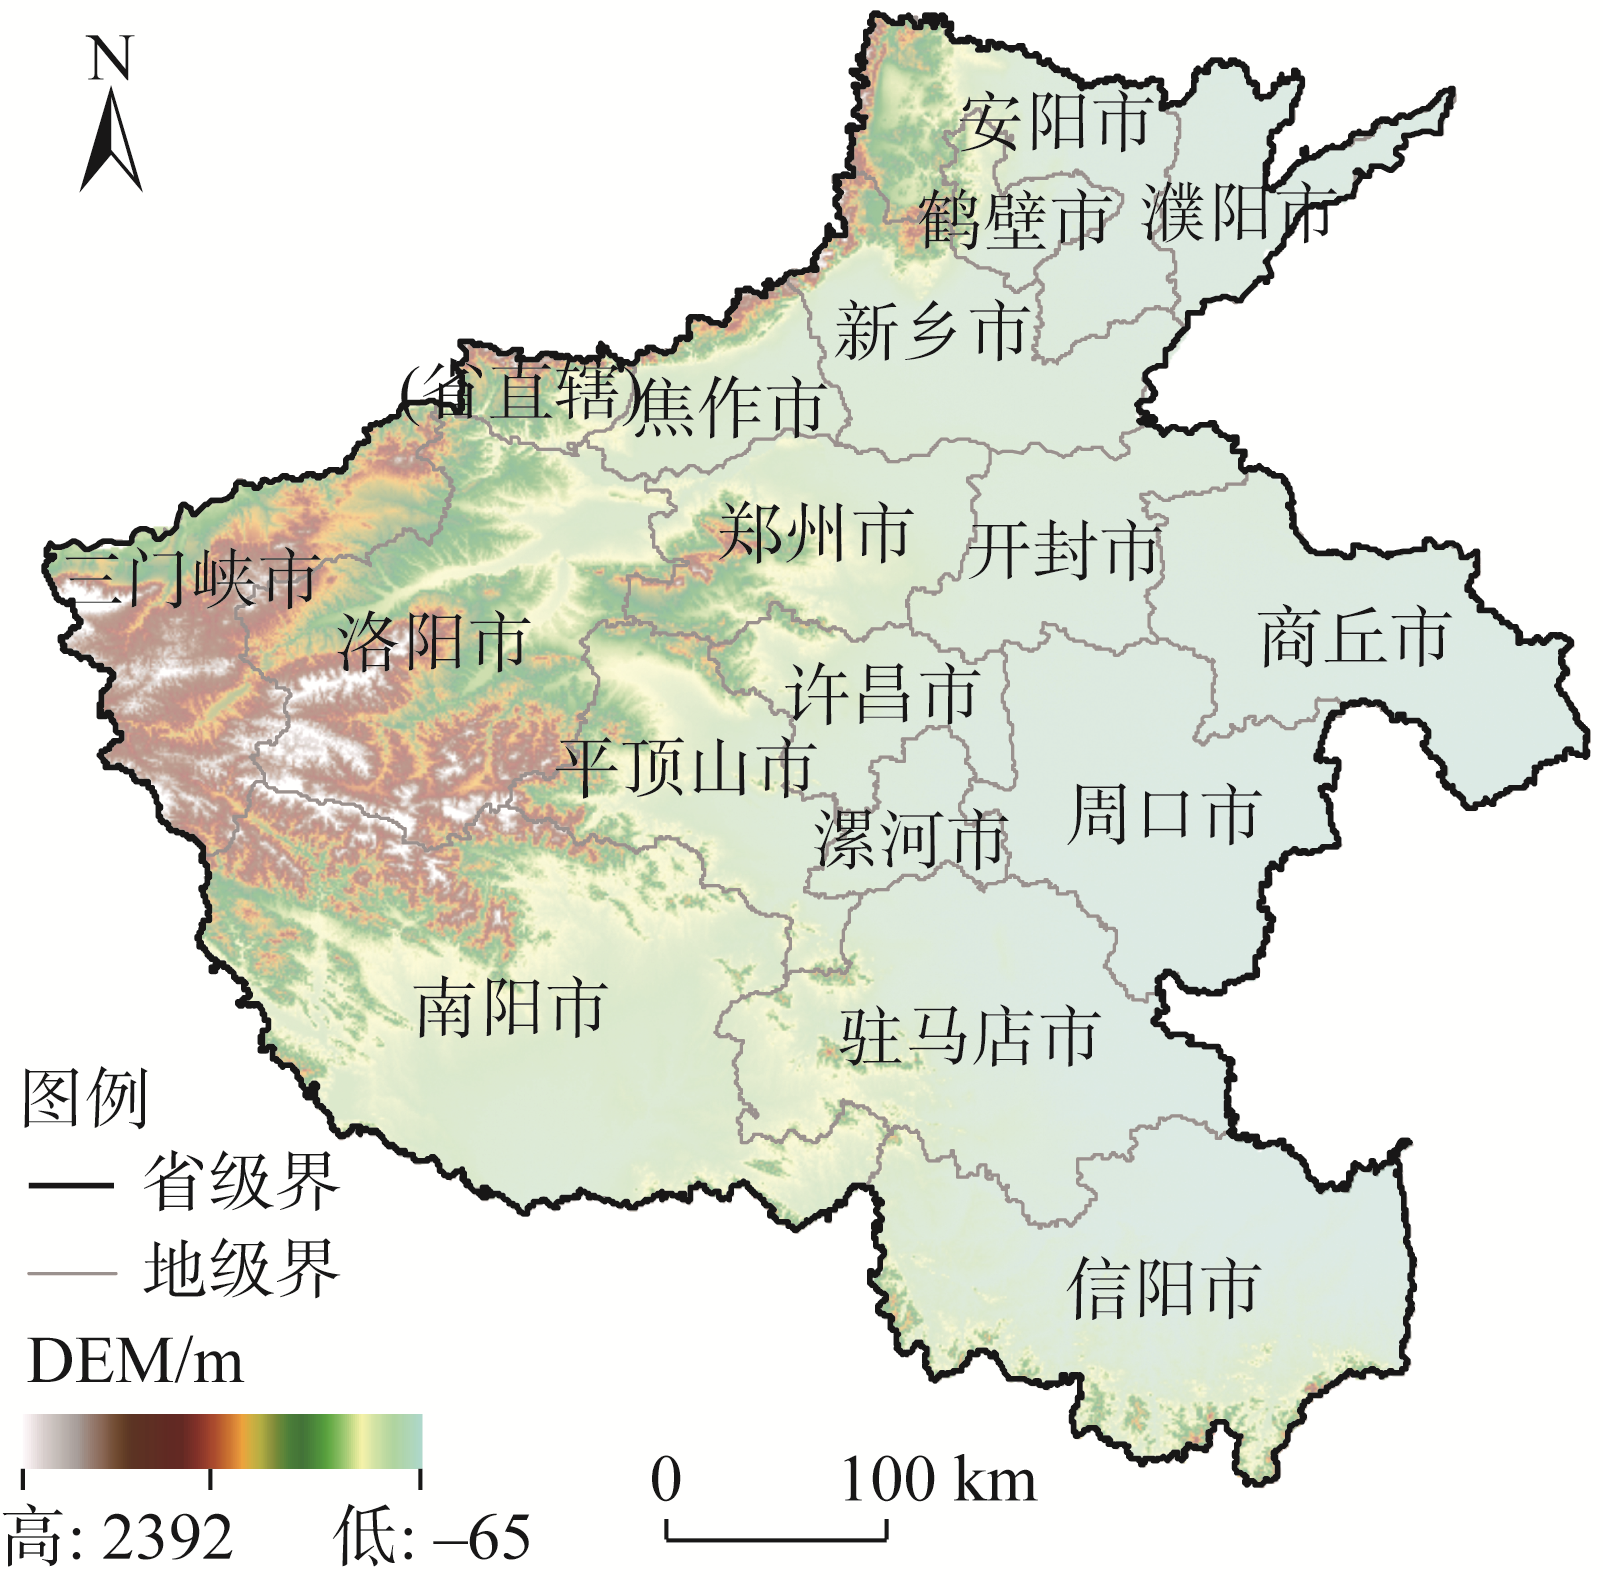
Fig. 2
Overview of the study area
Table 5
Carbon emission efficiency of prefecture-level cities of Henan province from 2006 to 2022
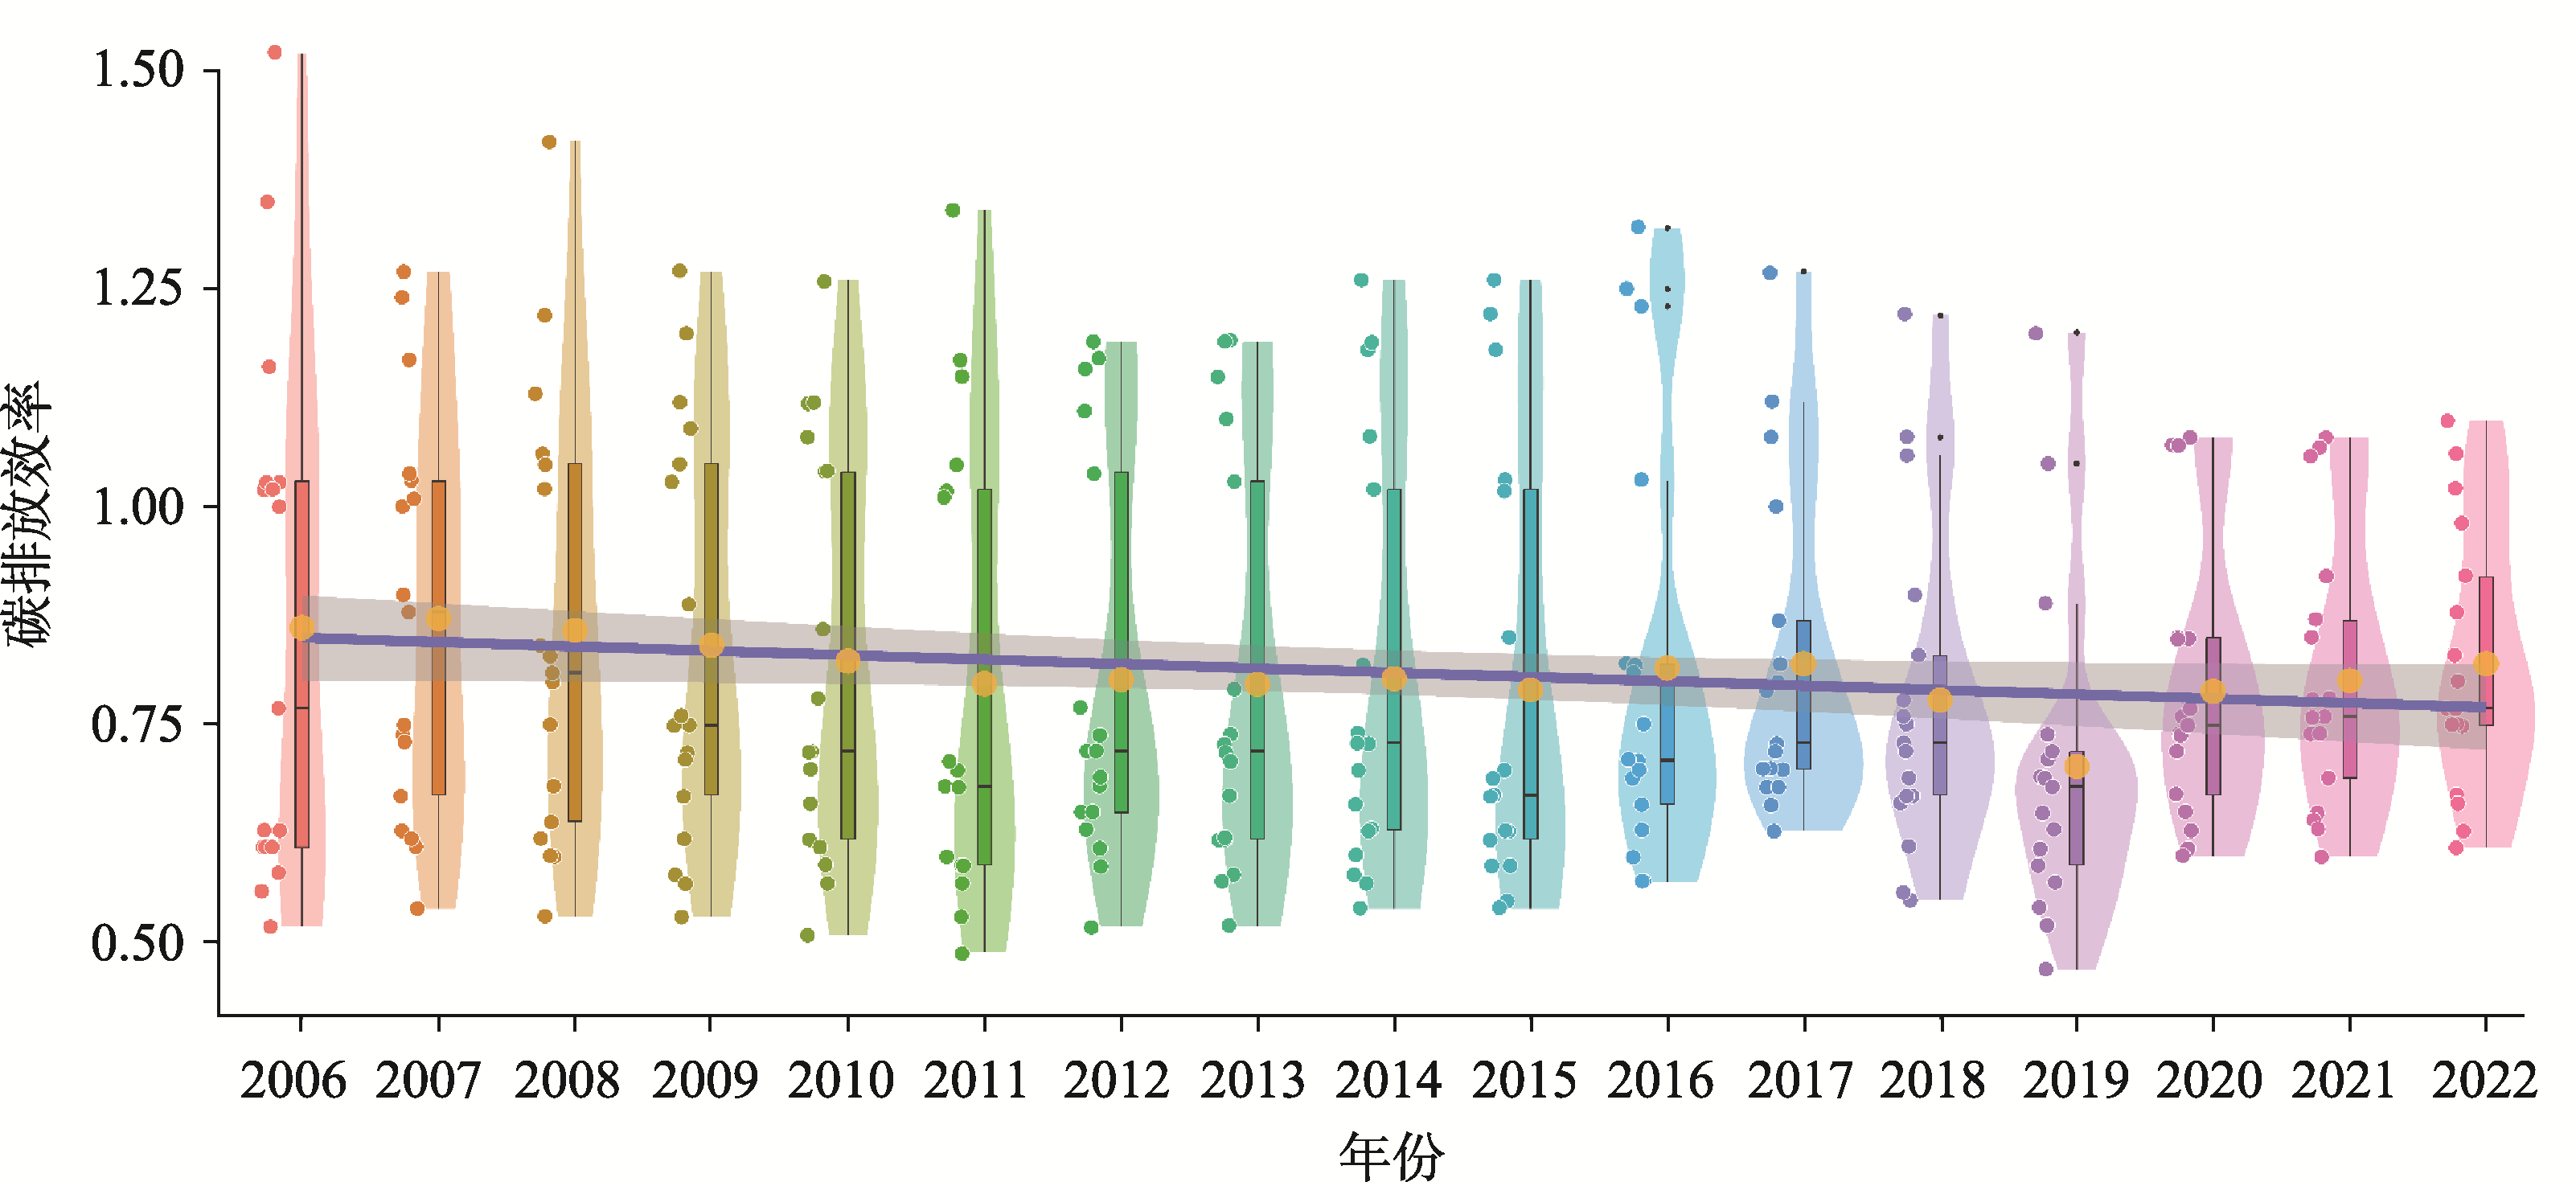
Fig. 3
Distribution of carbon emission efficiency of prefecture-level cities of Henan province
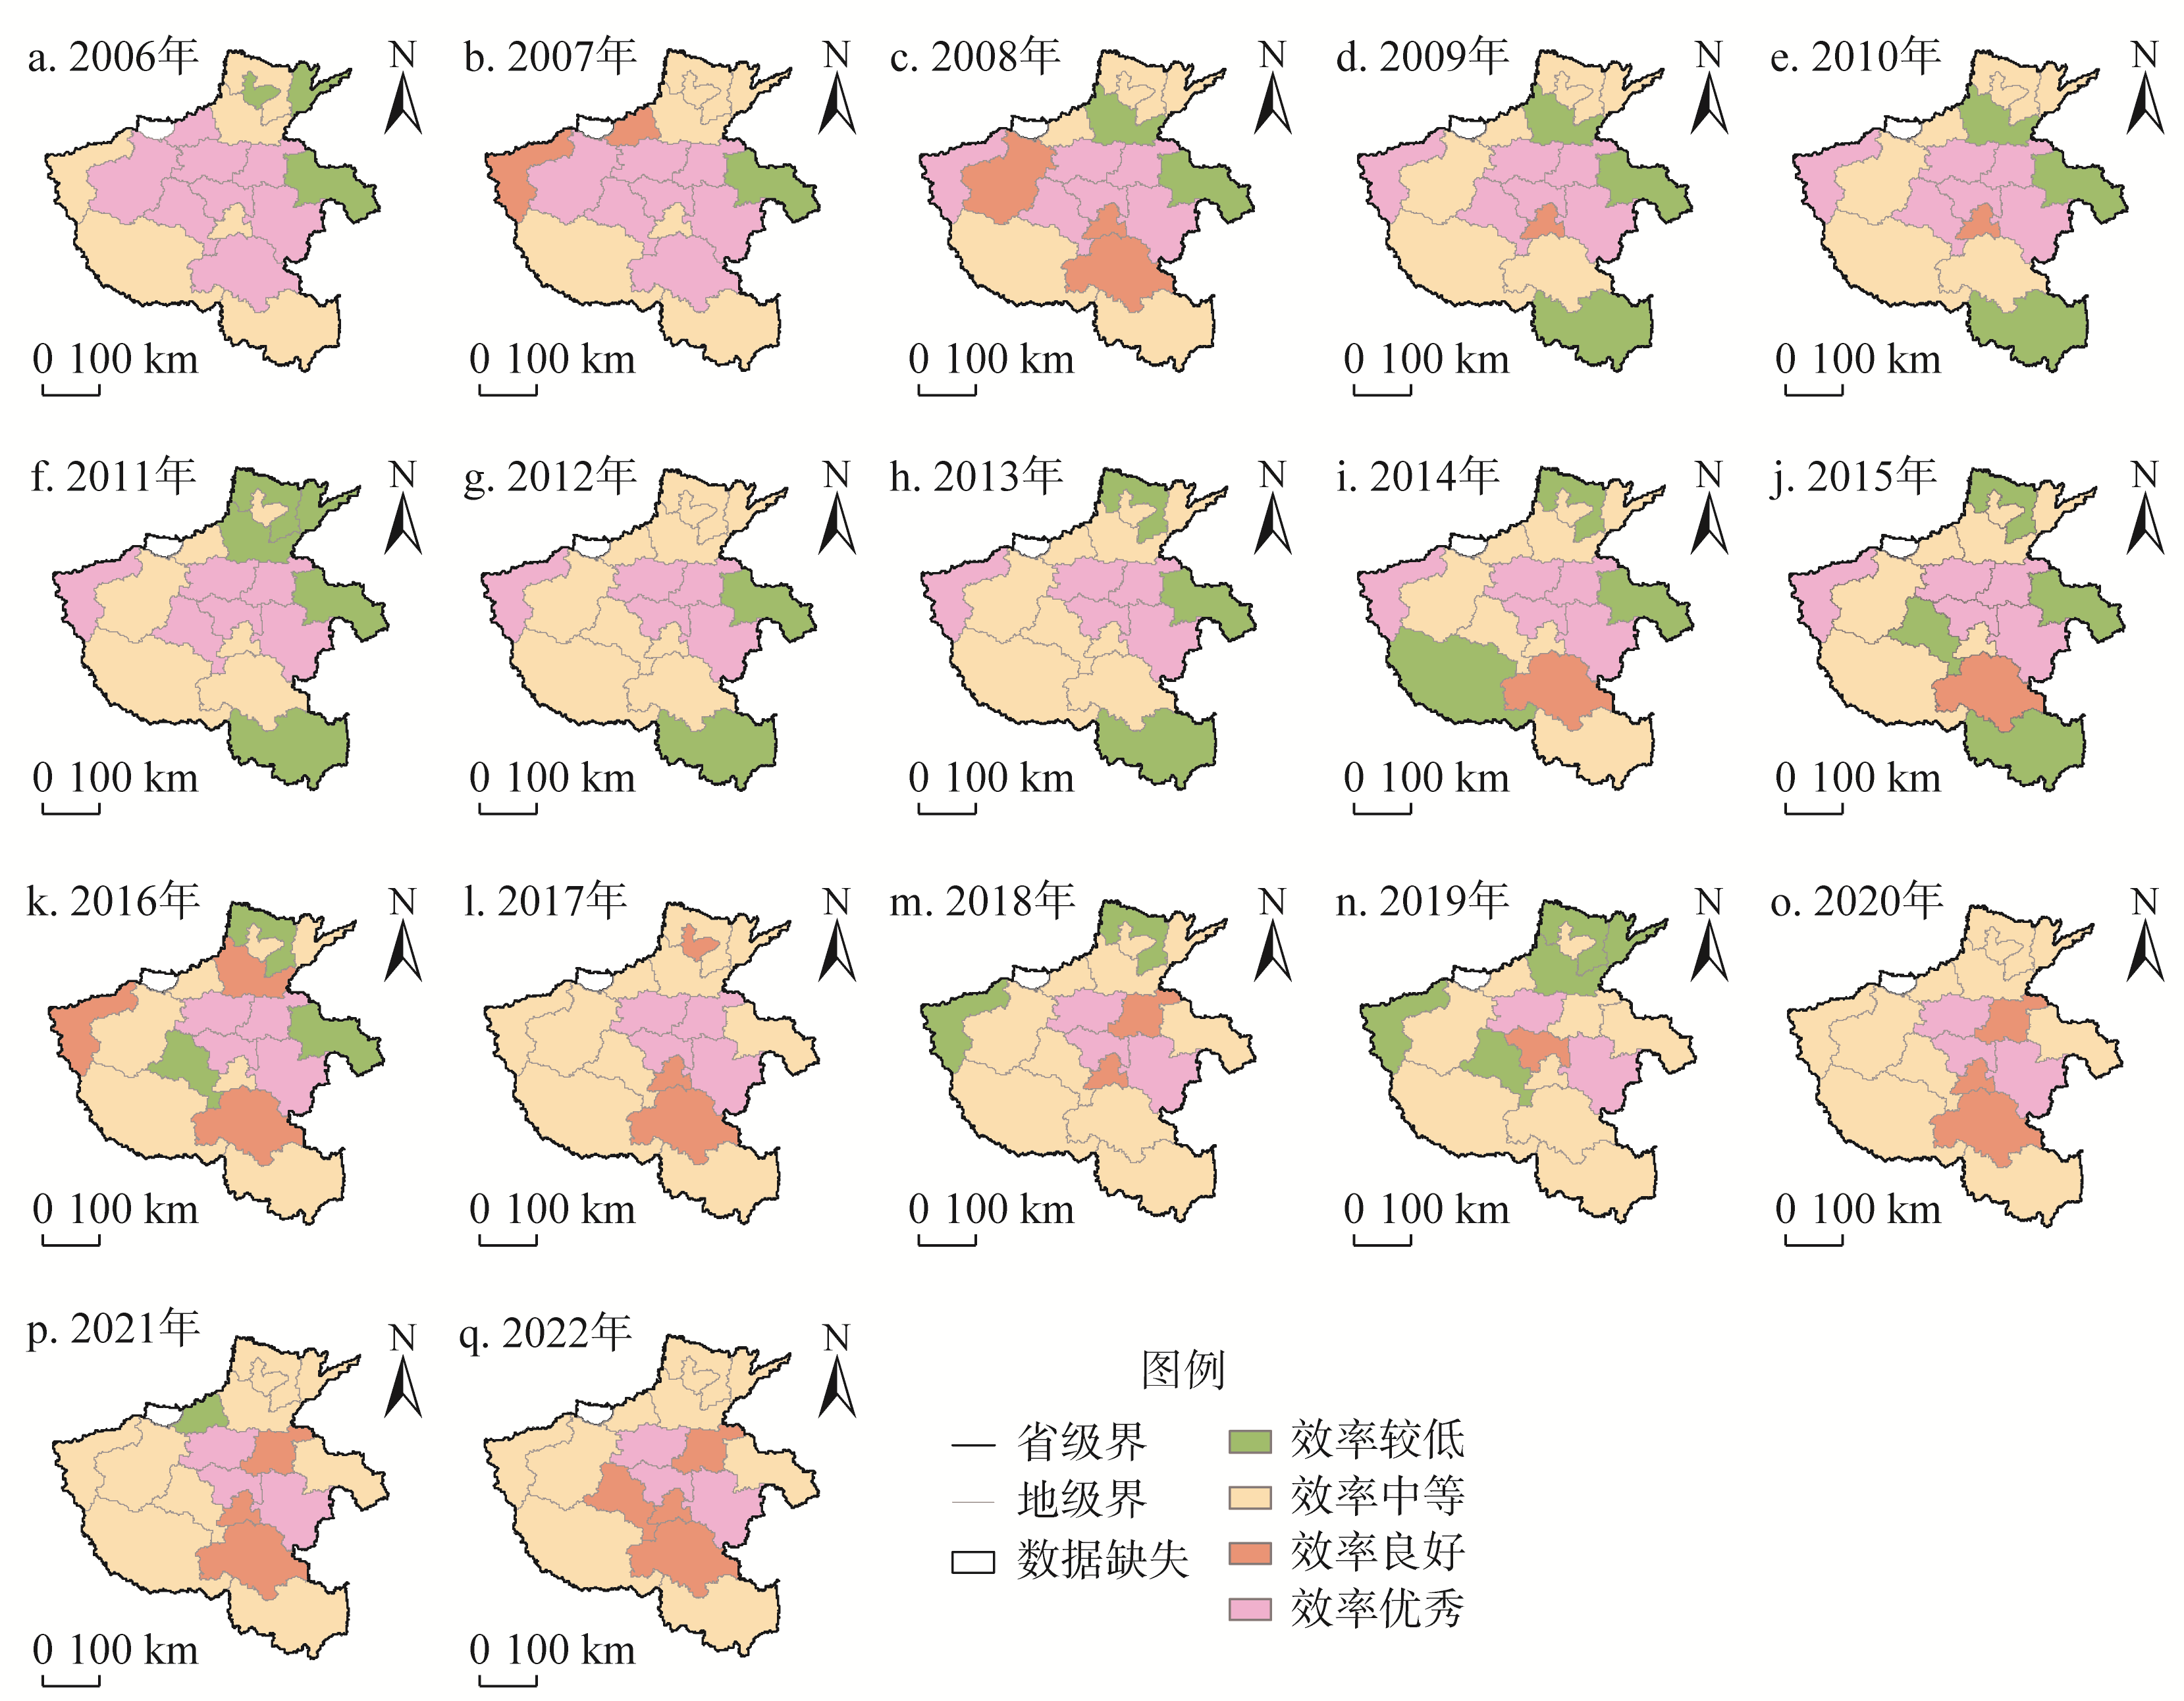
Fig. 4
Spatial distribution of carbon emission efficiency in Henan province from 2006 to 2022
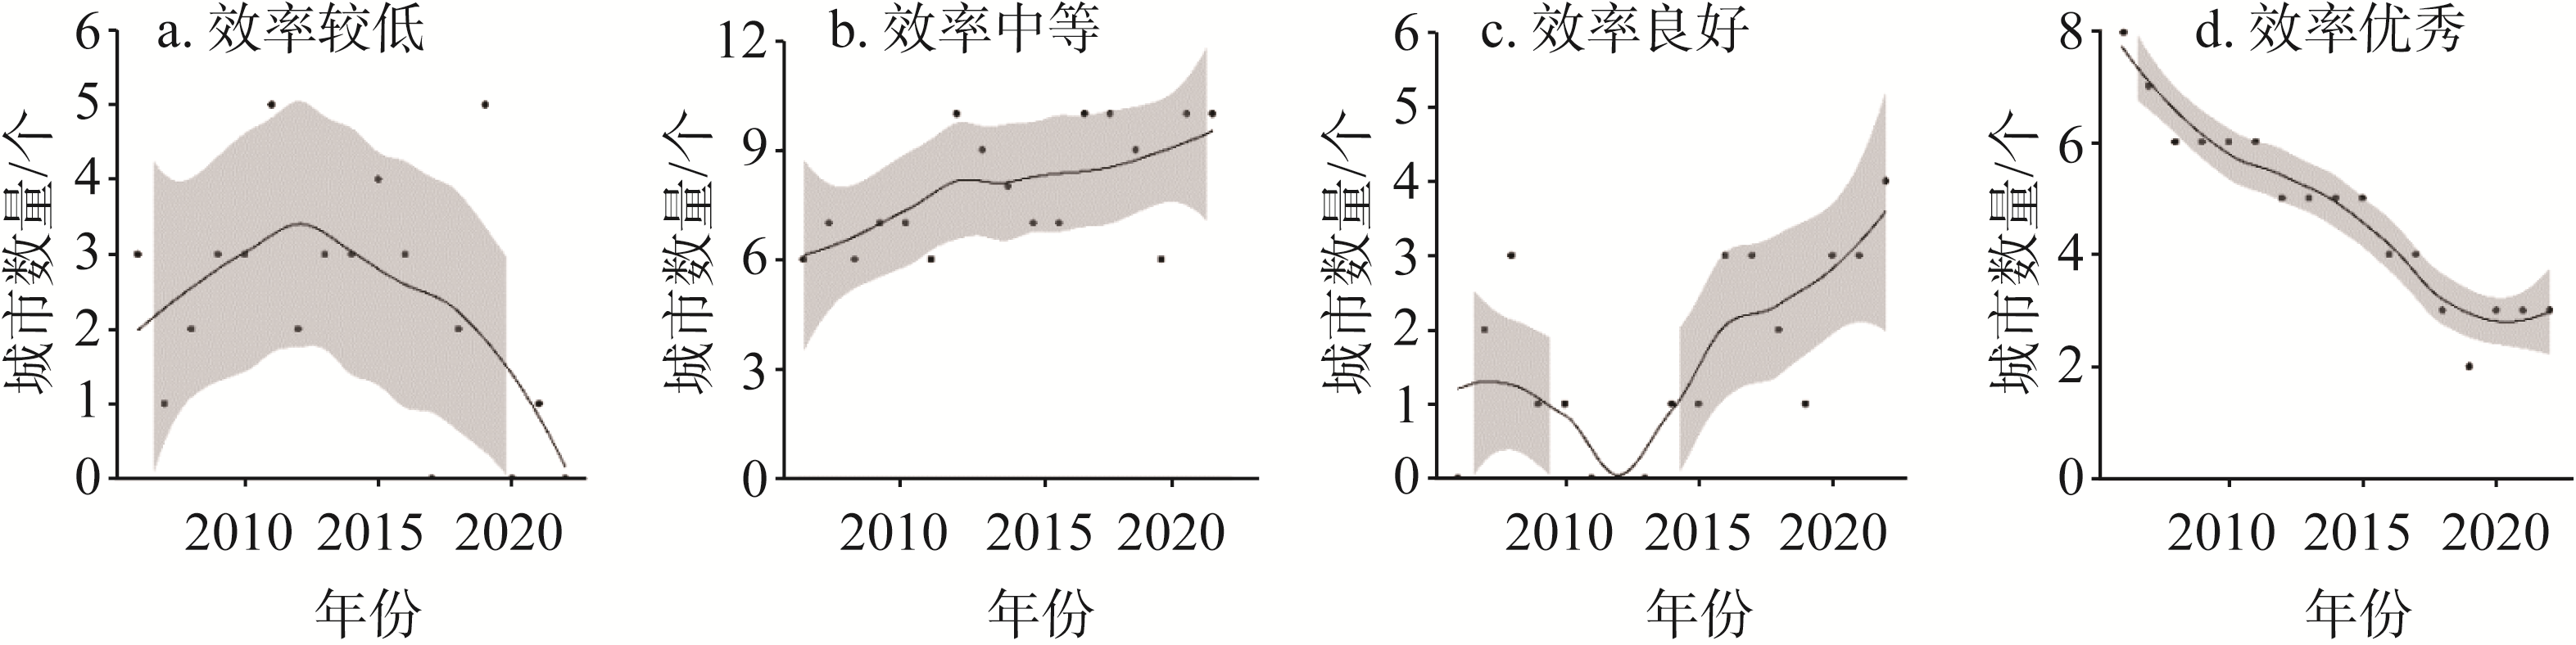
Fig. 5
Number of cities in Henan province with different carbon emission efficiency levels
Table 6
Statistics of the global Moran index of carbon emission efficiency of Henan province
Table 7
Carbon emission efficiency of regions of Henan province from 2006 to 2022
Table 8
Dagum Gini coefficient and contribution rate
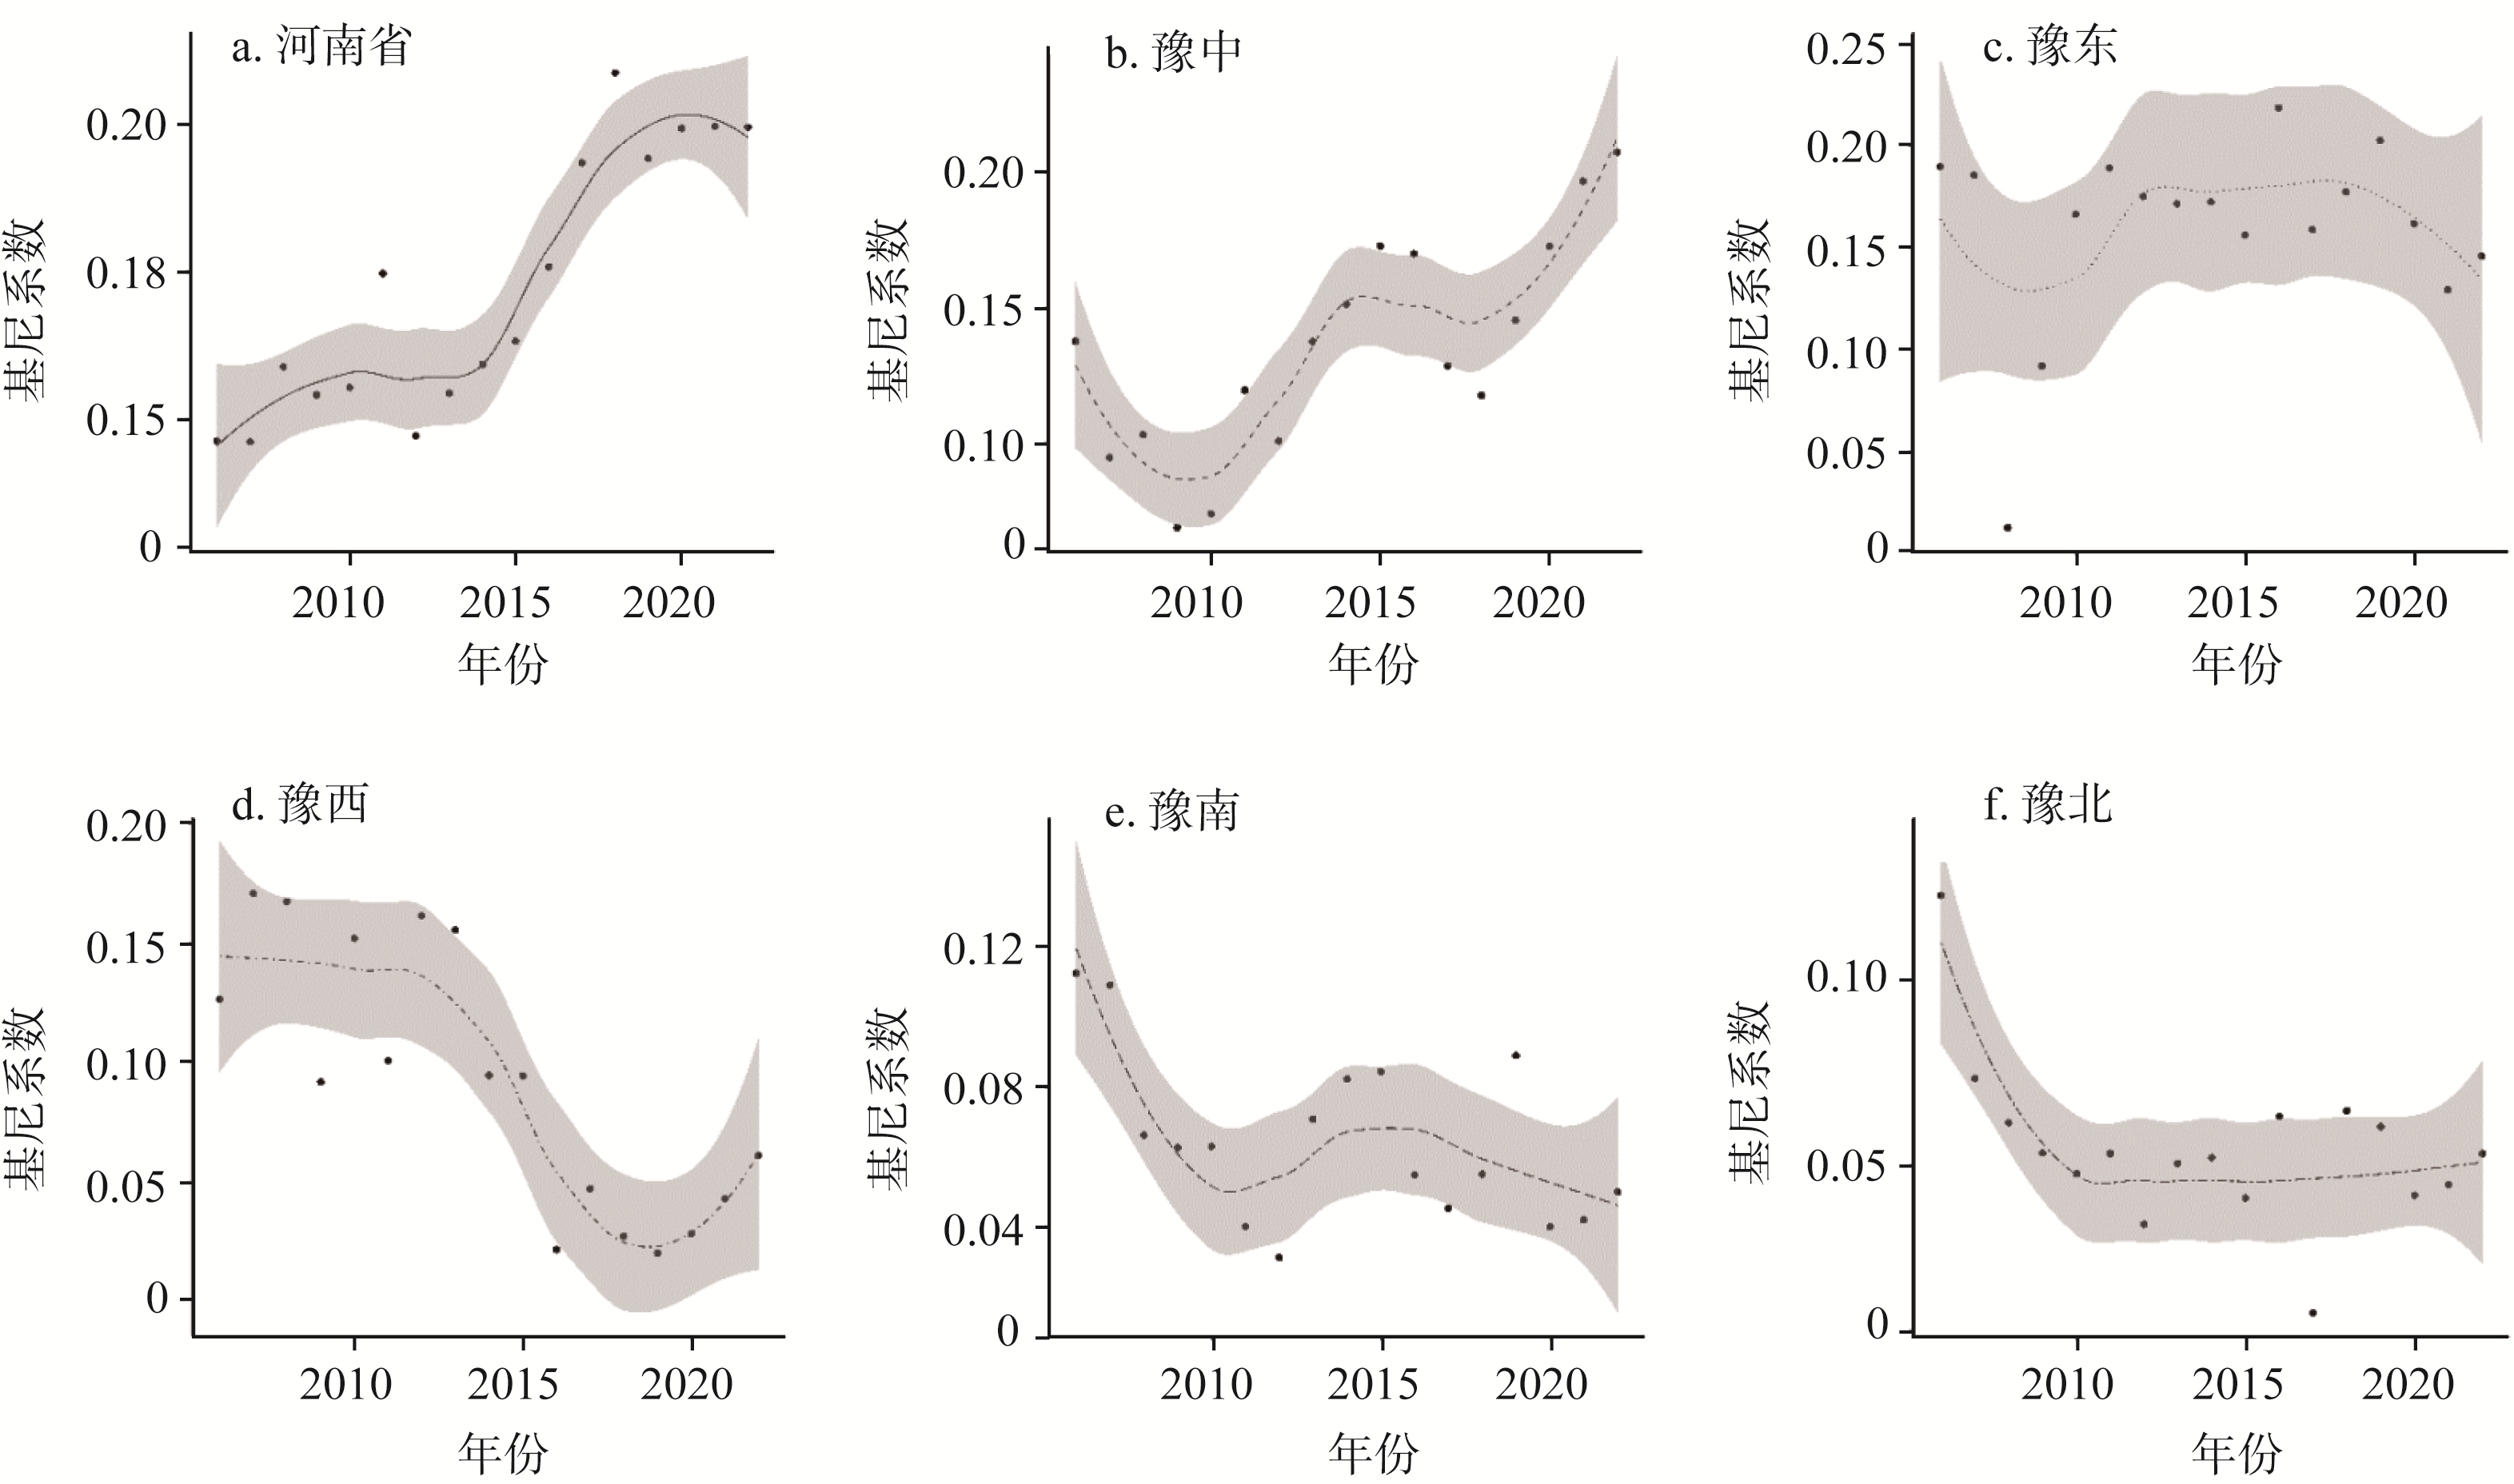
Fig. 6
Overall carbon emission efficiency and regional Gini coefficient of Henan province
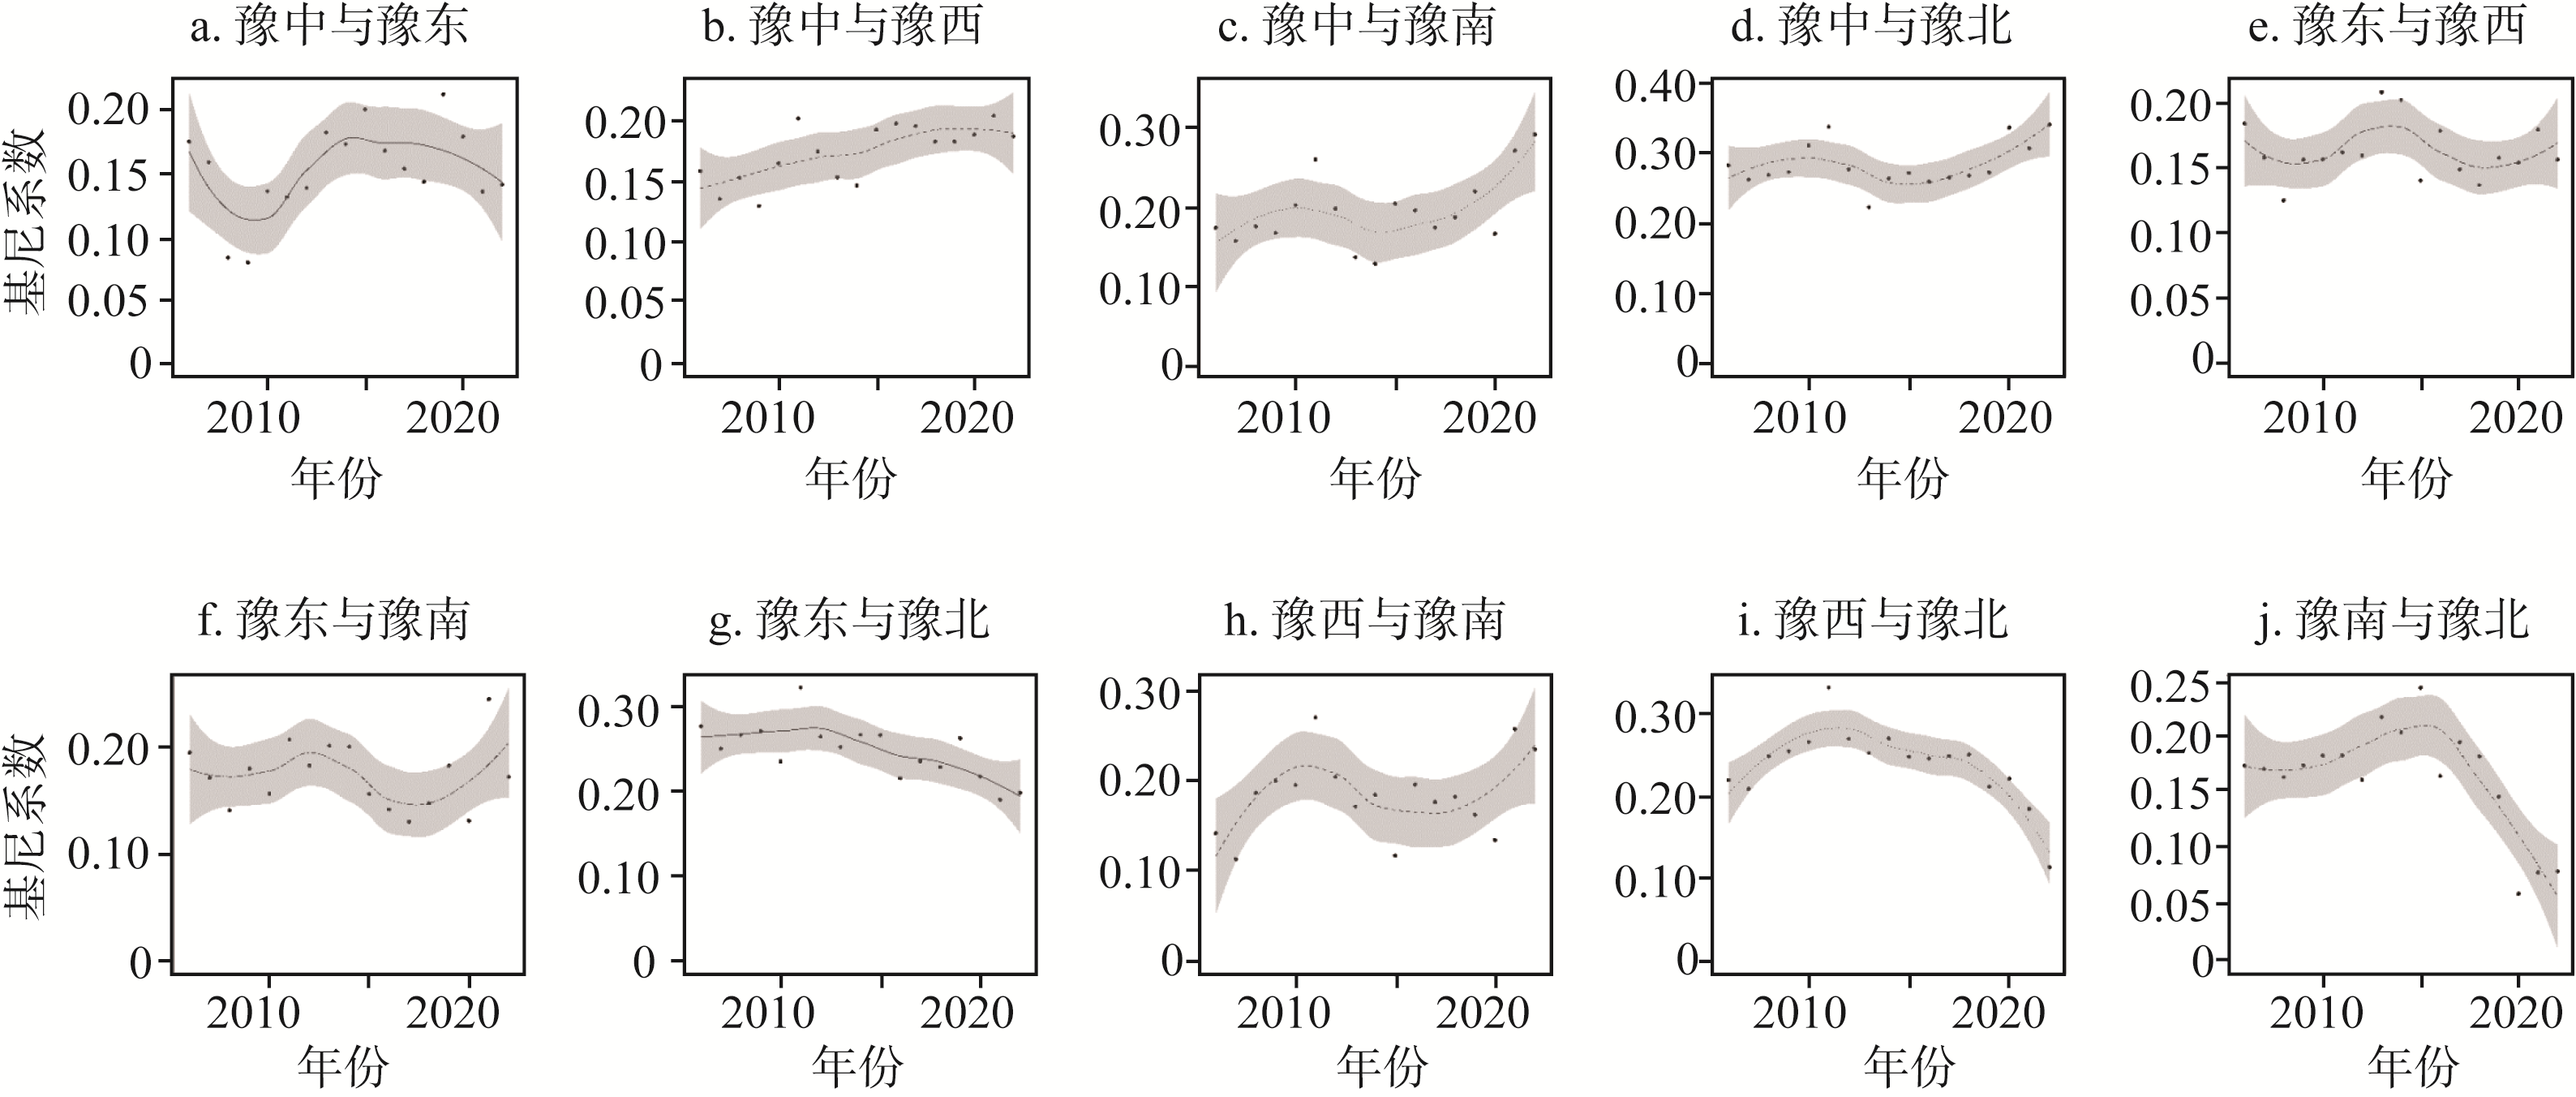
Fig. 7
Interregional Gini coefficient of carbon emission efficiency of Henan province
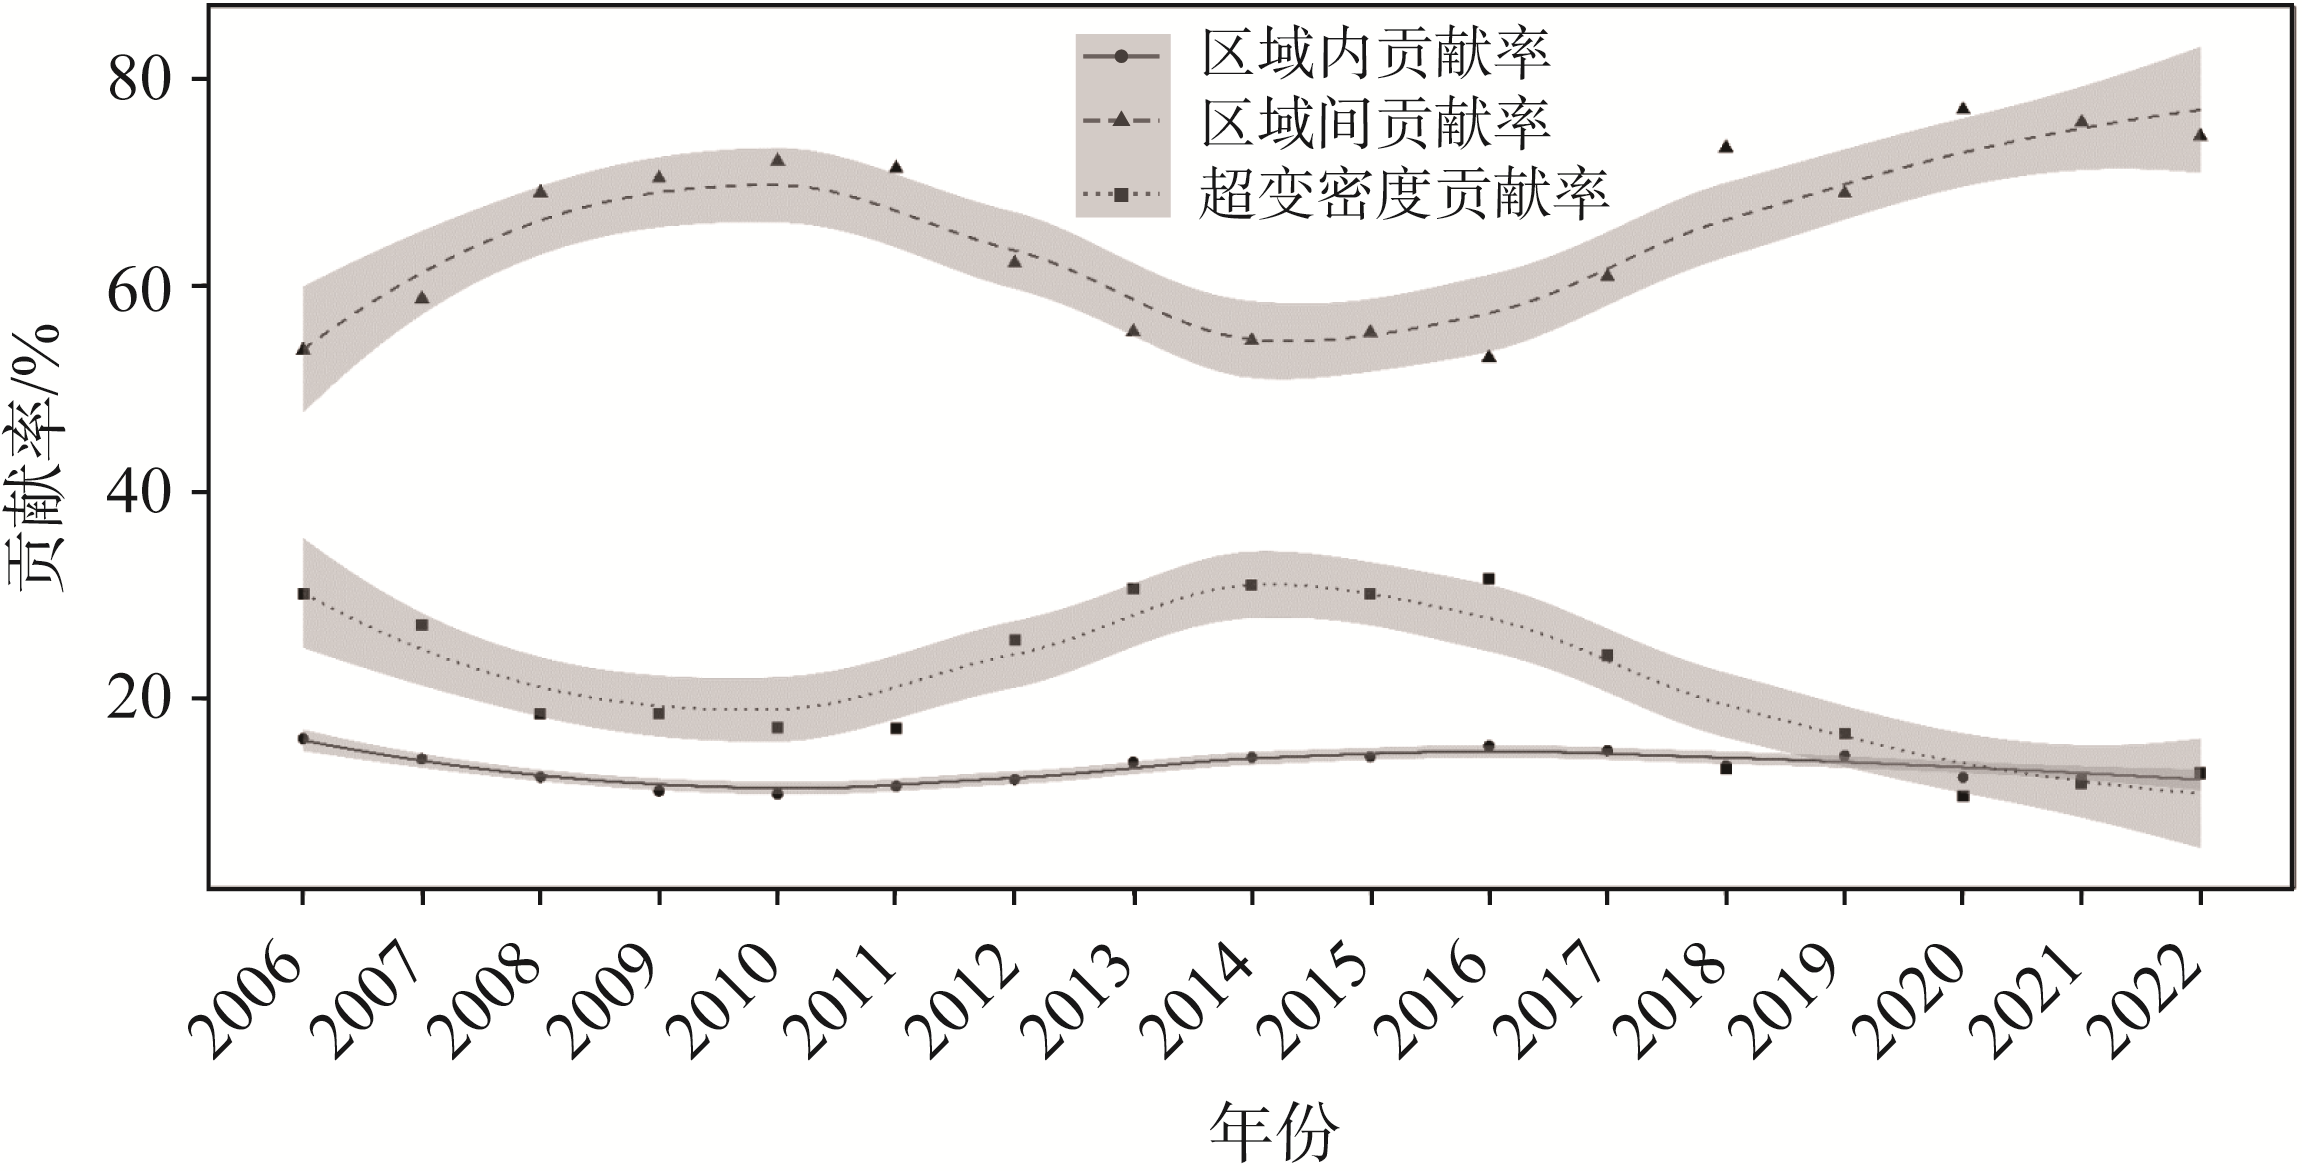
Fig. 8
Contribution rate of regional differences of carbon emission efficiency of Henan province
Table 9
Regression results and effect decomposition results of spatial Durbin model