×
模态框(Modal)标题
在这里添加一些文本
Close
Close
Submit
Cancel
Confirm
×
模态框(Modal)标题
×
Journal
Article
Figure
Search
EN
中文
Home
About Journal
Overview
Indexing
Awards
Editorial Board
Guide for Authors
Browse
Current Issue
Online First
Archive
Highlights
Topic
Archive by Subject
Most Viewed
Most Download
Most Cited
E-mail Alert
RSS
Subscription
Guidelines
Contact Us
EN
中文
Figure/Table detail
The effectiveness and attribution of wetland protection and restoration in Changde city from the perspective of international wetland cities and its policy implications
LING Zi-yan, DENG Ya-wen, JIANG Wei-guo, SONG Jie, ZHANG Ze
JOURNAL OF NATURAL RESOURCES
, 2024, 39(
9
): 2241-2258. DOI:
10.31497/zrzyxb.20240914
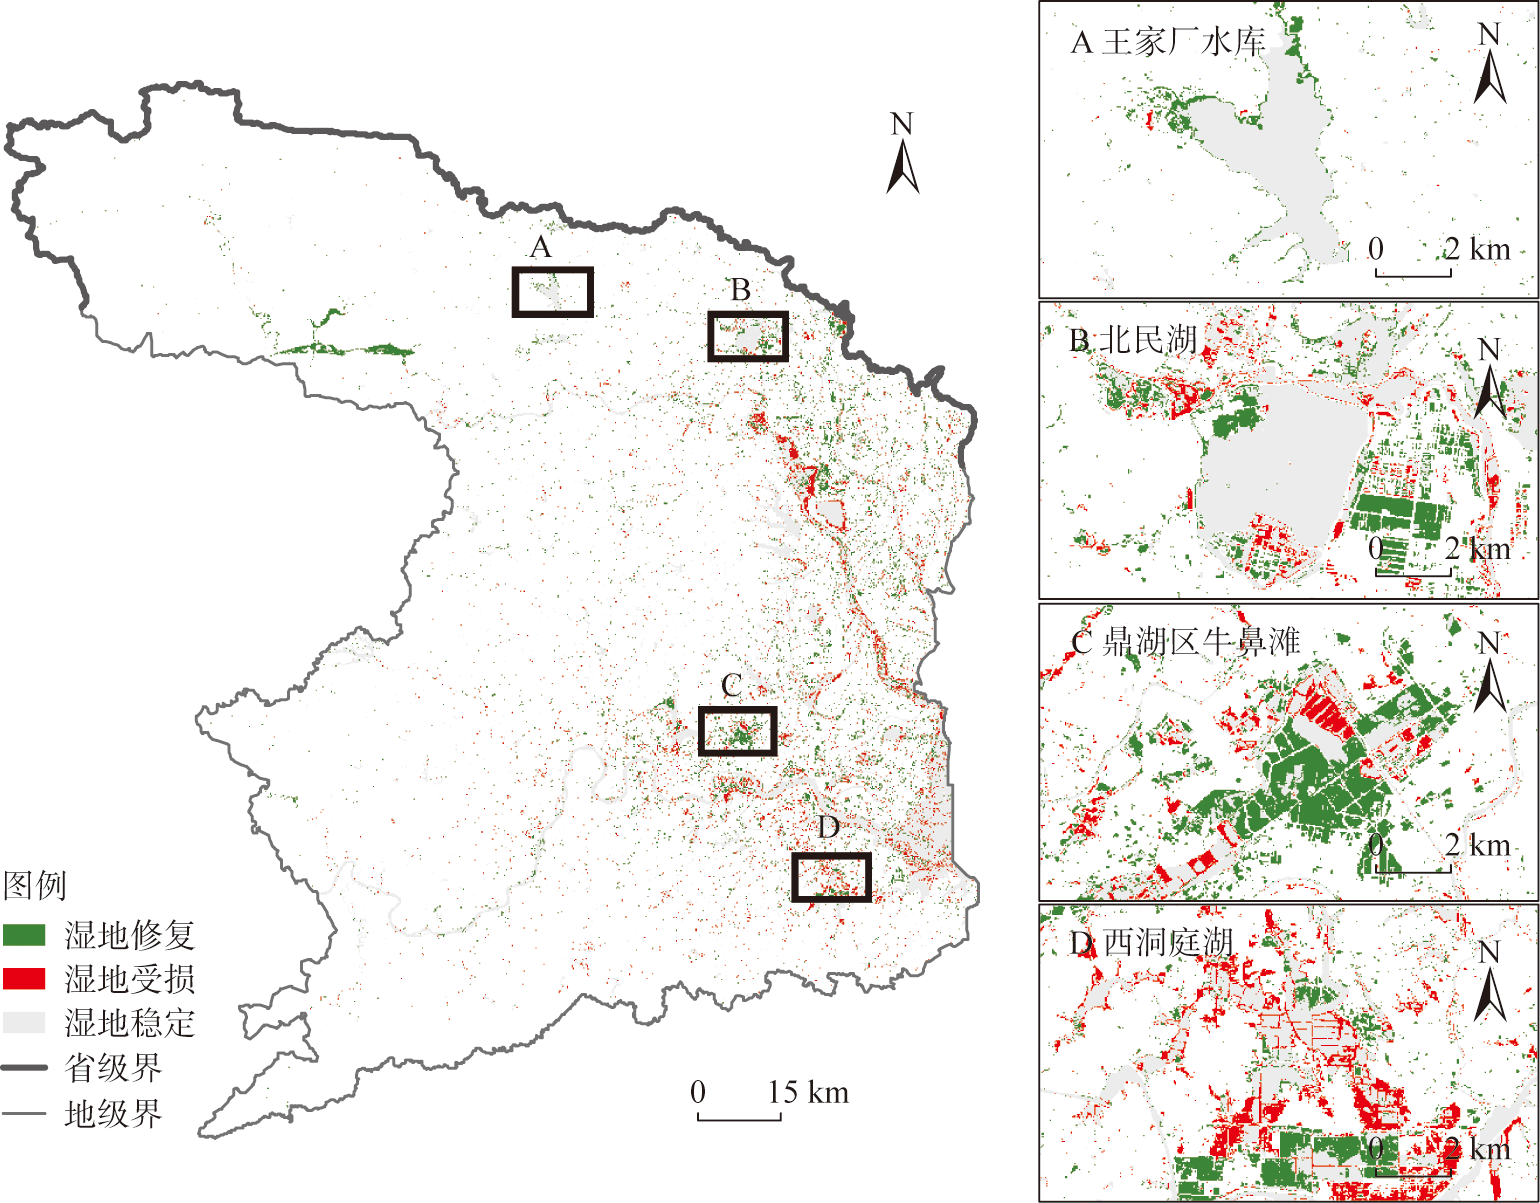
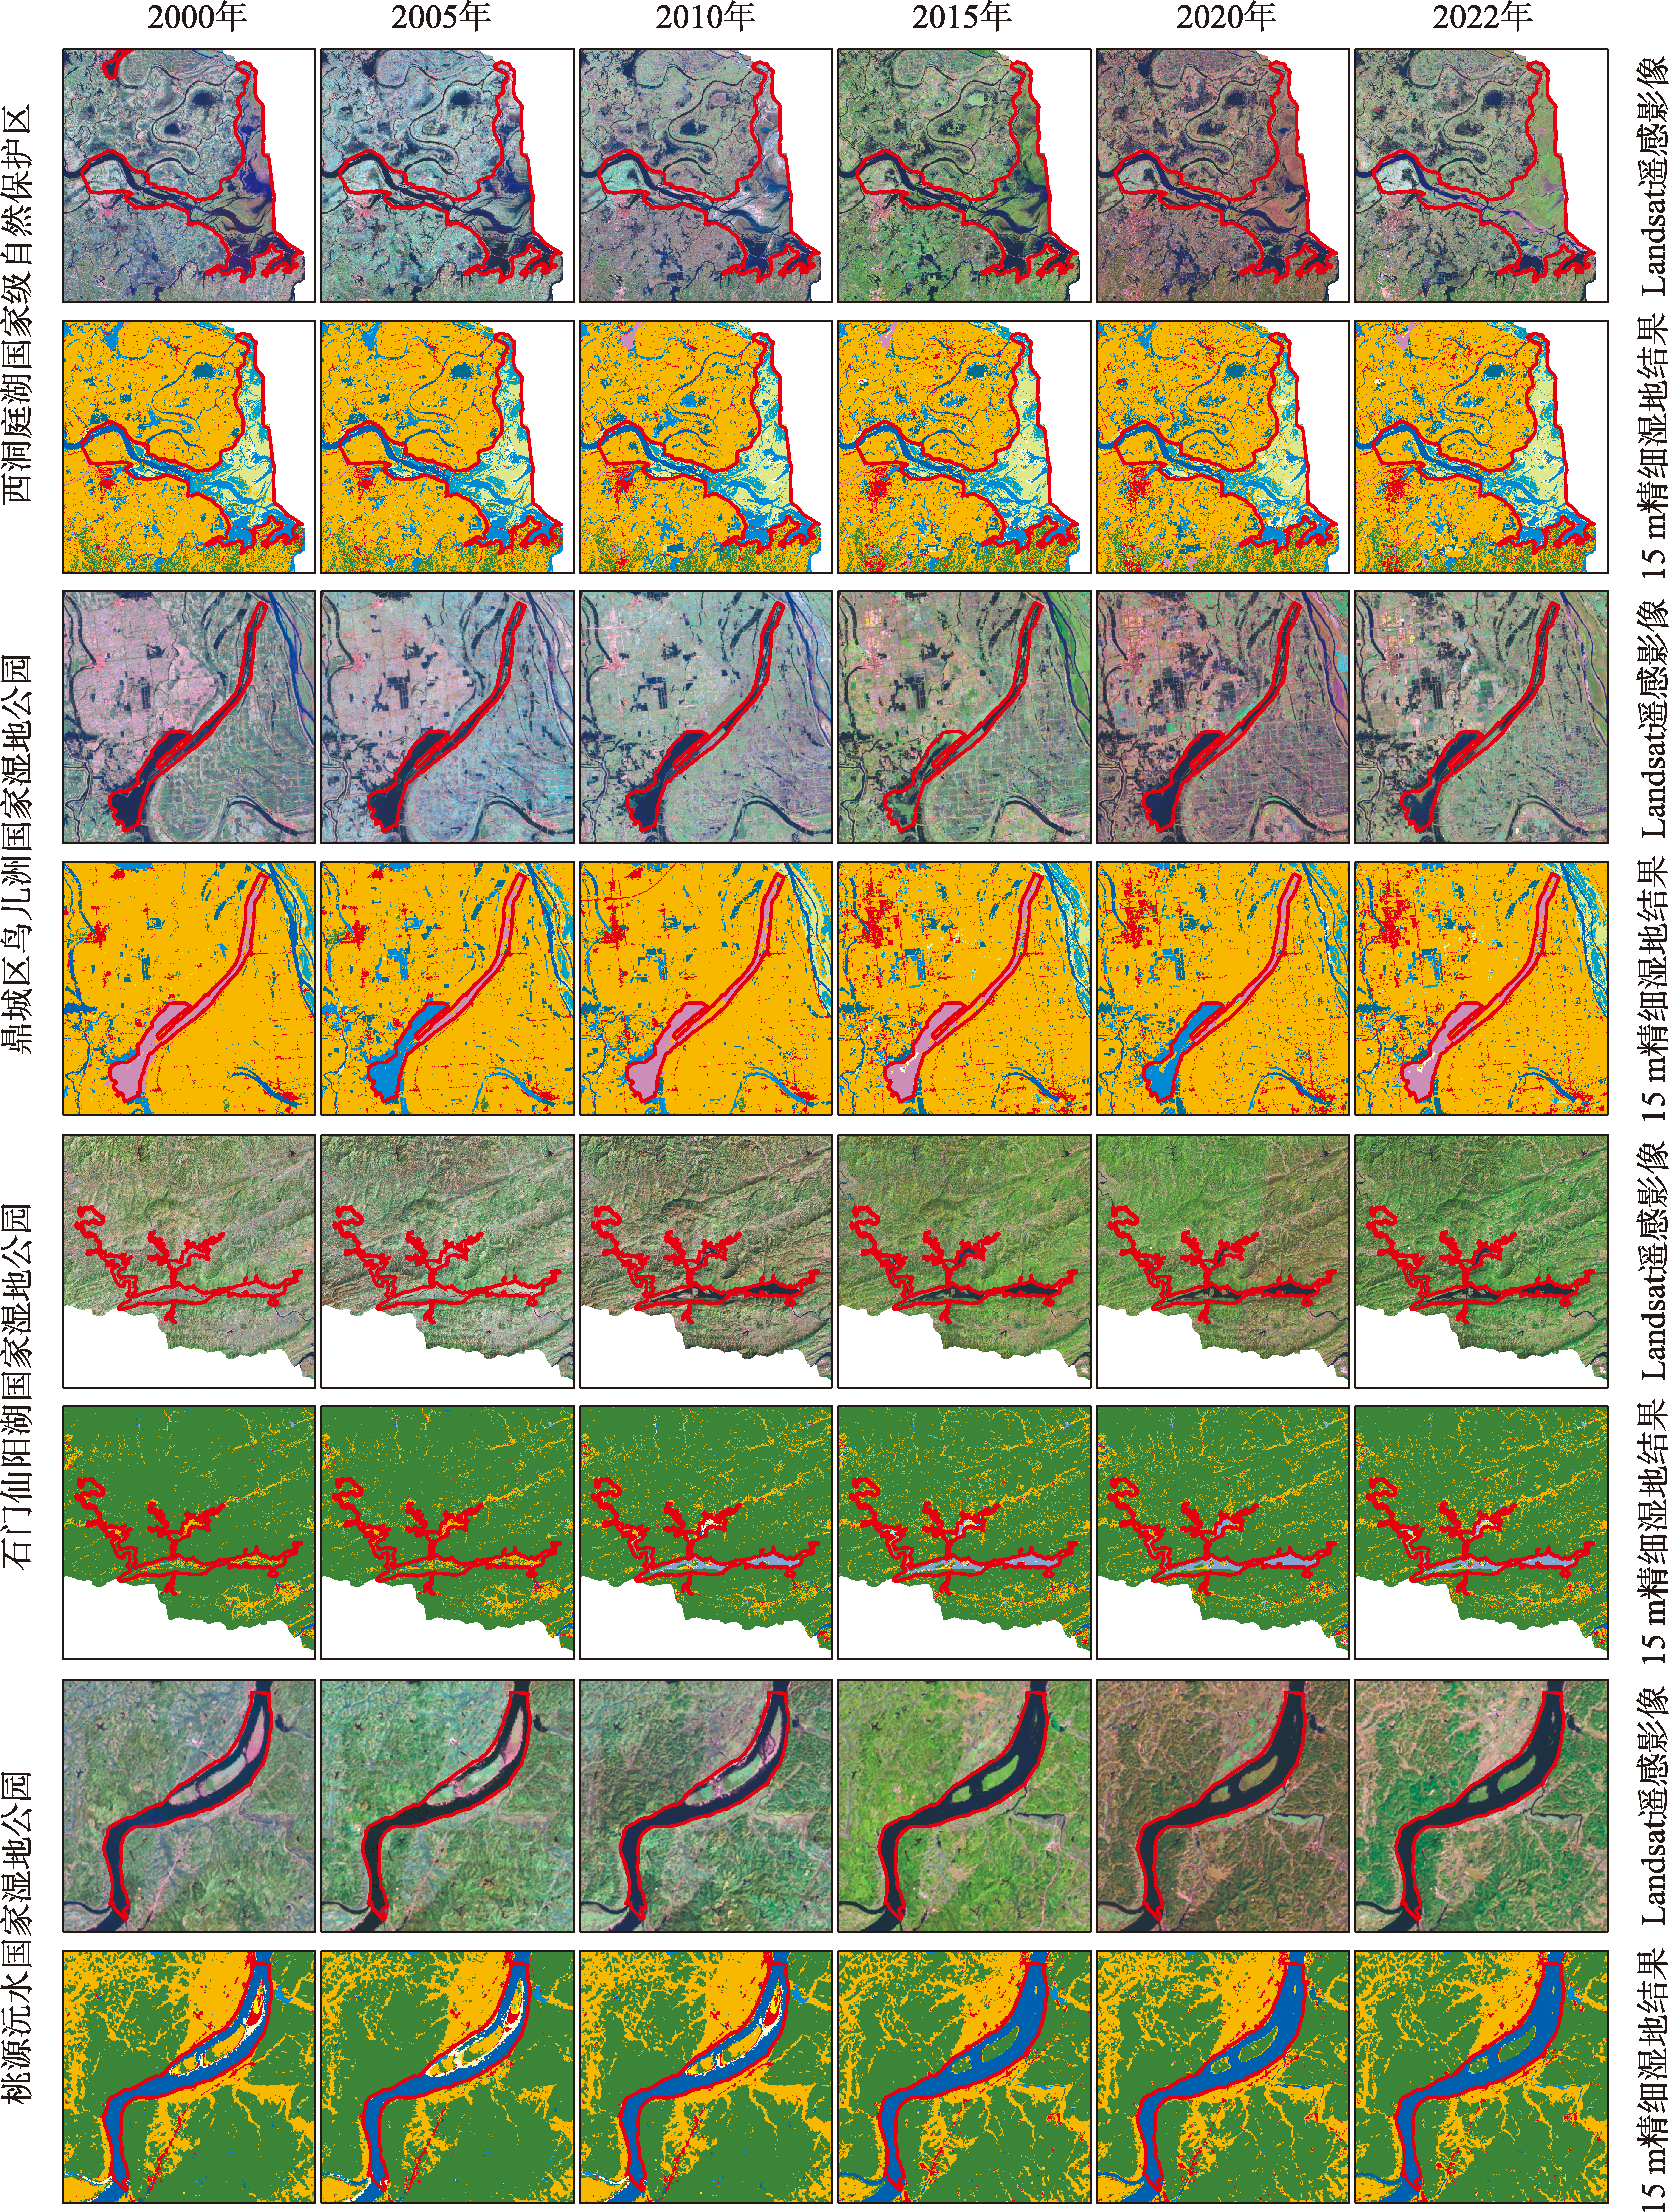
Fig. 8
Spatial distribution of wetland change in Changde city from 2000 to 2022
Other figure/table from this article
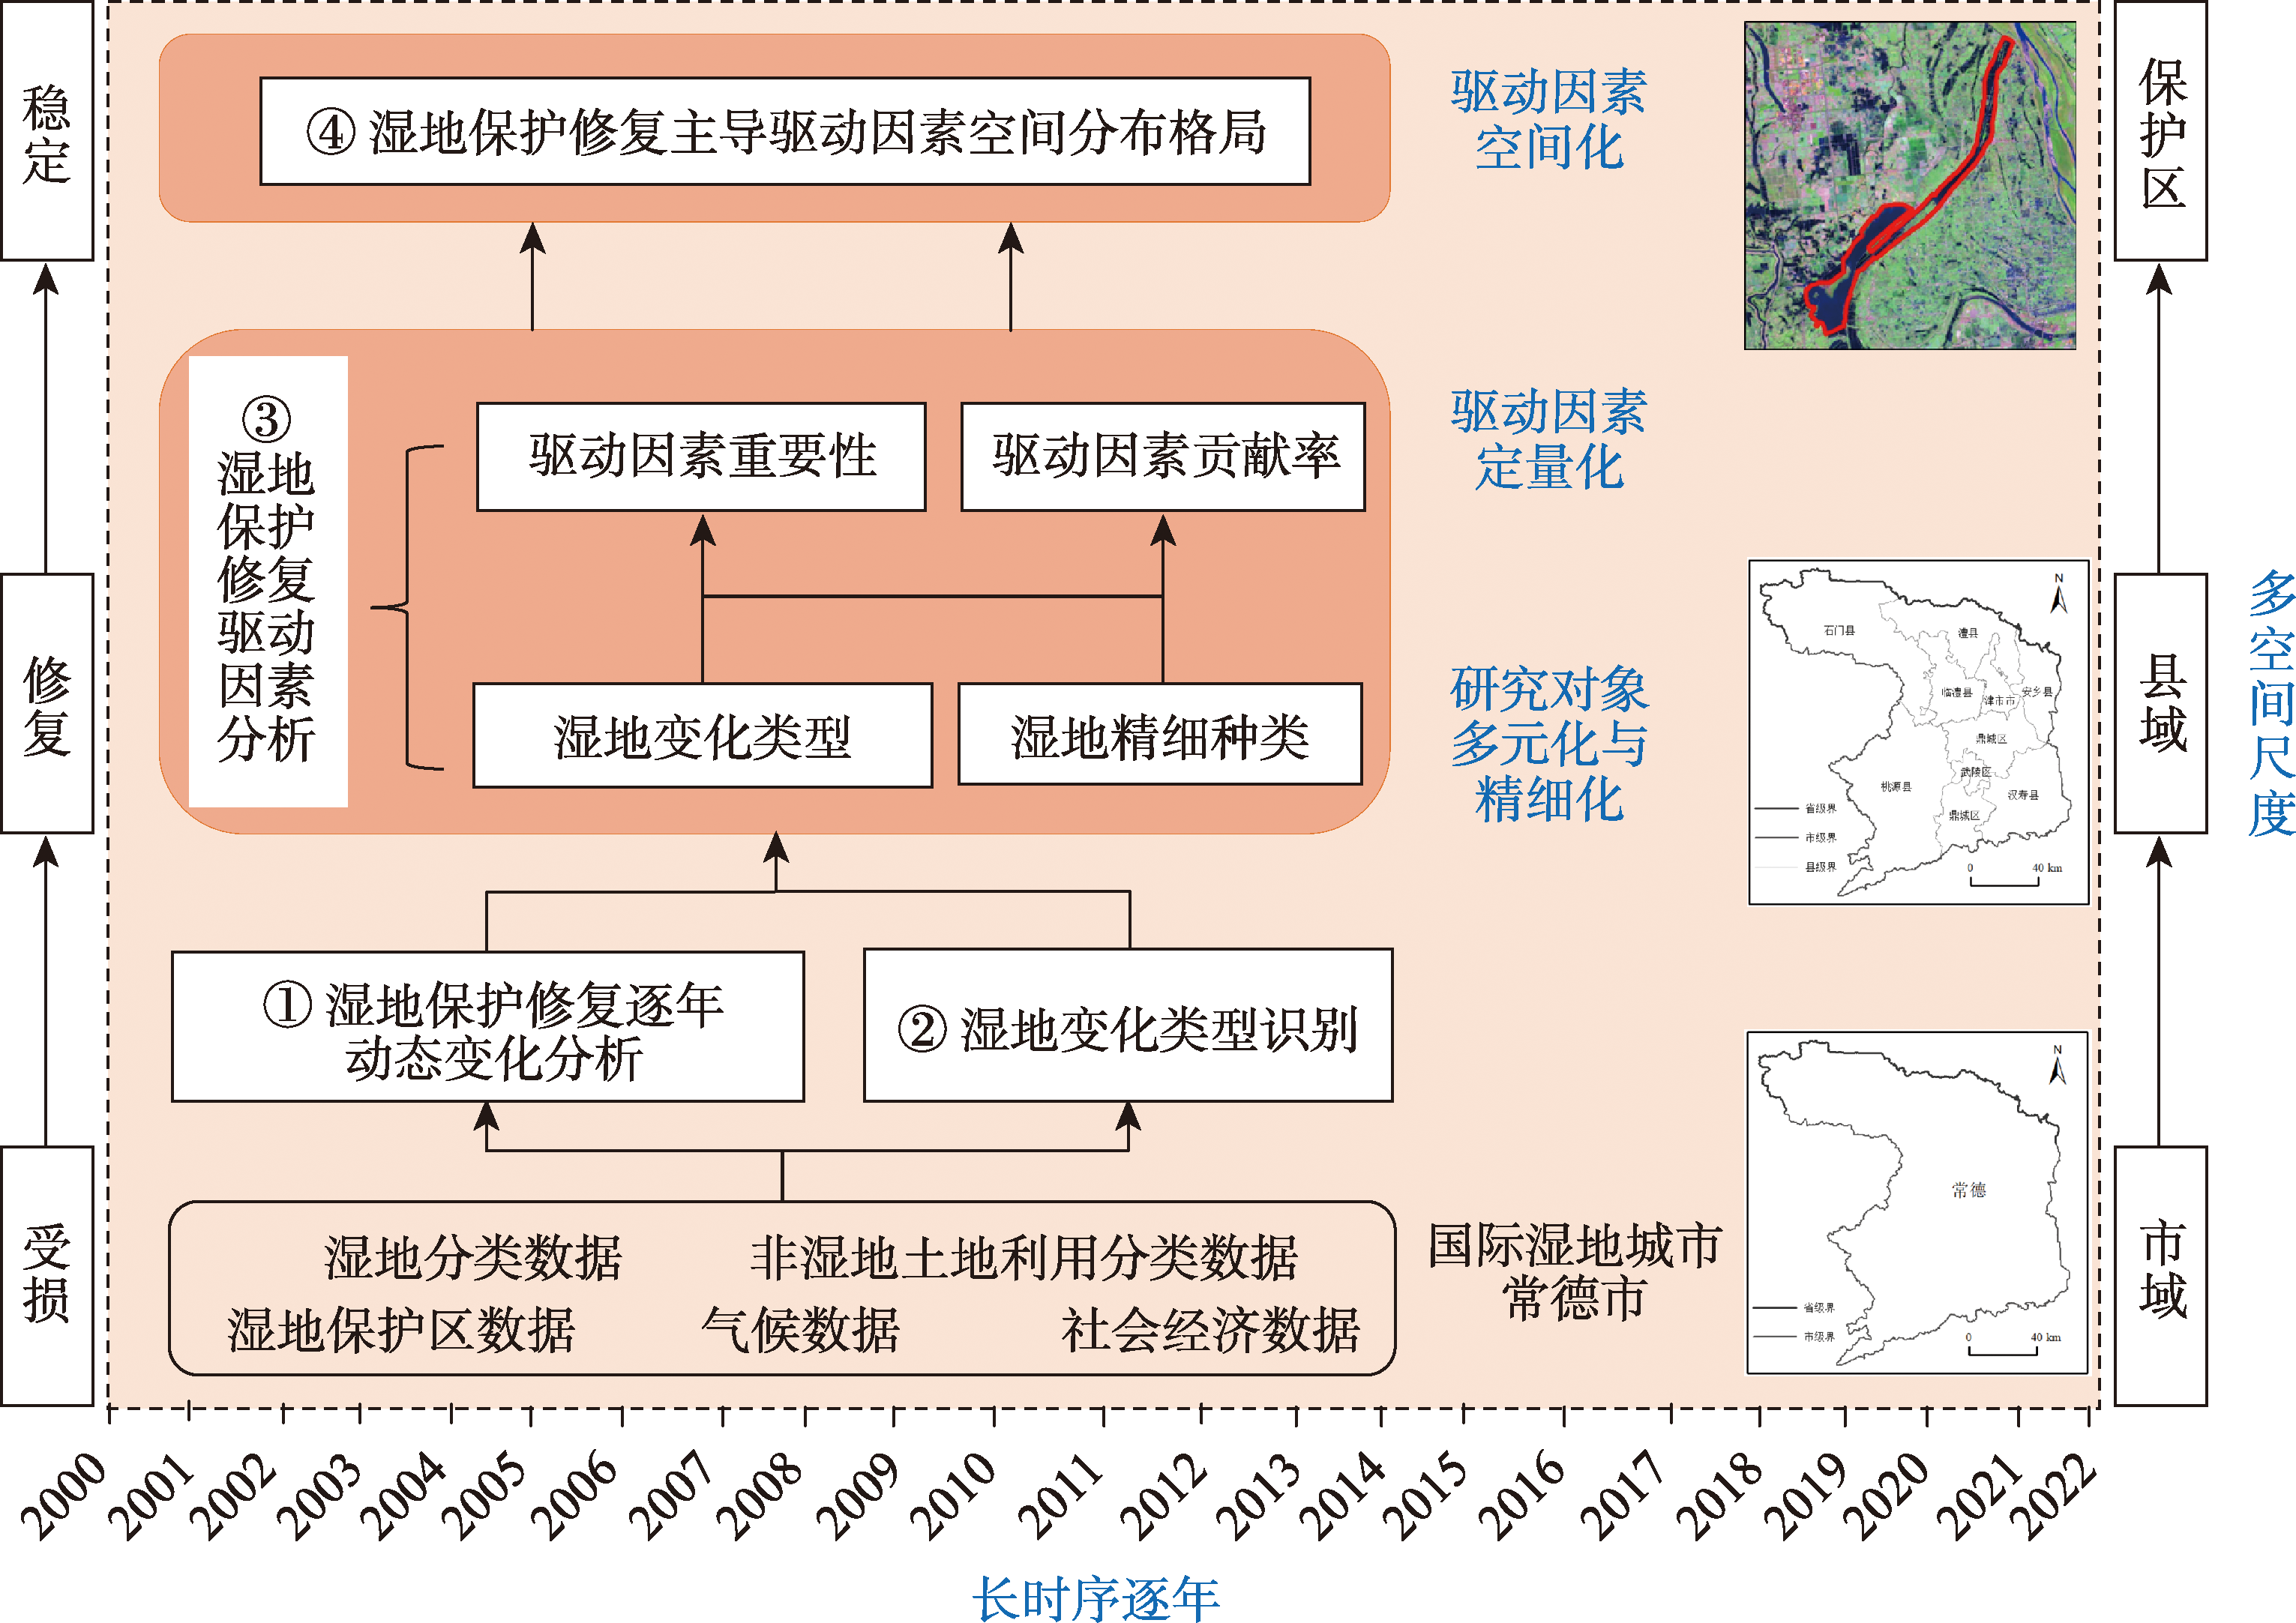
Fig. 1
Research roadmap
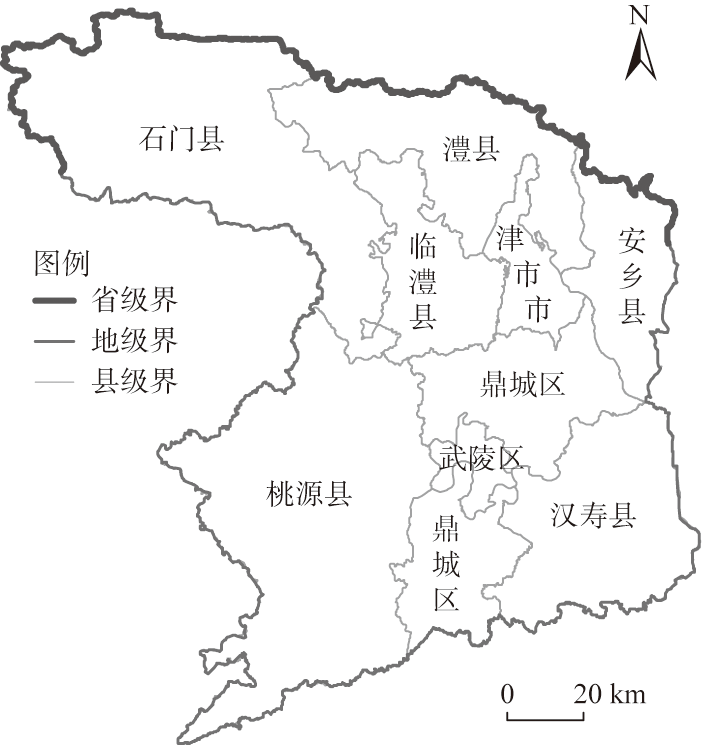
Fig. 2
Overview of the research area (Changde city)
Table 1
Summary of major wetland reserves in Changde city
Table 2
Types and definitions of wetland change drivers
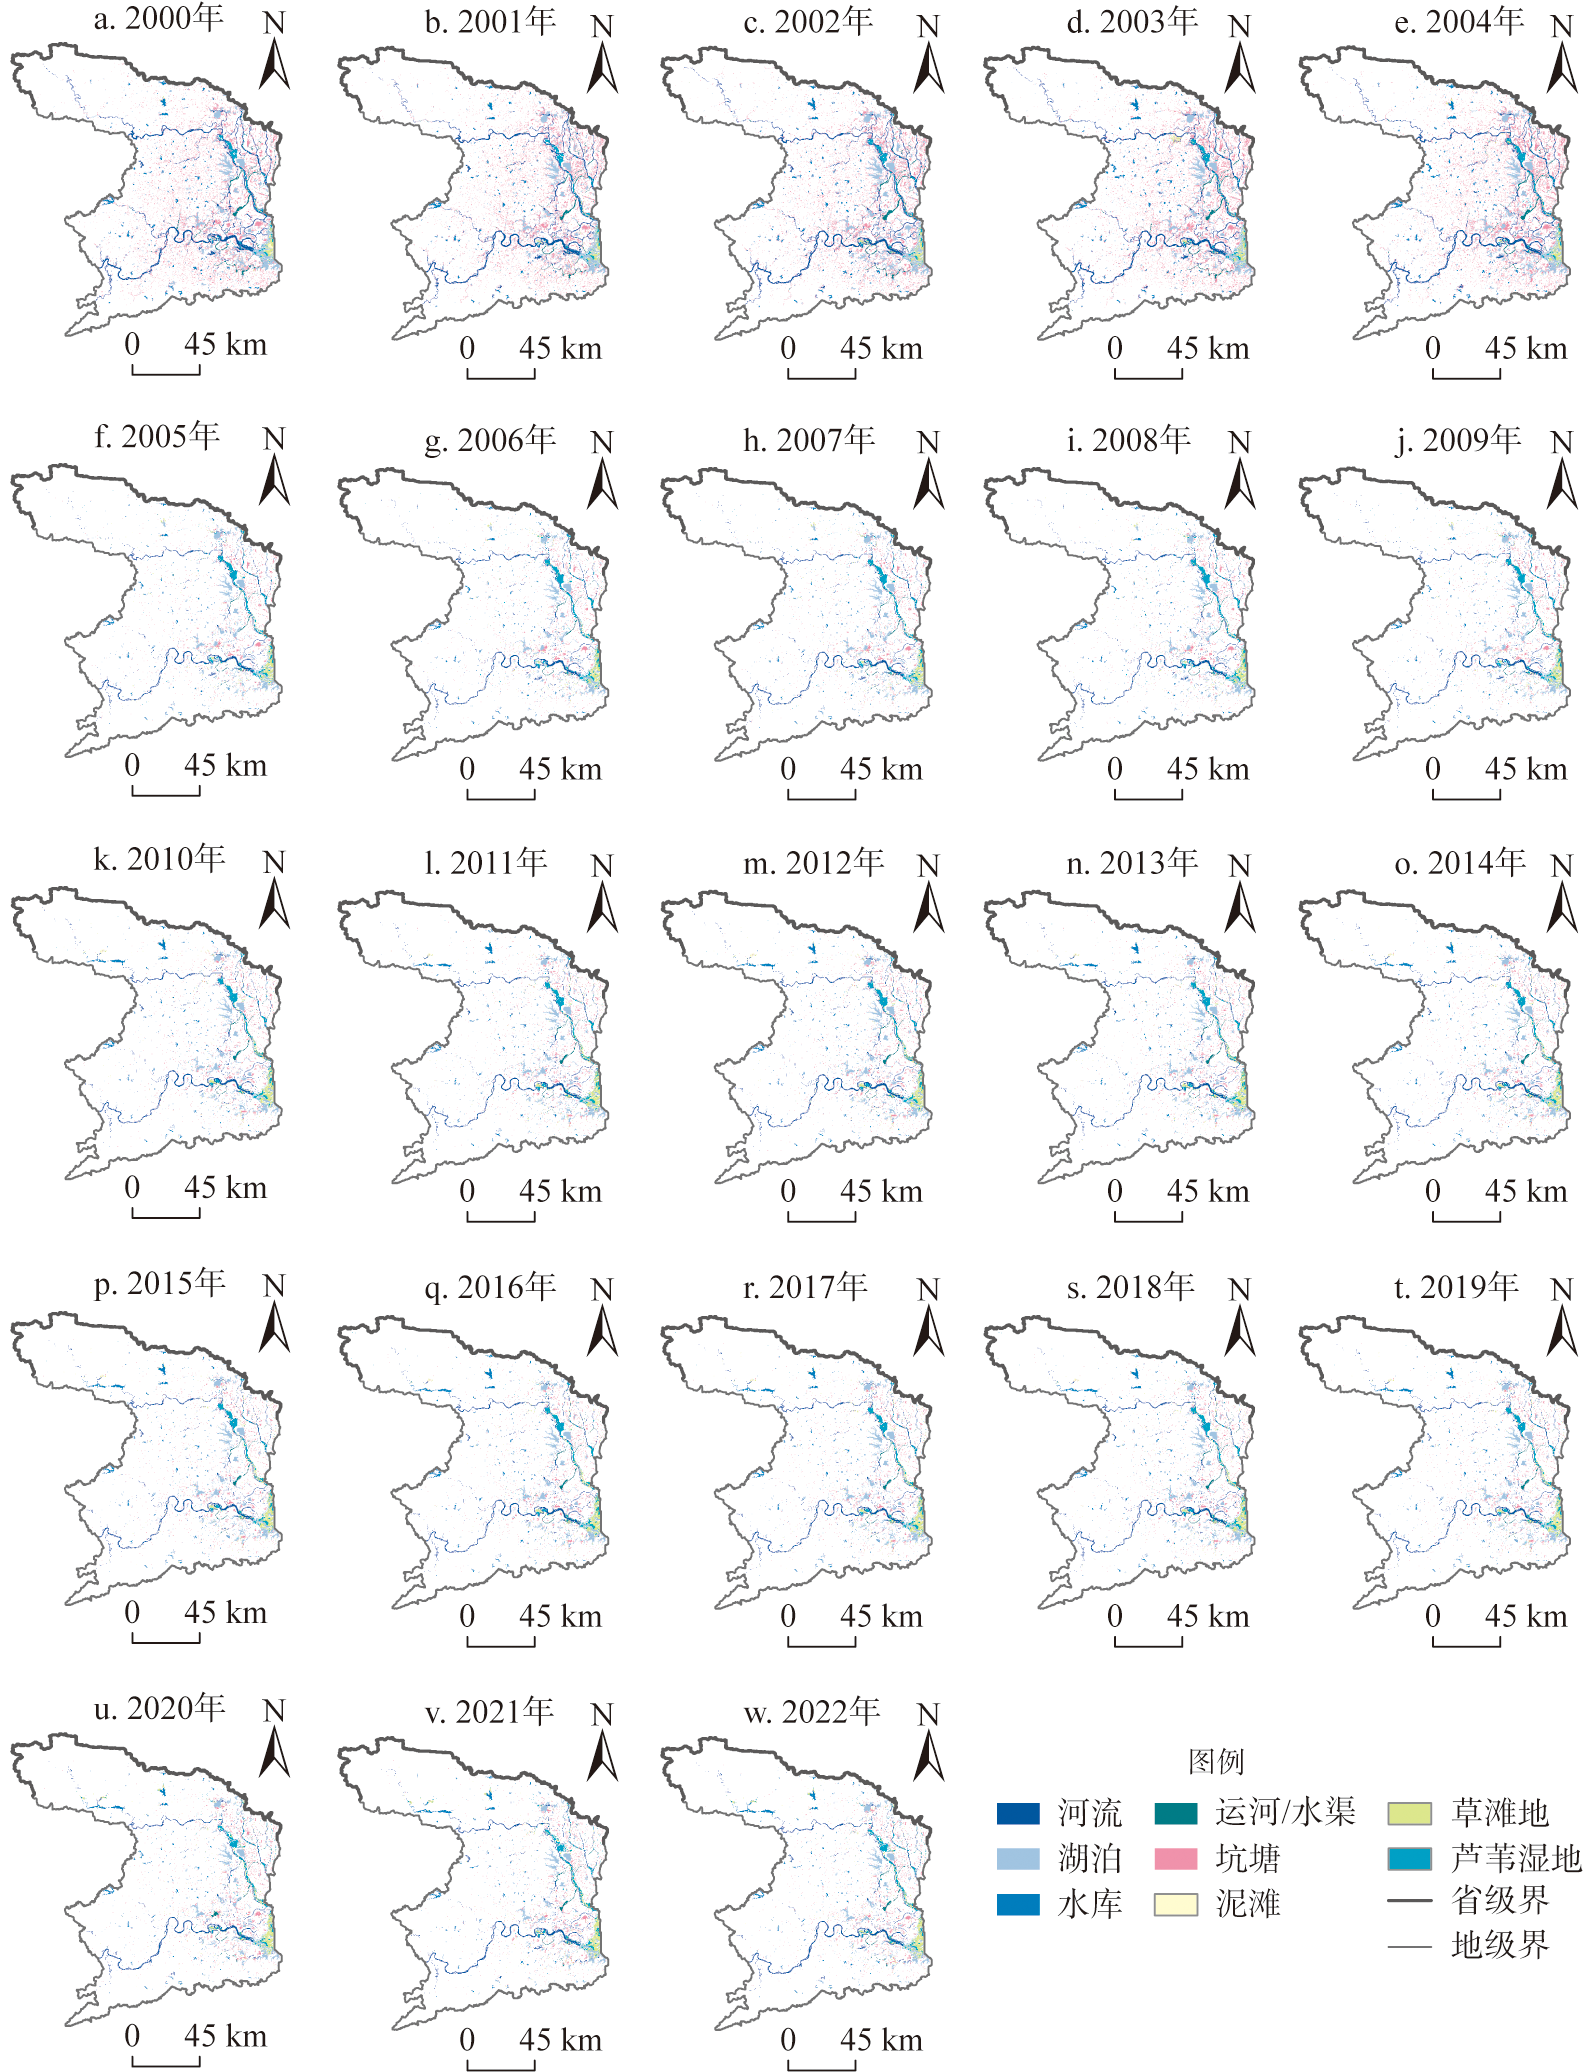
Fig. 3
Spatial distribution of wetlands in Changde city from 2000 to 2022
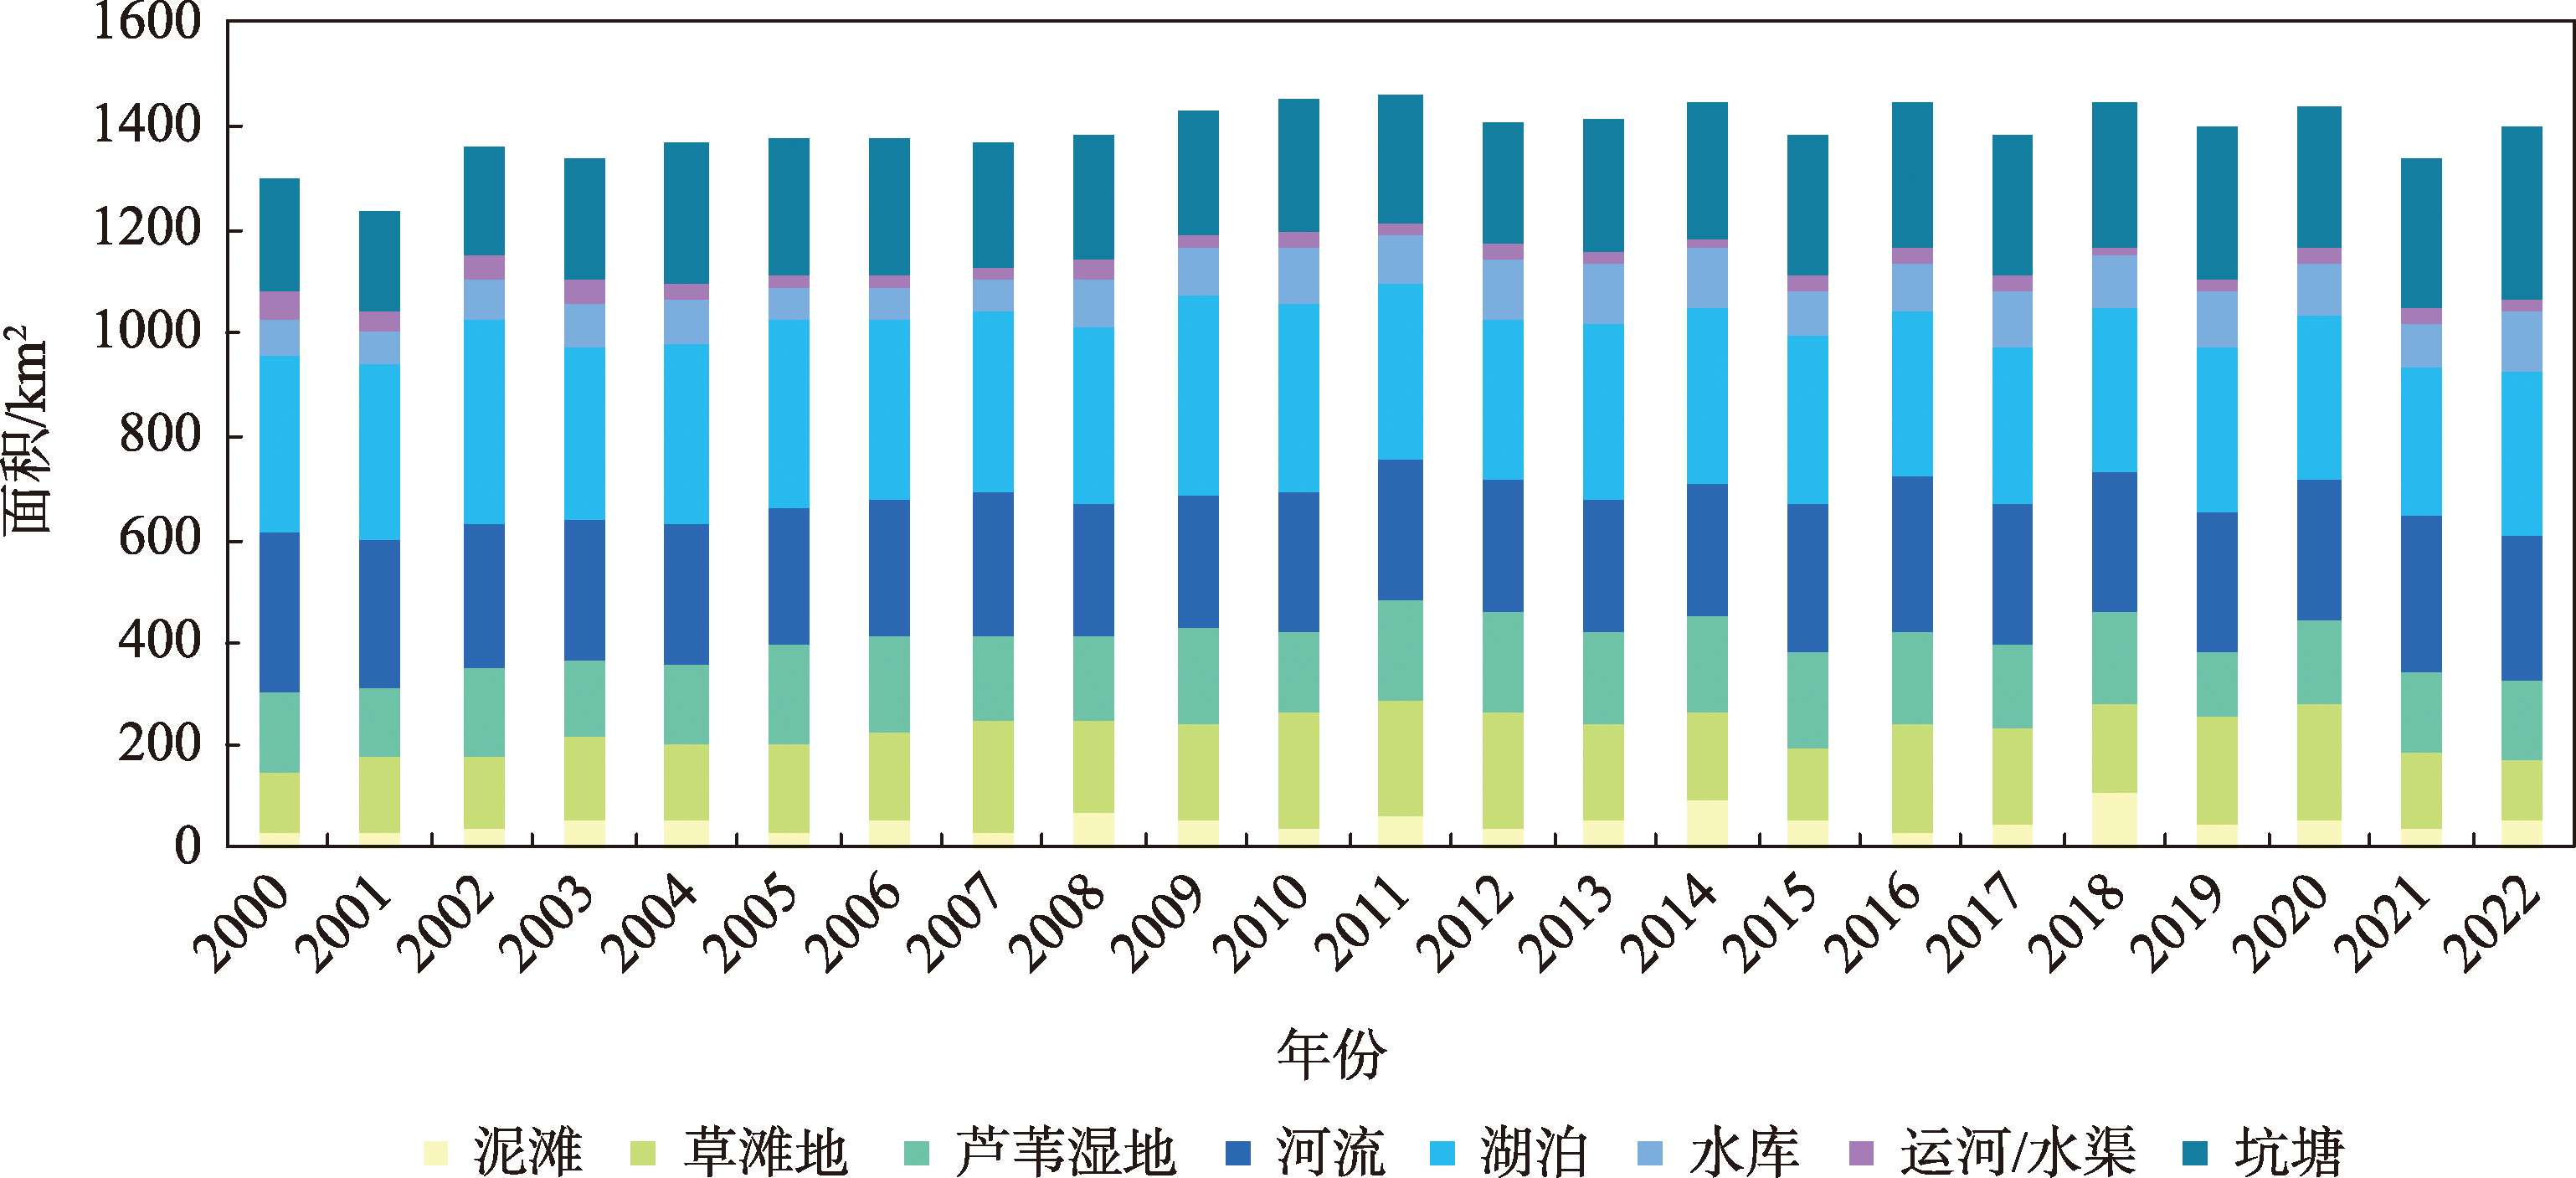
Fig. 4
Accumulated bar chart of wetland area of Changde city from 2000 to 2022
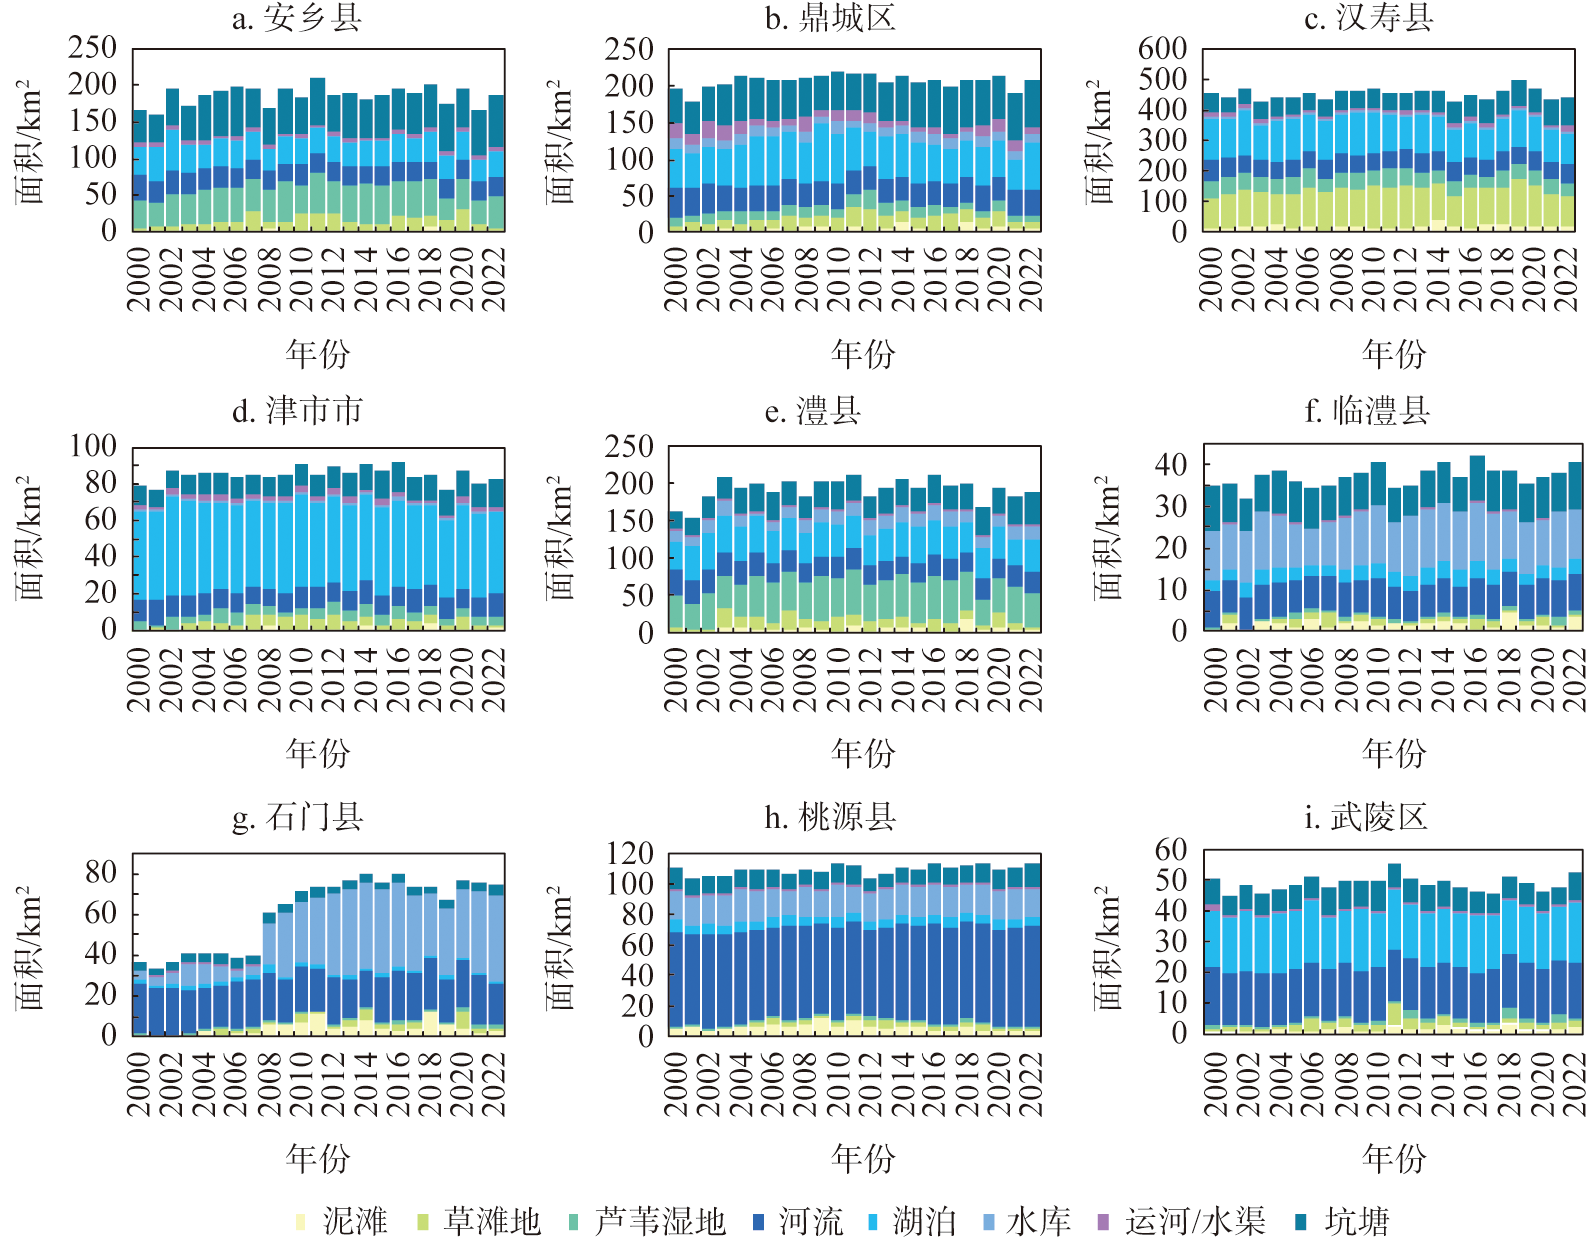
Fig. 5
Accumulated bar chart of wetland area in counties of Changde city from 2000 to 2022
Fig. 6
Wetland changes in typical wetland reserves of Changde city from 2000 to 2022
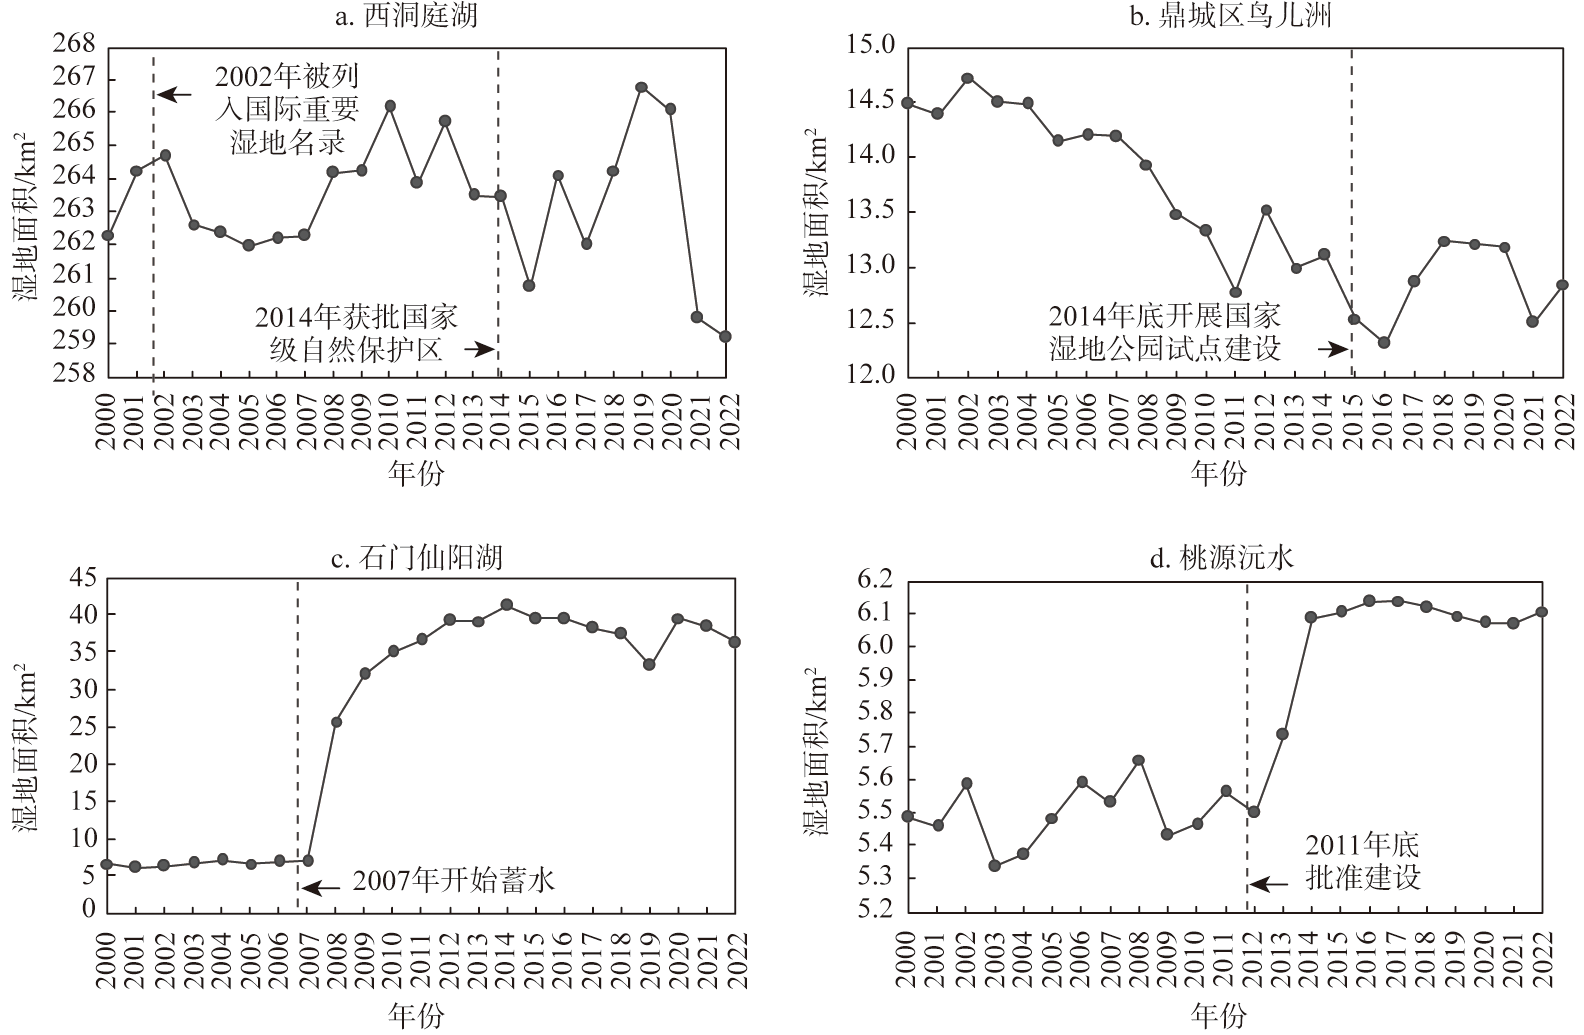
Fig. 7
Changes of wetland area in typical wetland reserves of Changde city from 2000 to 2022
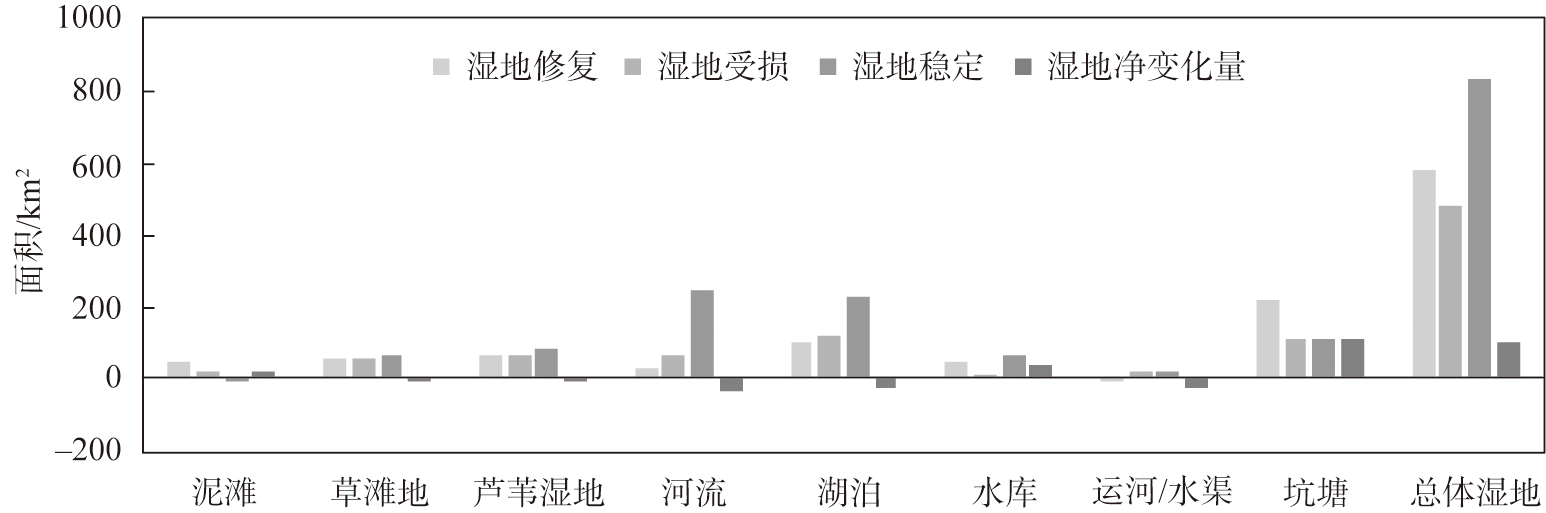
Fig. 9
Changes of different wetland types in Changde city from 2000 to 2022
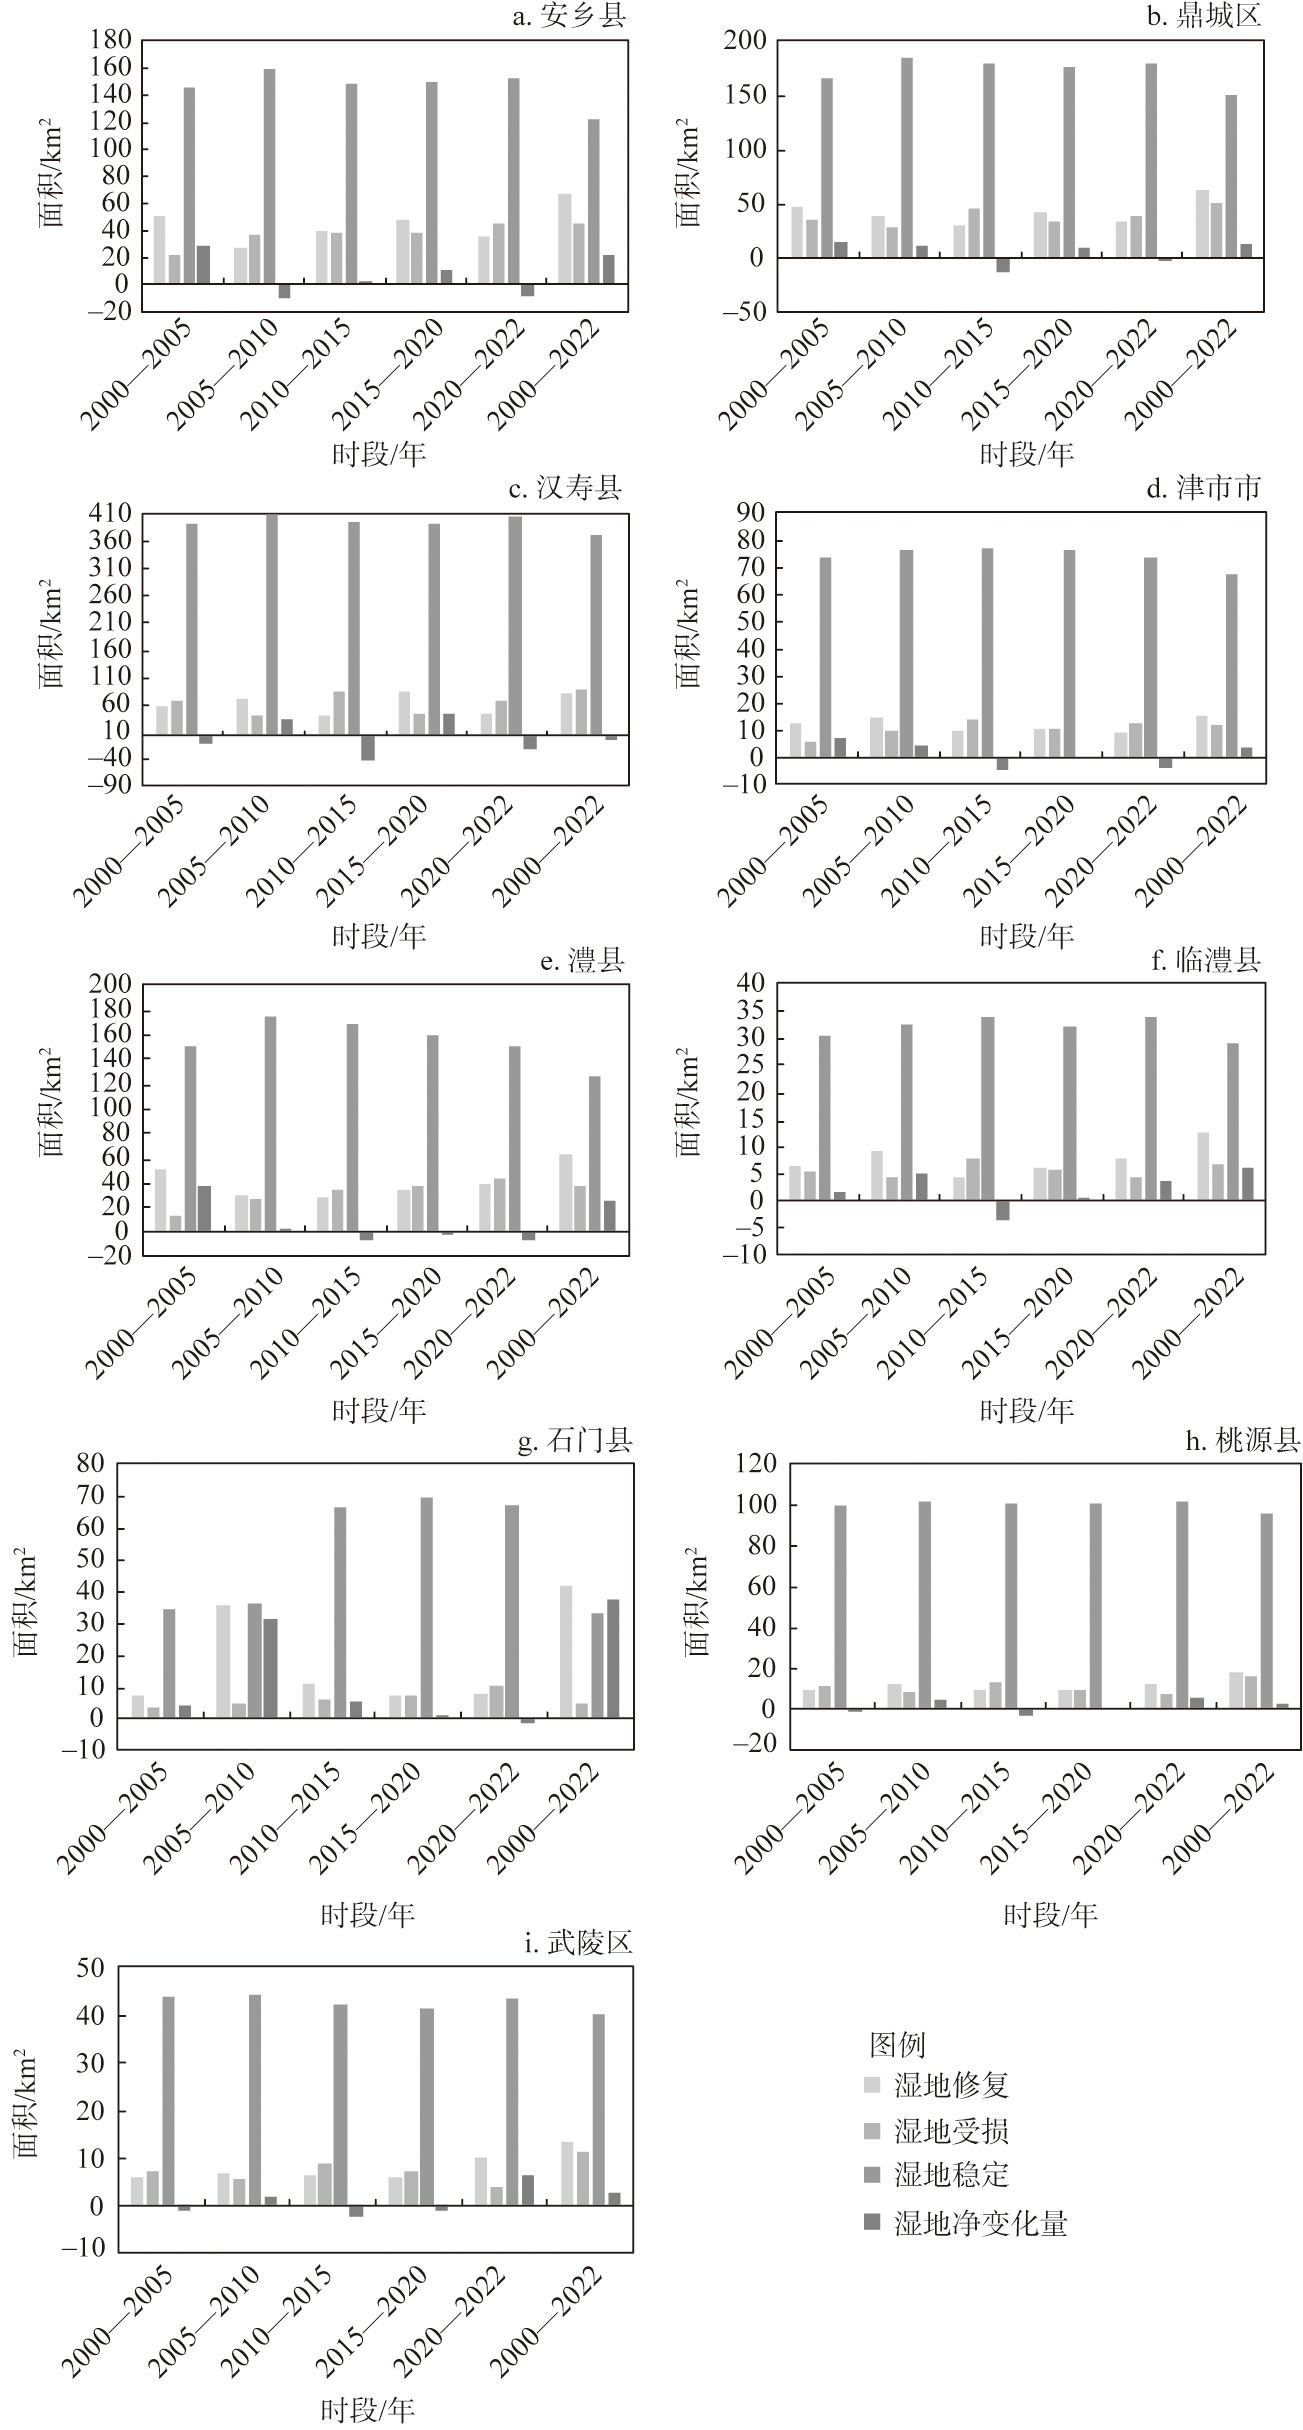
Fig. 10
Change of wetlands in counties of Changde city from 2000 to 2022
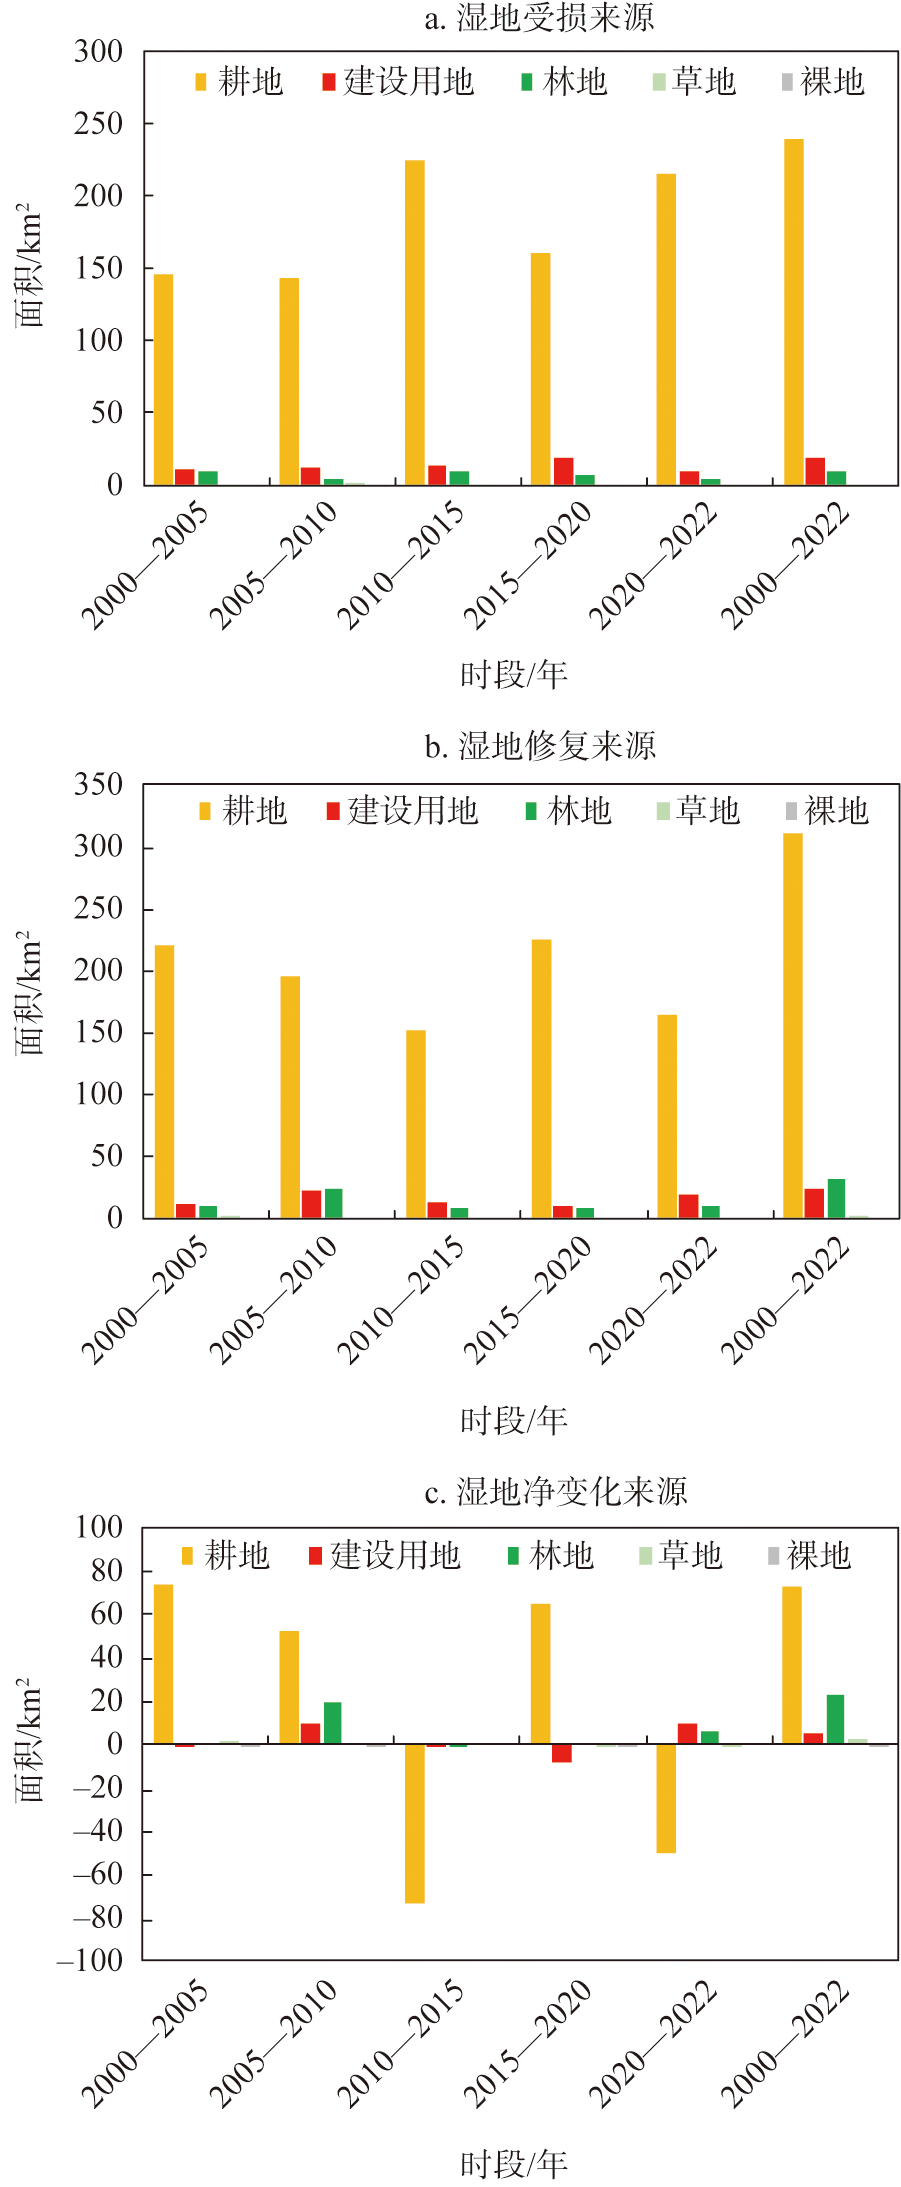
Fig. 11
Land sources of wetland changes in Changde city from 2000 to 2000
Table 3
Partial least-square regression results of factors influencing wetland changes in Changde city from 2000 to 2022
Table 4
The importance and regression coefficient of different wetland species change drivers in Changde city from 2000 to 2022
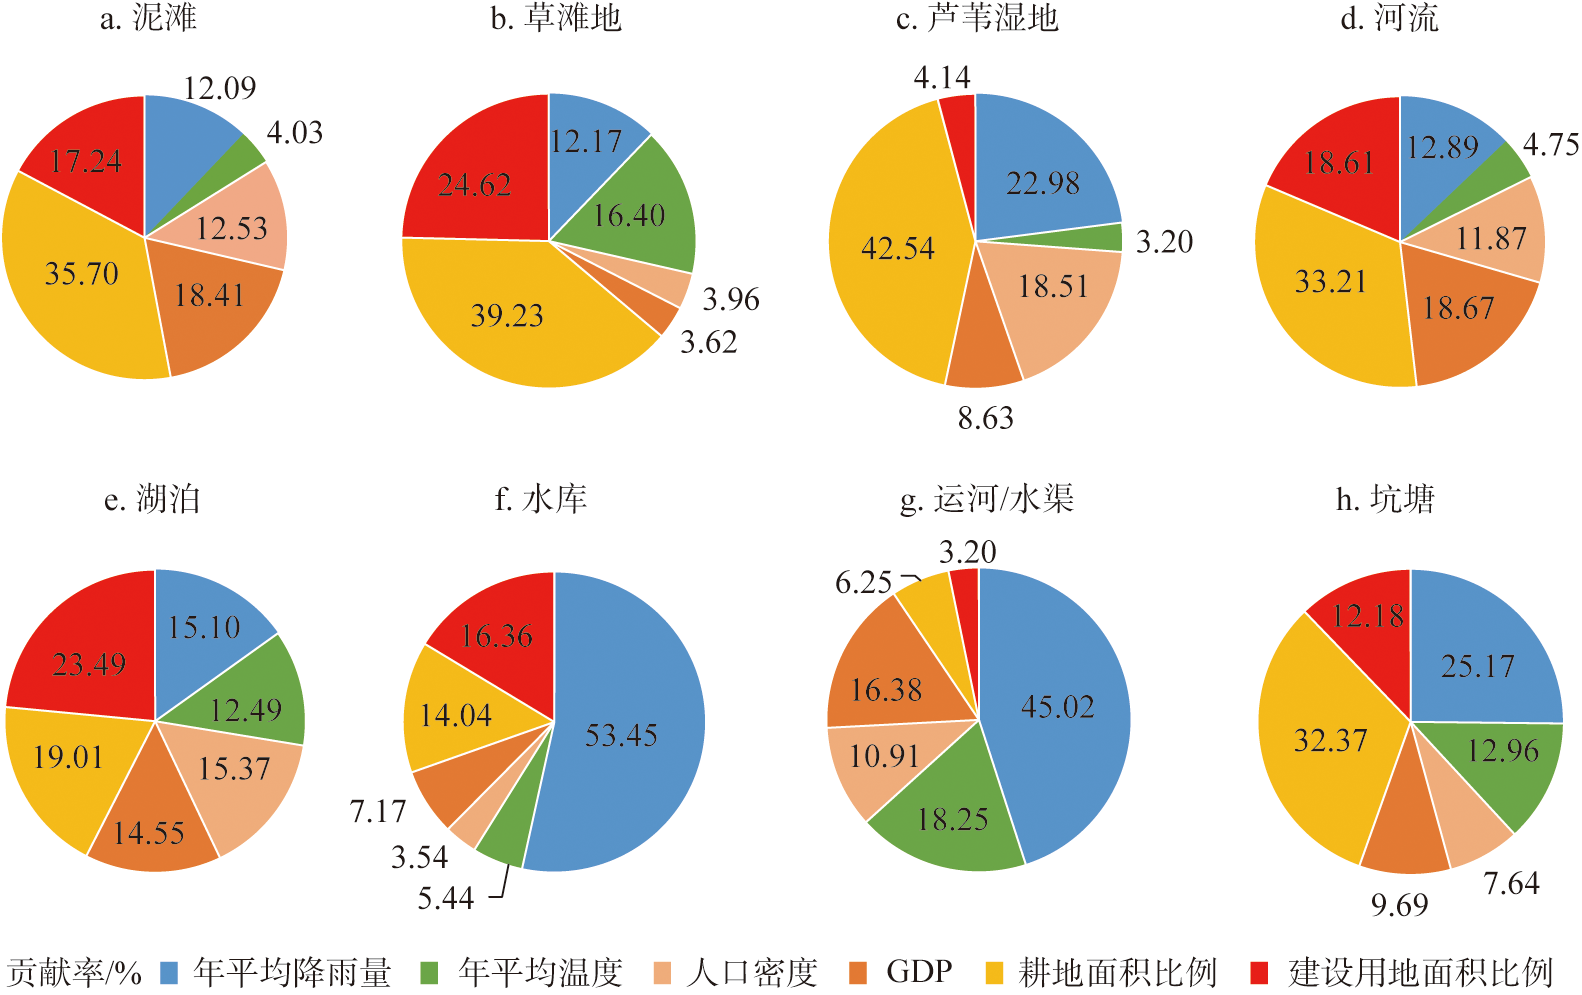
Fig. 12
Contribution rate of driving factors for changes in different wetland types
Fig. 13
Spatial distribution of dominant driving factors for wetland changes in Changde city from 2000 to 2022