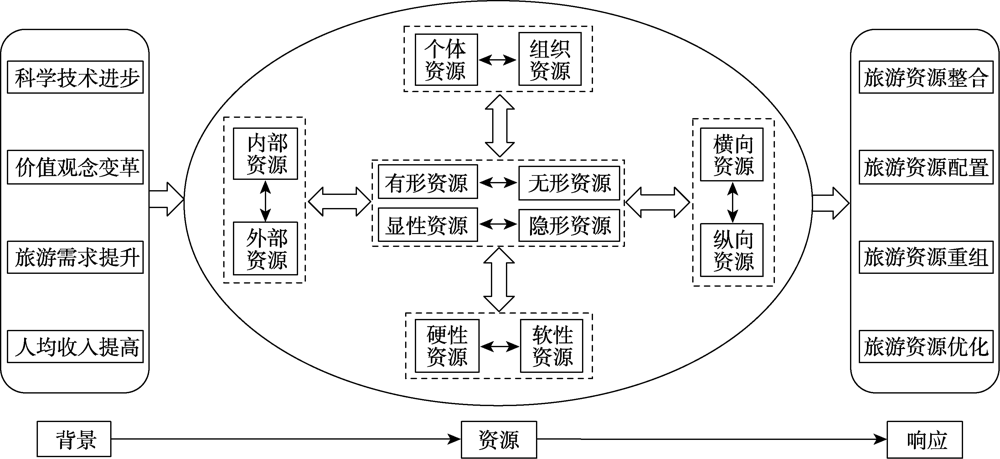
Tourism resources, the basic elements of tourism activities, determine the benefits of the development and utilization of tourism resources. The relationship between tourism resources and major national strategies has become increasingly close. Establishing a new viewpoint of tourism resources is a re-understanding and re-practice of regional development practices, which can put forward a new topic for tourism resources research. We sorted out and summarized the development context of tourism resources research under the traditional view of tourism resources. The results showed that: (1) The research contents of tourism resources are constantly enriched, and the research directions are becoming more and more diversified. Basic research actively makes great contributions to serve the national major strategies, as well as regional economic and social development. To a certain extent, the positive interaction between "theory guides practice" and "practice enriches theory" has been realized. (2) The new concept of tourism resources refers to the dynamic process of people integrating, configuring, reorganizing and optimizing tourism resources from different sources, levels, structures, and contents under the background of scientific and technological progress, changes in value concepts, increased tourism demand, and per capita income. It is regarded as an active response of people's cognition to the changes of tourism resource characteristics. The new outlook on tourism resources is a fundamental breakthrough to the traditional view of tourism resources, presenting new viewpoints on resource value, new resource utilization, new resource development, new resource benefits and new resource space. (3) This paper constructs a "five-dimensional integration" tourism resources research system from a new perspective of tourism resources, especially the value conversion of tourism resources, the sustainable use of tourism resources, the integrated development of tourism resources, the regional benefits of tourism resources, and the spatial reconstruction of tourism resources. It aims to strengthen the cross-regional aggregation, competition and integration of tourism resources, and to reveal the interaction mechanism of the development and utilization of cross-regional tourism resources. (4) There are some new problems and topics in the development and utilization of tourism resources in the new perspective of tourism resources. The integration of multiple disciplines and the introduction of new methods is an inevitable trend for comprehensive, dynamic, regional and systematic research on the development and utilization of tourism resources.
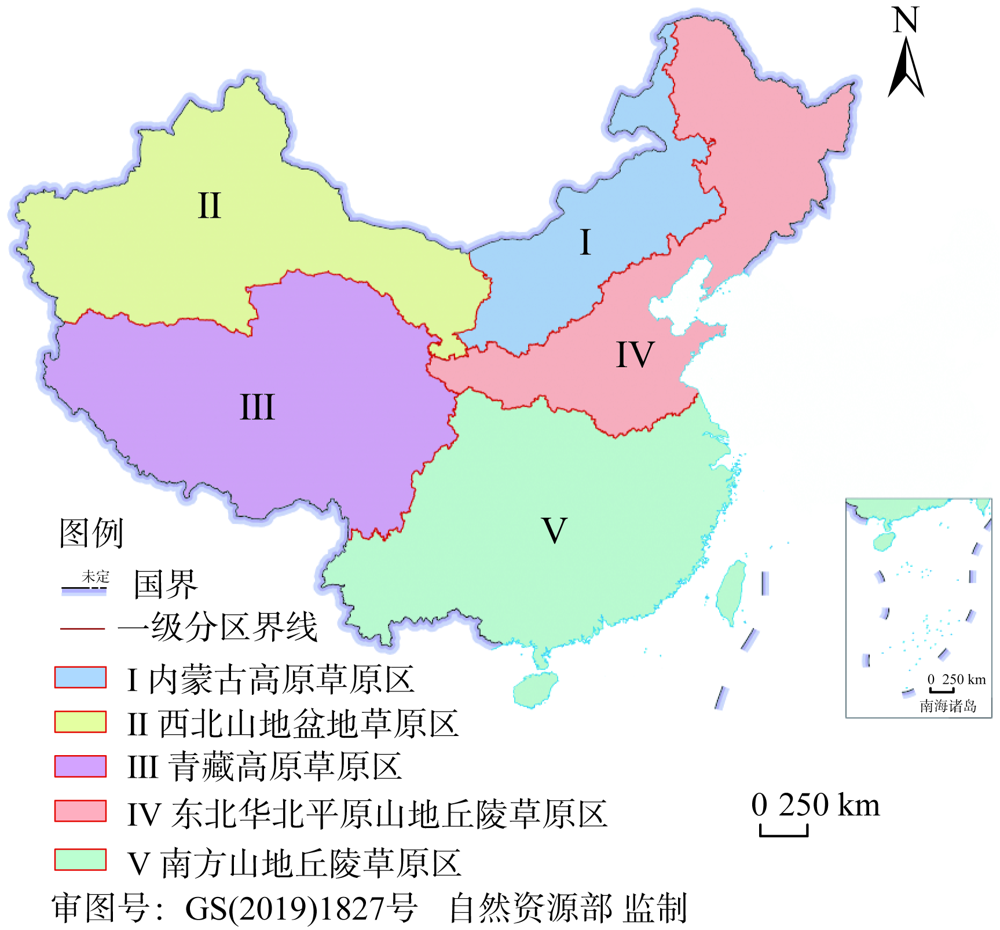
Grasslands in China are key natural resources and ecosystems, which provide very important ecological functions such as primary production, water reservoir and regulation, erosion and dust control, biodiversity conservation, as well as socio-economic values such as sustainable animal husbandry, pastoral livelihood, ethnic culture and tradition. Scientific protection, rational utilization and effective restoration are the fundamental basis for the sustainable grassland resources and ecosystem management. With the reformation of National Forestry and Grassland Administration derived from the re-arrangement of Chinese central government institution and organization in 2018, the position of grasslands in ecological civilization construction in China has been promoted. In the process of ecological civilization construction in the New Era, the regionalized management of grassland resources and ecosystems for high-quality development based on geographical variation and functional characteristics is an emerging issue to be solved. Grassland regionalization in the New Era should be oriented to national strategy of "Systematic Governing Life Community of Mountains, Rivers, Forests, Farmlands, Lakes, and Grasslands", and focused on new concepts of "Green Development" and "Construction of Beautiful China". In this study, methods including literature reviews, professional questionaries and experts consultation were applied to develop China's grassland regionalization system with the guiding ideology "Prioritized Ecological Protection, Coupled Green Development". Five rules include harmony with eco-geographic differentiation, prioritization of key functions, coordination with industry patterns, integration with historical tradition, and integrity of administrative units. The grasslands in China were divided into 5 first-level zones (macro-regions, including Inner Mongolia Plateau Grassland Zone, Northwestern China's Mountain-Basin Grassland Zone, Qinghai-Tibetan Plateau Grassland Zone, Northeastern and Northern China's Plain-Mountain-Hill Grassland Zone, Southern China's Mountain-Hill Grassland Zone), 47 second-level zones (sub-regions) and 2899 third-level zones (micro-regions). The regionalization was comprehensive, coordinative, and closely linked with the times. The ecological functions and potential industries for development in different zones were proposed so as to provide a sound basis for the grassland ecological civilization construction and holistic governing the mountains, rivers, forests, farmlands, lakes, and grasslands in China.
In this paper, the land factor is introduced into the water-energy-food system, and the coupling coordination model is used to study the spatio-temporal change characteristics of the water-energy-food-land system in the Beijing-Tianjin-Hebei Urban Agglomeration from 2004 to 2017. The results show that: (1) On the spatial scale, the construction land of the study area diffuses from the center to the periphery. In terms of land use pattern of the urban agglomeration, the area of cultivated land and construction land showed a relatively obvious decline and growth trend, respectively. (2) The integration of land into the water-energy-food system reduces the coupling degree and co-scheduling of water-energy-food systems in most cities of this urban agglomeration. (3) The coordination level of land and water-energy-food subsystem will be superimposed or offset, which will affect the coupling coordination of water-energy-food-land system. The research enlightenment of this paper is that considering the coordinated development of water, energy and grain, the Beijing-Tianjin-Hebei Urban Agglomeration should understand the impact of land on the whole and internal subsystems of the water-energy-food system, allocate resources reasonably and optimize the industrial layout according to the city's own resource advantages, so as to achieve sustainable development.
Considering the net carbon sink and non-point source pollution emissions in grain production, this paper constructs a global EBM model to calculate the grain production efficiency of 30 provincial-level regions and three functional areas in China from 2001 to 2018, and investigates the dynamic evolution trend of China's grain production efficiency with the help of dynamic distribution model. The results show that: (1) The overall level of grain production efficiency in China is not high, showing a trend of first decreasing and then increasing during the sample period, and the grain production efficiency in the main producing areas is higher than that in the main selling areas and the production and marketing balance areas. (2) There are differences in the distribution dynamics of grain production efficiency among the three functional areas. The main production areas change to "two-level differentiation" from "multi-level differentiation", and the regional gap is gradually narrowing. The differentiation degree of the main sales areas has been intensified. The "multi-level differentiation" in the production and marketing balance area has been gradually strengthened. (3) China's grain production efficiency has a trend of gathering to medium and high levels. Compared with the provinces with high efficiency, those with low efficiency have obvious "poverty trap", and the vicious circle of low-level food development is not easy to break.
The countries along the Belt and Road are major population agglomeration areas in the world. Focusing on the relationship between humans and cereals, we examined the spatio-temporal patterns of the land resource carrying capacity during 1995-2017 from the whole region and national scale. The results showed that, during the study period: (1) The total and per capita cultivated land of the countries along the Belt and Road dropped to 696 million hectares and 0.15 hm2/person, which are respectively about 50% and 80% of the global level. The per capita cultivated land is declining in around 80% of the countries. (2) The carrying capacity of land resources increased to 4.60 billion people. The carrying capacity of nearly 90% of the countries was increasing, but that of most countries in West Asia and the Middle East declined. (3) The average carrying capacity of land resources increased to 90 persons/km2, which is 1.5 times at the global level; in Bangladesh, Hungary and Vietnam, it exceeded 300 persons/km2. (4) The human-cereals relationship had shifted from overloading to critical overloading. Countries with cereals surpluses increased, especially large cereals-producing countries with much cultivated land and better production conditions. The land has still overloaded for half of the countries in the Belt and Road, and these countries are mostly located in arid climate or islands zones. The results will contribute to strengthening cooperation between countries in the Belt and Road region for food security and improving the scientific nature of project construction layout.
As a new driving force of economic growth, green innovation is an important engine for promoting ecological protection and high-quality development in the Yellow River Basin. This paper uses the network DEA model containing unexpected output to measure the green innovation efficiency of 79 prefecture-level cities (prefectures and leagues) from 2003-2018. Furthermore, it adopts the kernel density estimation and center of gravity-center model and standard deviation ellipse model to examine the spatio-temporal evolution pattern of green innovation efficiency, and explore the influencing factors. The results show that: (1) The green innovation efficiency level in the Yellow River Basin is relatively low, but the efficiency of green innovation, the efficiency of science and technology research and development and the transformation efficiency of innovation achievements show a significant upward trend as the elapse of time. (2) There are significant spatial imbalance of green innovation efficiency in the study area. The efficiency of green innovation in the lower reaches of the basin is higher than that of the upper reaches, and the efficiency of green innovation of the upper reaches is higher than that of the middle reaches. The efficiency center of green innovation is gradually moving towards the southeast, and the efficiency of the middle and lower reaches of the basin is significantly improved. The standard deviation ellipse distribution is dominated by northwest-southeast direction, showing a relatively stable north-south direction and a trend of east-west development. The coverage area of the ellipse declines, and the differences of green innovation among regions are narrowing. (3) The efficiency of green innovation in the basin has a positive spatial spillover effect. Increasing per capita income, increasing teacher input, and strengthening environmental regulations improve the efficiency of green innovation in the entire river basin and the upper, middle and lower reaches. The positive effects of industrial structure and the actual utilization of foreign capital on the green innovation efficiency of the whole basin are not consistent with those of each sub-basin. We should take efficient measures according to the actual development of various regions, such as giving full play to the green innovation driving role of producer services, and opening wider to the outside world.
This study takes Western Chongqing, a national urban-rural integration development pilot area, as the research area, and 2009-2019 as the research period. Based on the systematic analysis, according to the research ideas of ideological origin, theoretical foundation, empirical research and promotion path, this study constructs an index system to measure the rural human settlements system resilience, analyzes its evolution law, and then uses the obstacle degree model to identify the obstacle factors of rural human settlements system resilience. In order to break the multiple constraints of the resilience of rural human settlements in the western part of Chongqing, the paper designs a path to enhance the resilience. Results show that: From 2009 to 2019, the resilience level of rural human settlements in Western Chongqing shows a rising trend, which is characterized by the spatio-temporal differentiation of decreasing from south to north. The resilience of each subsystem shows different degrees of growth in time and significant differences in space. According to the results of obstacle factor analysis and leading obstacle diagnosis in the study area, the resilience improvement can be divided into three types: single dominant barrier type, double barrier type and triple barrier type. Based on this, the differentiation path of rural human settlements system resilience improvement is designed to promote the construction of livable countryside and boost the overall rural revitalization. It has important demonstration effect.
China has entered a new era of rural revitalization, and rural tourism has become a new development path focused by multi-stakeholder. How to carefully evaluate and choose a suitable rural tourism development path has become an important practical and academic issue. This study takes the key rural tourism villages in China as an example, based on the hypothesis of "Origin-Dynamics", and uses geographic analysis methods to explore the exogenous factors of different development paths of rural tourism. The research found that: (1) Rural tourism develops rapidly in southeastern China but slowly in northwestern China, forming two hot spots of the Beijing-Tianjin region and the Yangtze River Delta. The scenic-dependent type presents two hotspots of the Beijing-Tianjin-Hebei region and the Yangtze River Delta, and three sub-hotspots of the Yangtze River Basin, the Bohai Rim and the Hainan Island; the cultural heritage-based types are concentrated in areas of Jiangnan water village culture, Central China Plains culture and Loess Plateau culture, and Lingnan culture; the new agriculture, rural areas and farmers types form the hottest area in the Beijing-Tianjin-Hebei region and Yangtze River Delta, and secondary hot spots in the three major agricultural production areas of the Sichuan Basin, the Lanzhou-Xining Urban Agglomeration and the North China Plain. (2) Elevation, landforms, water systems, eco-geographical divisions, types of terrestrial ecosystems, central cities, and arterial roads are the natural geographic exogenous factors that affect different development paths of rural tourism. (3) The social and economic exogenous factors of different development paths of rural tourism are significantly different: the number of high-level scenic spots and the highway passenger carrying capacity in the scenic-dependent types; the number of national traditional villages, the number of A-level scenic spots and the highway passenger carrying capacity in the cultural heritage-based types; the regional tertiary industry output value, per capita disposable income, tourist arrivals, highway passenger traffic, urbanization rate, and government policies in the new agriculture, rural areas and farmers types. Rural tourism is not a universal road. The existence of resources determines different tourism development paths and requires the support of different hidden exogenous factors for sustainable development.
Green development is an important part of the concept of sustainable development of the tourism industry, which is the new value of people-oriented, ecological supremacy and comprehensive development of the tourism industry. Based on a thorough review of the concept of tourism green development, we construct an evaluation system of tourism green development efficiency by using SBM-Undersirable, the Coefficient of Variation, Kernel Density analysis and Spatial Markov Chain methods to depict a full picture of China's spatio-temporal patterns and impact mechanism of tourism green development efficiency (TGDE) from 2008 to 2018. Our results demonstrate that: (1) TGDE was generally below the average level, and temporally it shows a pattern of "W"-shaped fluctuated growth, with significant characteristics of "decline-rise-adjustment" stage. TGDE decreased from eastern to central and further to western region and the internal differences in the western region > eastern region > central region. In addition, the low, medium and high efficiency in various provinces had an obvious change from a "pyramid" to a "diamond" structure. Among them, the high efficiency areas are concentrated in the eastern coastal areas and the medium efficiency areas are mostly distributed in the central and western regions, while the low efficiency areas are located on both sides of Hu Huanyong Line. (2) TGDE has always been polarized but the regional coordination is gradually enhanced and it has strong stability, so it is difficult to achieve leapfrog development. In addition, provinces with TGDE spatial upward transfer are relatively concentrated, mainly in the central and western regions, and there are fewer provinces with downward adjustment. TGDE has obvious spatial spillover effect, that is to say, the high efficiency provinces release positive spillover effect, while low efficiency ones release negative spillover effect and the probability of upward transfer increases when they are adjacent to high efficiency types, and the spillover effect is asymmetric. (3) In terms of impact mechanism, it is found that there is a significant positive relationship between TGDE and economic level, industrial structure, technological innovation, government regulation, education level and tourism resource endowment through the panel data regression model and the impact of the degree of opening to the outside world is not significant, but there is high regionality in the impact degree of influence, mechanism of action and conditions of each factor.
The promotion of both tourism competitiveness and urbanization have positive effects on local economy. However, whether the coupling coordination of these two systems have a specific correlation with local economy still needs empirical demonstration. Taking the Guangzhou-Hong Kong-Macao Greater Bay Area (GBA) as an example, this study collects statistical data from 2007 to 2019 to build a tourism competitiveness-urbanization coupling coordination degree model (CCDM) and further adopt a panel model to identify the correlation between coupling coordination degree and local GDP. Finally, this study selected Guangzhou, Dongguan, Jiangmen and Macao to establish a VAR model for time-series research. The main conclusions are as follows: Firstly, the coupling coordination of the GBA showed volatile increases in the sample years, with different trends of each city. Secondly, there is a positive correlation and a long-term stable counteraction between economy and the coupling coordination. Thirdly, in Guangzhou, Dongguan, Jiangmen and Macao, local GDPs all have impulse response to the innovation of the coupling coordination, and the variance decomposition shows that the innovation of coupling coordination has a significant contribution to local economy, Guangzhou and Macao have an immediate positive response to innovation, while the response of Dongguan has lag effect, and Jiangmen has volatile impulse. In conclusion, the results of this research demonstrate the unique characteristics of each city in the study area and a general review of the coordination degree and its effect on local economy.
Based on the establishment of a theoretical model of the influence of neighborhood effect on farmers' biopesticide application behavior, this paper uses survey data of farmers in Hubei, Jiangxi and Zhejiang provinces to empirically test the impact of neighborhood effect on farmers' biopesticide application behavior. On this basis, the conditions and internal mechanism of neighbourhood effects for rice farmers to apply biological pesticides were further discussed. The results show that: first, 55.76% of the sample farmers have applied biological pesticides. The farmers who applied biological pesticides have a strong neighborhood relationship. Second, the neighborhood effect has a significant positive impact on farmers' biological pesticide application behavior. The average application amount of biological pesticides by farmers with strong neighborhood effects is significantly higher than that of farmers with weak neighborhood effects. Third, there are conditional restrictions on the influence of neighborhood effect on rice farmers' biological pesticide application behavior. For high-income farmers and large-scale households, the neighborhood effect is not significant. Fourth, the neighborhood effect has a significant direct effect on farmers' biological pesticide application behavior, and it also indirectly affects farmers' biological pesticide application behavior through two paths of reducing information search costs and effectively avoiding agricultural production risks.
Accurate identification of the coordination between industrial structure optimization and urban land use intensity has important theoretical value and practical significance for promoting the transformation and upgrading of industrial structure, coordinating land space planning and industrial layout, as well as achieving a new round of high-quality revitalization in Northeast China. This paper uses Theil index, Moore structure change index, entropy weight method plus the coupling coordination degree model and exploratory spatial data analysis method to explore the coupling coordination level and spatial correlation between industrial structure optimization and urban land use intensity in the study area from 2009 to 2018. The results show that: (1) The rationalization level of urban industrial structure is decreasing year by year, with a large regional gap, which is reflected in the high level of central cities and low level of surrounding cities. The upgrading level of industrial structure rose slightly, with no obvious spatial differentiation. (2) The level of urban land use intensity shows an inverted "U" shape, which first increases and then decreases, and finally decreases along the central cities of Harbin-Dalian Transportation Economic Belt. (3) The coordination degree of industrial structure rationalization and urban land use intensity first increased and then decreased. The coordination degree of industrial structure upgrading and urban land use intensity gradually increases with time. The two coordination dispatching centers of Dalian and Harbin present a spatial distribution of "multi-center and multi-circle pattern". (4) There is a positive spatial correlation between the industrial structure optimization and the coupling coordination degree of urban land use intensity, but the significance is weakening year by year. The H-H aggregation areas concentrated in the Central-south Liaoning urban agglomeration, while L-L aggregation areas concentrated in the Eastern Heilongjiang urban agglomeration. In order to improve the coordination of industrial structure optimization and urban land use intensity, based on the empirical results and the actual development, two policy suggestions are put forward in this paper. One is giving full play to the advantages of central cities such as Shenyang, Dalian, Changchun and Harbin, so as to drive the surrounding cities to realize the coordinated development of industrial structure optimization and urban land use intensity; the other is coordinating the allocation of industries according to local conditions and forming the connotation intensive industrial development trend on the basis of urban land intensive use.
Developing forestry carbon sequestration economy is an important measure to cope with global climate change and realize carbon neutrality in China by 2060. Based on the improved Faustmann-Hartman model, taking Cunninghamia lanceolata plantation in Zhejiang, Fujian and Jiangxi provinces in Southern China as research objects, this paper used the time series model to fit and predict the carbon price of China's carbon emission trading market, and used Monte Carlo simulation to determine the optimal rotation period and the net present price of the land expectation value. The results showed that: (1) The optimal rotation periods of Cunninghamia lanceolata plantation were 21.85 years, 22.98 years and 22.88 years respectively when timber revenue, aboveground biomass carbon sequestration revenue and dead organic carbon sequestration revenue were included in turn. (2) Under the above three scenarios, the net present values of the land expectation value were 20408.20 CNY/hm 2, 24587.29 CNY/hm2 and 28101.11 CNY/hm2, respectively. (3) Comprehensive consideration of forest carbon sequestration benefits including dead organic matter carbon pool can stably raise the income of forest owners by 7.02%-21.61%. In addition, it is necessary to further consider the impact of tax policy and natural risks on carbon sequestration under multiple rotation in the follow-up study of determining the optimal rotation period and carbon sequestration benefits.
Based on the expected utility function theory, this paper analyzed the willingness to pay for forest insurance and the difference of heterogeneous forest operators. Based on the survey data of 382 small forest farmers and 88 new forestry operators in Fujian province, the differences and influencing factors of willingness to pay of heterogeneous forestry operators were explored by using contingent valuation method (CVM) and Cox proportional hazards model. The results show that there are significant differences in the willingness to pay level of forest insurance between the traditional small forest farmers and the new forest operators, at four protection levels ranging from 1000-2500 yuan/mu, the pay willingness of the traditional small forest farmers is 1.911 yuan/mu, 2.941 yuan/mu, 3.532 yuan/mu and 3.979 yuan/mu, respectively, and that of the new forest operators is 1.632 yuan/mu, 3.971 yuan/mu, 5.809 yuan/mu and 6.864 yuan/mu, respectively. The willingness to pay of the two types of forest operators increased with the increase of the insured amount, but the increase of the new forest operators is much larger than that of the small forest farmers. Meanwhile, there are significant differences in the influencing factors of willingness to pay for forest insurance of heterogeneous forest operators, which is related to the obvious differences in the cognitive characteristics of forest insurance, the characteristics of forest production and management, the characteristics of forest damage, and the evaluation characteristics of forest insurance products. In addition, the area of forest land has a significant impact on the willingness to pay of the two types of forest operators, which indicates that large-scale and intensive forestry production and management could enhance the willingness to pay level of forest insurance.
It is of great significance to explore the spatial differentiation characteristics and formation mechanism of 20th-century architectural heritages for improving the protection level of the cultural heritages. Taking 396 architectural heritage sites of the 20th-century as the research objects, we studied their spatial differentiation and evolution characteristics by means of standard deviation ellipse, gravity center analysis, Voronoi diagram and other spatial analysis methods, and analyzed the formation mechanism of these architectural heritages by using geographic detector model. The results are shown as follows: (1) In terms of the overall differentiation pattern and evolution, the 20th-century architectural heritages are densely distributed. At the provincial level, the highly rich areas have "only one cluster", the moderately rich areas are "scattered in the east", and the slightly and non-rich areas exhibit a pattern of "two zones and two pieces". At the district level, the number difference of "cliff type", the grade difference of "gradient" and the spatial differentiation of "standing out from the crowd" are presented. The center of gravity shows a trend of "northward first, then south", while the movement from east to west is relatively slight. The degree of agglomeration shows a trend from strong to weak and the number of agglomeration points shows a trend of decline. (2) As for distribution pattern and evolution of the types, the 20th-century architectural heritages can be divided into 6 main categories and 16 subcategories, among which, the number of science, education, cultural, health, commercial and administrative offices, and memorial heritages are in the majority, showing the spatial distribution characteristics of "two cores dispersed", "three cores in the east, and scattered clusters in the middle" and "two cores, one loop and multiple points" respectively. Meanwhile, different types of architectural heritages have different distribution characteristics. (3) The spatial pattern of 20th-century architectural heritages is a result of multiple factors such as regional status, culture and education, social and economic development level and external relations, among which factors related with cultural richness in a long history have the greatest influence.
Continuous global warming will bring more extreme precipitation events. Summer precipitation in China has obvious chronological changes, which is closely related to El Niño-Southern Oscillation. Thus, based on the gridded dataset of monthly precipitation with a spatial resolution of 0.5°×0.5° during 1961-2019, this paper analyzes the spatio-temporal variation of summer precipitation in the nine major basins of China using the trend analysis, t-test, and synthetic analysis. Based on seven ENSO events, the summer precipitation patterns were discussed. Results are shown as follows. (1) The summer precipitation increased significantly (p<0.05) in inland river basins such as Hexi Corridor, areas north and south of the Tianshan Mountains, and areas west of the Qinghai-Tibet Plateau, Southeast River drainage basins and the middle and lower reaches of the Yangtze River, while precipitation in both Haihe River Basin and Songliao River Basin decreased significantly during the period 1961-2019. (2) From the 1960s to the late 1990s, the precipitation fluctuations in the Yangtze and Huaihe River Basins increased, while that in the Haihe River Basin continued to decline, which was in line with the spatial characteristics of "Southern Floods and Northern Droughts". After 2000, except in the Huaihe River, and the summer precipitation in other river basins showed an increasing trend. (3) In the events dominated by El Niño, the ridge line of the Western Pacific Subtropical High (WPSH) extended westward, and the summer precipitation areas were concentrated in the Jianghuai area, showing a spatial pattern of three-pole-type from south to north, with more precipitation in Jianghuai Basin and less precipitation in the north of China and the Pearl River Basin in summer. In the events dominated by La Nina, the ridge line of the WPSH moved eastward and the control area narrowed. The summer precipitation obviously decreased on both sides of the "Hu Huanyong Line" and in South China. As for the two conversion ENSO events, when El Niño occurs in winter and La Nina changes in summer, the WPSH extends westward and its area expands, and there is more summer precipitation in China. On the contrary, the WPSH moves eastward and its area shrinks, resulting in less summer precipitation. This study highlighted that the spatio-temporal differentiation of ENSO events in the previous winter and summer, and analyses the abnormal laws of summer precipitation in the nine major basins in China, which has an important theoretical and practical significance to taking effective measures in regional flood prevention.
By changing the underlying surface conditions, vegetation change can regulate the distribution ratio of vegetation transpiration to soil evaporation, and then change the regional and even global water cycle process, and have a profound impact on the sustainable development and utilization of water resources. Since the 1990s, China has carried out a large-scale vegetation restoration project, which has greatly increased the vegetation coverage, especially in the middle reaches of the Yellow River. In this paper, six typical vegetation restoration watersheds in the middle reaches of the Yellow River Basin as the research object, using meteorological and hydrological data, verify the performance of the PML_V2 model, and analyze in the vegetation restoration project background, from 2003 to 2018, the evapotranspiration in the middle reaches of the Yellow River (ET) and its components (Ec vegetation transpiration, Ei intercept evaporation, Es soil evaporation) change pattern of space and time. (1) By comparing the results of ET and PML models, it is found that this model has good applicability in the middle reaches of the Yellow River (NSE >0.6). (2) Ec plays a leading role in the distribution pattern of ET, which is controlled by the spatial distribution of vegetation under the action of summer monsoon. The spatial distribution pattern of Ec and ET is similar, while that of Es is opposite. ET, Ec, Ei all showed a significant increasing trend, while Es showed a significant decreasing trend, especially in the middle and lower reaches of the basin. (3) In the context of vegetation restoration, ET and its components in the typical watershed of the middle reaches of the Yellow River change significantly. Compared with their located watersheds, ET, Ec, Es and Ei are 2.20%, 5.86%, 0.86% and 7.44% higher, respectively, and the rates are -0.51 mm/a, 0.55 mm/a, -1.11 mm/a and 0.05 mm/a higher, respectively.