

社会是一个复杂系统,资源、生态、经济、社会等不同系统之间存在多元内在耦合关系。随着对科学发展观认识的深入,对一个地区或社会发展程度的评判已经从单纯的发展水平转向基于协调水平与发展水平的整体均衡发展评价。因此,耦合效应与耦合协调发展度已经成为有效的评价研究工具。对于耦合效应研究,国内目前普通使用的有环境库兹涅茨曲线[1,2,3]、双指数模型[4]、非线性动力学模型[5,6,7,8]、耦合度模型[9,10,11,12]、灰色关联度分析[13,14,15]、动态耦合模型[16]、向量自回归模型[17]、空间回归模型[18]、ArcGIS重心曲线优化分级[19]等。其中耦合协调度模型使用耦合度阐释若干子系统之间的相互关系,并进一步使用协调发展度对整个系统进行综合评价与研究。因为该模型简便易算且结果直观,因此被广泛应用于不同尺度、不同区域的环境[20,21,22]、经济[23,24,25]、社会发展[26]、城市化[27,28,29]、农业[30]、工业[31]、交通[32]、人口[33,34]等诸多系统间耦合发展水平的实证研究中。
但在目前研究中出现了大量对该模型的使用误区,并没有引起重视,导致诸多论文因模型本身使用误区而产生错误的结论。此外,模型本身也存在实证研究中的适用性和局限性问题。本文试图在探讨该模型的使用规范、效度与信度的基础上,对传统耦合协调度模型进行修正,并以京津冀生态与经济系统为例验证修正模型的有效性。
1 国内耦合协调度模型使用误区
通过对截至2018年12月31日在国内CSSCI和CSCD期刊所发表的使用耦合协调度模型的论文进行逐一确认,发现存在较高比例的模型错误使用现象。如图1所示,随着耦合协调度模型在研究中的广泛使用,错误使用该模型的论文数量也呈现递增趋势。自2010年该模型广泛使用以来,共发表了683篇CSSCI和CSCD论文,各年度错误使用比例皆超过40%,于2017年达到顶峰(76篇,52.78%)。非核心期刊论文的使用错误比例则更高。资源环境、地理科学和经济管理各研究领域都存在对该模型的使用错误。因此有必要及时对该模型进行规范,避免更多学者因为引用不规范公式而继续产生错误的研究结果。
图1
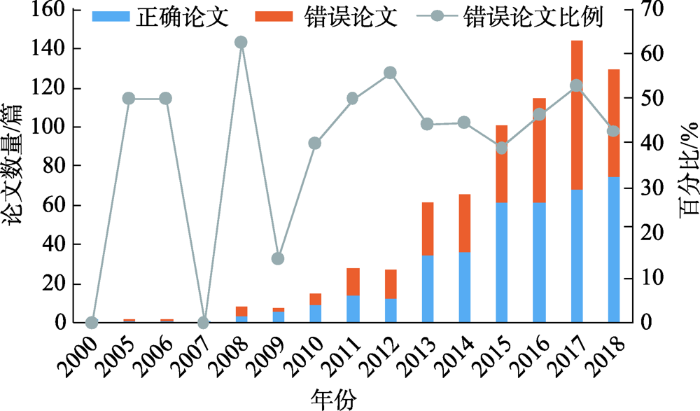
图1
国内CSSCI和CSCD期刊中耦合协调度模型论文发表及模型使用错误情况
Fig. 1
Statistical graph of publications and misuses of coupling coordination model in CSSCI and CSCD periodicals in China
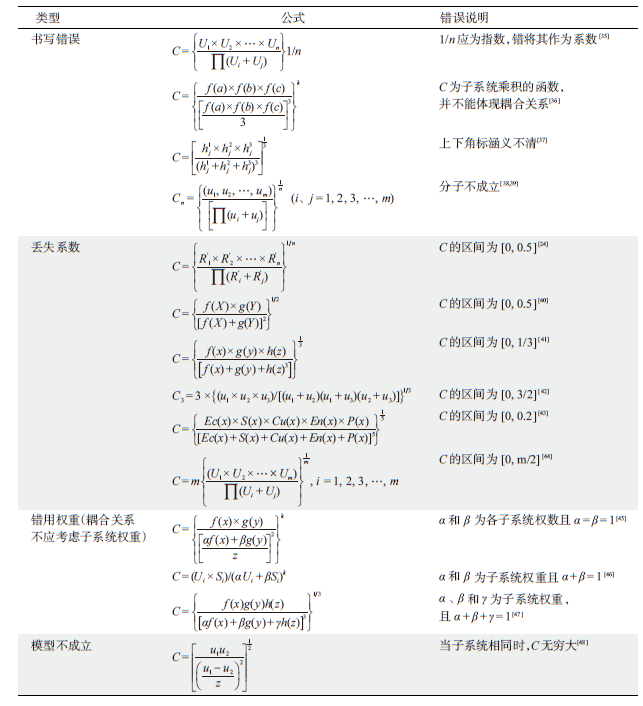
耦合度C是耦合协调度模型的核心部分,结果应落在 [0, 1],以表示系统间耦合关系的强弱。对模型的错误引用或使用主要来自于耦合度C的公式使用错误,导致C结果区间并不是 [0, 1],从而使后续耦合协调度结果与解释都出现系列错误。主要错误类型见表1。
表1 国内CSSCI和CSCD期刊中耦合协调度模型使用错误举例
Table 1
 |
1)F值;2)t值;3)未去断出。
2 传统耦合协调度模型的规范公式
式中:n为子系统个数(个);Ui为各子系统值,其分布区间为 [0, 1],故耦合度C值区间为 [0, 1]。C值越大,子系统间离散程度越小,耦合度越高;反之,子系统间耦合度越低。
当n=2时,
当n=3时,
当n=4时,
以上公式对于耦合度C值的计算最为简易,即使到高阶也比较易于操作和计算。
3 耦合协调度模型的效度及修正
3.1 耦合度的函数分布
对耦合度C值的解释有赖于C值的区间分布。对于式(1)中的C值,本文在此仅考察n=2和n=3两种最常见的情况下C值的分布情况。
当n=2时,为二元系统的耦合度C值,可以将式(1)简化为:
式中:
图2
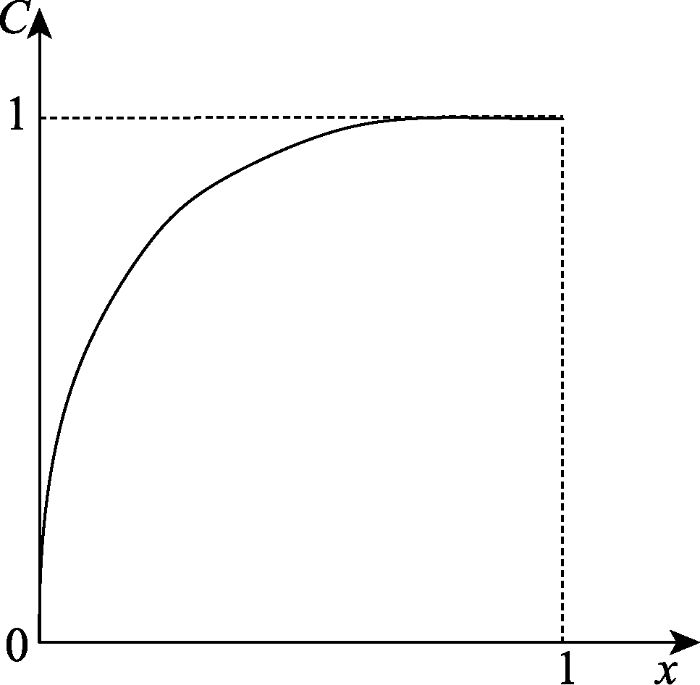
图2
二元系统耦合度C值的函数图
Fig. 2
Functional diagram of C-value of coupling degree of binary system
当n=3时,为三元系统的耦合度C值。为更好地呈现C值所代表的耦合或拮抗程度,将三元系统的C值模型简化为二元函数以呈现其函数图。三元系统下式(1)可简化为:
式中:
图3
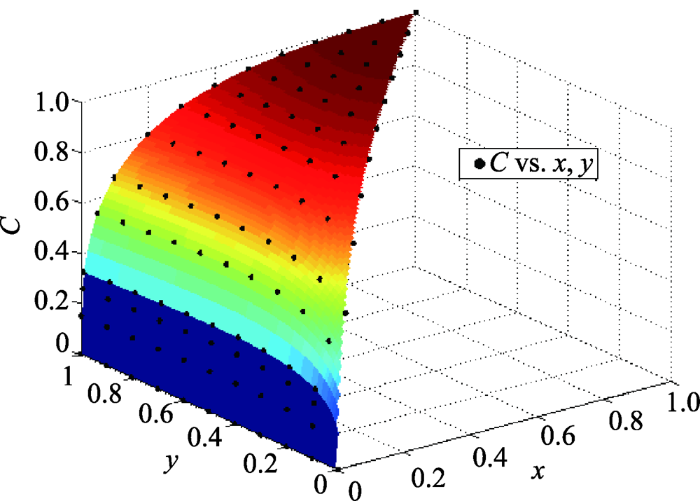
图3
三元系统耦合度C值的函数图
Fig. 3
Functional diagram of C-value of coupling degree of ternary system
由二元系统耦合度和三元系统耦合度的函数图可知,C值在 [0, 1] 区间中的分布概率并不均等,大概率偏向于1一端。
3.2 耦合度的使用效度
国内研究对耦合度C值解释的基本假设是:(1)C值区间为 [0, 1];(2)C值在区间 [0, 1] 平均分布。故推论认为:当C值在 [0, 1/2) 时为拮抗,[1/2, 1] 时耦合,数值大小代表拮抗或耦合程度。有学者进一步将C值划分为四个区间:(0, 0.3] 为低水平耦合,(0.3, 0.5] 为拮抗阶段,(0.5, 0.8] 为磨合阶段,(0.8, 1] 为高水平耦合[51];也有学者增加了C=0(子系统间处于无关状态且向无序发展)和C=1.0(子系统间达到良性共振耦合且趋向新的有序结构)[27]。较多研究者采用了廖重斌[52]所界定的协调等级的划分标准,并推演出协调发展度D的划分标准(表2)。
表2 协调等级及协调发展度的划分标准
Table 2
| 区间 | [0, 0.1) | [0.1, 0.2) | [0.2, 0.3) | [0.3, 0.4) | [0.4, 0.5) | [0.5, 0.6) | [0.6, 0.7) | [0.7, 0.8) | [0.8, 0.9) | [0.9, 1] |
|---|---|---|---|---|---|---|---|---|---|---|
| C耦合 协调度 | 极度 失调 | 严重 失调 | 中度 失调 | 轻度 失调 | 濒临 失调 | 勉强 协调 | 初级 协调 | 中级 协调 | 良好 协调 | 优质 协调 |
| D协调 发展度 | 极度 失调 衰退类 | 严重 失调 衰退类 | 中度 失调 衰退类 | 轻度 失调 衰退类 | 濒临 失调 衰退类 | 勉强 协调 发展类 | 初级 协调 发展类 | 中级 协调 发展类 | 良好 协调 发展类 | 优质 协调 发展类 |
| 颜色 | ||||||||||
| 大类 | 失调衰退类 | 过渡发展类 | 协调发展类 | |||||||
目前这一解释存在两个问题。
第一,C值的效度问题。部分论文基于表1中所讨论的模型使用不规范问题,导致其C值区间为 [0, 1/2] 或 [0, 1/3],但仍使用了表2的解释标准是不恰当的。即使模型使用正确,但基于耦合度C值区间分布的探讨,可知将非平均分布的C值以平均分布来划分和解释欠合理。特别是社会科学领域很少出现系统间大比例差值,已有研究中C值集中分布于0.7以上(表3)。因而,现有解释惯例使得耦合度C值的效度降低。
表3 国内耦合协调度模型应用研究中耦合度C值结果举例
Table 3
| 研究区域 | 研究对象 | C值个数 /个 | C值分布 | 说明 |
|---|---|---|---|---|
| 全国[53] | 建筑业/区域经济增长 | 31 | [0.9139, 1.000] | 4个省C值为1 |
| 全国[54] | 区域开发强度/资源环境 | 15 | [0.9903, 1.000] | 2个年份C值为1 |
| 全国[55] | 城乡经济/基本公共服务 | 58 | [0.9607, 1.000] | 6个年份/省份C值为1 |
| 江苏省[56] | 经济/文化 | 11 | [0.93, 1.00] | 7个年份C值为1 |
| 陕西省[57] | 农业生态环境/经济发展 | 10 | [0.782, 0.999] | 6个年份C值>0.95 |
| 南疆铁路沿线[58] | 经济/社会/资源/环境 | 14 | [0.7155, 0.9976] | 7个年份C值>0.9 |
| 桂西地区[11] | 地质遗迹/民族文化资源 | 24 | [0.84, 1.00] | 2个年份C值为1,20个年份C值>0.9 |
| 兰州市[59] | 环境/经济 | 10 | [0.9009, 0.9997] | 10个年份C值全>0.9 |
| 南京市[60] | 土地利用 | 13 | [0.86, 1.00] | 其中4个区域C值为1 |
第二,基于式(1)计算的协调发展度模型会被简化。一方面因为C值集中分布在1一端,因而计算出来的D值主要依赖于T值,即系统本身的发展程度,而系统协调水平的作用被弱化,导致D值难以充分实现耦合协调度本身测度的价值与意义。另一方面,在计算协调发展度时,如果界定子系统同等重要,会出现协调发展度公式被简化问题。T应该采用算数加权而非几何加权计算,因为采用几何加权计算会降低T值范围,同时综合评价指数应当体现各子系统间的互补关系[49]。故综合评价指数为:
式中:
因此,协调发展度D的计算公式为:
大部分研究中,都假设各子系统的重要性一致,因此为
由此可知,当使用这一模型进行协调发展度计算时,如果设定各子系统的重要性及权重一致,将会把协调发展度D简化为各子系统乘积的开2n次方,从而降低了该模型的使用效度。
3.3 耦合度模型修正
为解决上述问题,本文试图对耦合协调度模型进行修正,并提出两种方案供未来研究者进一步讨论。
第一种修正方案:使用传统耦合协调度模型式(1),但需要重新界定C的解释惯例。式(1)中C可通过约分简化为各个子系统间比值的函数,因此可使用各子系统比值计算耦合度C的边界,而不受子系统值本身影响(表4)。例如当两个子系统测算耦合度时,如果认为两个子系统比值在2以下可接受,则计算可得 [0, 0.9428) 为拮抗,[0.9428, 1] 为协调。而当子系统数量增加为3个时,当最大系统是最小系统的2倍可接受时,则计算可得 [0, 0.9449) 为拮抗,[0.9449, 1] 为协调。这一修正方案可使研究者根据研究对象特性及预期来界定更为实用和清晰的耦合度边界,但存在以下问题:第一,增加了对于边界合理性的论证难度;第二,对于三个子系统尚可勉强界定边界,但对于多个子系统耦合度边界的界定十分复杂;第三,耦合关系不仅与比值有关,还应与差值有关。如使用式(1)计算二元系统C(0.1, 0.2)=C(0.4, 0.8)=0.9428,但显然C(0.1, 0.2) 应高于C(0.4, 0.8) 才符合实际的耦合关系。因此,仅对传统耦合协调度模型的结果解释进行修正,虽然一定程度上实现了优化,但难以达到最优效度。
表4 二元系统和三元系统中耦合度C值的分界点
Table 4
| 二元系统 | 三元系统 | ||||
|---|---|---|---|---|---|
| 比值 (大/小) | 分界点 C值 | 比值 (大/小) | 比值 (中/小) | 分界点 C值 | |
| 1 | 1.0000 | 1 | 1 | 1.0000 | |
| 2 | 0.9428 | 2 | 2 | 0.9524 | |
| 3 | 0.8660 | 2 | 1 | 0.9449 | |
| 4 | 0.8000 | 3 | 2 | 0.9086 | |
| 5 | 0.7454 | 3 | 3 | 0.8915 | |
| 6 | 0.6999 | 3 | 1 | 0.8654 | |
| 7 | 0.6614 | 4 | 3 | 0.8585 | |
| 8 | 0.6285 | 4 | 2 | 0.8571 | |
| 9 | 0.6000 | 4 | 4 | 0.8399 | |
| 10 | 0.5750 | 4 | 1 | 0.7937 | |
鉴于此,本文提出第二种修正方案:直接对传统耦合度模型进行修正。因为传统耦合度C不是在 [0, 1] 之间平均分布函数,所以效度问题源自于模型本身。对于模型的修正如下:
式中:
当n=2时,假定
当n=3时,假定
当n=4时,假定
表5 修正后模型的二元系统耦合度模拟值
Table 5
| U1 | U2 | C | U1 | U2 | C | U1 | U2 | C | U1 | U2 | C | U1 | U2 | C |
|---|---|---|---|---|---|---|---|---|---|---|---|---|---|---|
| 0.0 | 0.1 | 0.000 | 0.4 | 0.4 | 1.000 | 0.6 | 0.6 | 1.000 | 0.4 | 0.8 | 0.548 | 0.8 | 0.9 | 0.894 |
| 0.1 | 0.1 | 1.000 | 0.0 | 0.5 | 0.000 | 0.0 | 0.7 | 0.000 | 0.5 | 0.8 | 0.661 | 0.9 | 0.9 | 1.000 |
| 0.0 | 0.2 | 0.000 | 0.1 | 0.5 | 0.346 | 0.1 | 0.7 | 0.239 | 0.6 | 0.8 | 0.775 | 0.0 | 1.0 | 0.000 |
| 0.1 | 0.2 | 0.671 | 0.2 | 0.5 | 0.529 | 0.2 | 0.7 | 0.378 | 0.7 | 0.8 | 0.887 | 0.1 | 1.0 | 0.100 |
| 0.2 | 0.2 | 1.000 | 0.3 | 0.5 | 0.693 | 0.3 | 0.7 | 0.507 | 0.8 | 0.8 | 1.000 | 0.2 | 1.0 | 0.200 |
| 0.0 | 0.3 | 0.000 | 0.4 | 0.5 | 0.849 | 0.4 | 0.7 | 0.632 | 0.0 | 0.9 | 0.000 | 0.3 | 1.0 | 0.300 |
| 0.1 | 0.3 | 0.516 | 0.5 | 0.5 | 1.000 | 0.5 | 0.7 | 0.756 | 0.1 | 0.9 | 0.149 | 0.4 | 1.0 | 0.400 |
| 0.2 | 0.3 | 0.775 | 0.0 | 0.6 | 0.000 | 0.6 | 0.7 | 0.878 | 0.2 | 0.9 | 0.258 | 0.5 | 1.0 | 0.500 |
| 0.3 | 0.3 | 1.000 | 0.1 | 0.6 | 0.289 | 0.7 | 0.7 | 1.000 | 0.3 | 0.9 | 0.365 | 0.6 | 1.0 | 0.600 |
| 0.0 | 0.4 | 0.000 | 0.2 | 0.6 | 0.447 | 0.0 | 0.8 | 0.000 | 0.4 | 0.9 | 0.471 | 0.7 | 1.0 | 0.700 |
| 0.1 | 0.4 | 0.418 | 0.3 | 0.6 | 0.592 | 0.1 | 0.8 | 0.194 | 0.5 | 0.9 | 0.577 | 0.8 | 1.0 | 0.800 |
| 0.2 | 0.4 | 0.632 | 0.4 | 0.6 | 0.730 | 0.2 | 0.8 | 0.316 | 0.6 | 0.9 | 0.683 | 0.9 | 1.0 | 0.900 |
| 0.3 | 0.4 | 0.822 | 0.5 | 0.6 | 0.866 | 0.3 | 0.8 | 0.433 | 0.7 | 0.9 | 0.789 | 1.0 | 1.0 | 1.000 |
表6 修正后模型的三元系统耦合度模拟值
Table 6
| U1 | U2 | U3 | C | U1 | U2 | U3 | C | U1 | U2 | U3 | C | U1 | U2 | U3 | C |
|---|---|---|---|---|---|---|---|---|---|---|---|---|---|---|---|
| 0.2 | 0.2 | 0.2 | 1.000 | 0.6 | 0.6 | 0.6 | 1.000 | 0.6 | 0.8 | 0.8 | 0.866 | 0.4 | 0.8 | 1.0 | 0.583 |
| 0.2 | 0.2 | 0.4 | 0.658 | 0.2 | 0.2 | 0.8 | 0.387 | 0.8 | 0.8 | 0.8 | 1.000 | 0.6 | 0.8 | 1.0 | 0.713 |
| 0.2 | 0.4 | 0.4 | 0.783 | 0.2 | 0.4 | 0.8 | 0.461 | 0.2 | 0.2 | 1.0 | 0.306 | 0.8 | 0.8 | 1.0 | 0.833 |
| 0.4 | 0.4 | 0.4 | 1.000 | 0.4 | 0.4 | 0.8 | 0.606 | 0.2 | 0.4 | 1.0 | 0.363 | 0.2 | 1.0 | 1.0 | 0.457 |
| 0.2 | 0.2 | 0.6 | 0.494 | 0.2 | 0.6 | 0.8 | 0.510 | 0.4 | 0.4 | 1.0 | 0.490 | 0.4 | 1.0 | 1.0 | 0.616 |
| 0.2 | 0.4 | 0.6 | 0.588 | 0.4 | 0.6 | 0.8 | 0.670 | 0.2 | 0.6 | 1.0 | 0.402 | 0.6 | 1.0 | 1.0 | 0.754 |
| 0.4 | 0.4 | 0.6 | 0.760 | 0.6 | 0.6 | 0.8 | 0.806 | 0.4 | 0.6 | 1.0 | 0.542 | 0.8 | 1.0 | 1.0 | 0.880 |
| 0.2 | 0.6 | 0.6 | 0.651 | 0.2 | 0.8 | 0.8 | 0.548 | 0.6 | 0.6 | 1.0 | 0.663 | 1.0 | 1.0 | 1.0 | 1.000 |
| 0.4 | 0.6 | 0.6 | 0.841 | 0.4 | 0.8 | 0.8 | 0.720 | 0.2 | 0.8 | 1.0 | 0.432 | — | — | — | — |
4 耦合协调度模型的信度
即使进行上述修正后,耦合协调度模型还存在一些潜在的信度问题尚未解决。
4.1 指标构建的主观性
目前耦合度研究中,各子系统的标准化值高度依赖于研究者所构建的各子系统的指标体系。研究者一般参照以往论文中所使用的指标体系,依据研究对象与地域特征,同时考虑数据的可获得性,构建不同的要素层和指标体系。因而指标体系的构建具有较强的主观性,同一个子系统在不同研究中二级指标差异较大。因此,指标构建的主观性进一步影响到最终耦合结果的可靠性。
4.2 耦合结果的波动性
为使不同指标在跨地区和年份之间具有可比性以及消除原始数据间量级、方向差异,耦合协调度模型首先要对各指标的原始数据根据下述公式进行极差标准化处理。
式中:
4.3 耦合结果的无可比性
由于指标构建的主观性,不同研究者之间的研究结果难以进行横向比较。更为关键的是耦合结果的波动性导致每一个测算出来的耦合度C及协调发展度D都只是在当前年份与地区范围内的相对值,而非绝对值。因此,相对耦合度与相对协调发展度在年份与地区外就不具有可比性,即使同一个研究者使用相同数据,但扩充年份与地区后也不具有纵向与横向的可比性。因此,使用耦合度模型进行的研究,仅具有当下的良好使用效度,无可比性制约了该模型的实用价值。
5 耦合协调度模型实证:以京津冀生态—经济耦合协调发展为例
本文通过分析京津冀地区13市2008—2017年间生态环境与经济发展系统的耦合关系与协调发展度水平,验证新模型的效度,进一步探讨耦合协调度模型的信度问题。
5.1 指标体系及数据来源
生态环境与经济发展是两个相互耦合的复杂系统。以京津冀生态—经济耦合协调发展为例,遵循科学性、可操作性和可持续性原则,运用频度统计法、理论分析法和专家咨询法确定指标体系并调整。具体步骤为:(1)统计、筛选指标。选取近十年国内CSSCI、CSCD来源期刊发表的有关生态环境、经济发展为主题的高被引论文各50篇,统计并筛选使用频度较高的指标。(2)分析、剔除指标。生态环境子系统指标方面,依据中国科学院《中国可持续发展战略报告》等[61,62,63,64]划分为生态环境要素、生态环境压力和生态环境保护三个要素层,包括森林覆盖率等10个指标。经济发展子系统则结合当前中国经济发展重点,依据相关文献[65,66,67,68]构建包含经济规模、经济潜力和经济质量三个要素层,共有GDP等12个指标。(3)专家反馈调整指标。根据专家反馈意见,如专家提出生态环境指标方面需增加全年优良天数指标以便更能真实反映京津冀地域特征和实际情况等,最终构建京津冀生态环境—经济发展综合评价指标体系(表7)。量化数据来源于《中国城市统计年鉴》(2009—2018年)、13个城市的国民经济和社会发展统计公报(2008— 2017年)以及政府工作报告(2008—2017年)。为消除主观因素对评价结果的影响,采用对指标数据本身客观信息进行提取分析的熵权法[69]确定指标权重。
表7 京津冀生态环境—经济协调发展评价指标体系
Table 7
| 子系统 | 要素层 | 指标层 | 属性 | 子系统 | 要素层 | 指标层 | 属性 |
|---|---|---|---|---|---|---|---|
| 生态 环境 系统 | 生态 环境 要素 | 森林覆盖率 | + | 经济 发展 系统 | 经济 规模 | GDP | + |
| 人均水资源量 | + | 固定资产投资额 | + | ||||
| 全年优良天数 | + | 工业总产值 | + | ||||
| 生态 环境 压力 | 人均供水量 | - | 社会消费品零售总额 | + | |||
| 人均工业废水排放量 | - | 经济 潜力 | GDP增长率 | + | |||
| 人均工业二氧化硫排放量 | - | 第三产业占GDP比例 | + | ||||
| 人均工业烟(粉)尘排放量 | - | 固定资产投资增长率 | + | ||||
| 生态 环境 保护 | 环境质量指数 | + | 社会消费品零售总额增长率 | + | |||
| 人均公园绿地面积 | + | 经济 质量 | 人均GDP | + | |||
| 建成区绿化覆盖率 | + | 人均可支配收入 | + | ||||
| 人均储蓄存款年底余额 | + | ||||||
| 失业率 | - |
注:环境质量指数=(工业固体废物综合利用率×污水集中处理率×生活垃圾无害化处理率)1/3。
5.2 修正前后模型的效度对比
如表8所示,当以原模型式(1)计算京津冀13市生态—经济耦合度C时,2008—2017年13市C值分布于 [0.6101, 1.0000],即全部为协调关系。130个C值中有84个都大于0.8,并不能有效区分协调关系。当使用新模型即式(10)再次计算,C值分布于 [0.2532, 0.9949],出现显著的拮抗与耦合程度的区分。如表9所示,使用新模型计算京津冀13市生态—经济协调发展度D,D值从 [0.3402, 0.7524] 变为 [0.2453, 0.6498],区分效度显著且更为符合京津冀生态—经济协调发展的实际情况。因此,京津冀地区的模型验证结果表明,新模型在区分度与效度上优于原模型。
表8 原模型与修正后模型计算京津冀13市生态—经济耦合协调度C值
Table 8
| 年份/C值 | 北京 | 天津 | 石家庄 | 唐山 | 秦皇岛 | 邯郸 | 邢台 | 保定 | 张家口 | 承德 | 沧州 | 廊坊 | 衡水 | |
|---|---|---|---|---|---|---|---|---|---|---|---|---|---|---|
| 2008 | 原 | 0.9989 | 0.9935 | 0.8868 | 0.9073 | 0.6821 | 0.8328 | 0.6816 | 0.7789 | 0.6871 | 0.6101 | 0.8017 | 0.7867 | 0.7191 |
| 新 | 0.9404 | 0.8660 | 0.5440 | 0.5769 | 0.3006 | 0.4780 | 0.3344 | 0.4171 | 0.3278 | 0.2700 | 0.4374 | 0.4196 | 0.3738 | |
| 2009 | 原 | 0.9984 | 0.9997 | 0.8912 | 0.9079 | 0.6790 | 0.8114 | 0.6839 | 0.7786 | 0.7180 | 0.6377 | 0.8018 | 0.7587 | 0.7396 |
| 新 | 0.9238 | 0.9675 | 0.5435 | 0.5716 | 0.2946 | 0.4445 | 0.3224 | 0.4117 | 0.3533 | 0.2731 | 0.4352 | 0.3821 | 0.3906 | |
| 2010 | 原 | 0.9999 | 0.9920 | 0.9071 | 0.9224 | 0.6957 | 0.8309 | 0.7044 | 0.7992 | 0.7556 | 0.6212 | 0.8277 | 0.7707 | 0.7109 |
| 新 | 0.9835 | 0.8497 | 0.5659 | 0.5942 | 0.3041 | 0.4593 | 0.3385 | 0.4245 | 0.3857 | 0.2533 | 0.4574 | 0.3908 | 0.3529 | |
| 2011 | 原 | 0.9939 | 0.9848 | 0.9373 | 0.9468 | 0.7446 | 0.8488 | 0.7437 | 0.8114 | 0.7806 | 0.6469 | 0.8601 | 0.8162 | 0.7560 |
| 新 | 0.8485 | 0.7896 | 0.6271 | 0.6503 | 0.3454 | 0.4767 | 0.3720 | 0.4332 | 0.4123 | 0.2600 | 0.4994 | 0.4361 | 0.3951 | |
| 2012 | 原 | 0.9992 | 0.9913 | 1.0000 | 0.9276 | 0.6720 | 0.8527 | 0.7674 | 0.8211 | 0.7859 | 0.6561 | 0.8749 | 0.8133 | 0.7577 |
| 新 | 0.9445 | 0.8342 | 0.9949 | 0.5937 | 0.2497 | 0.4816 | 0.3967 | 0.4433 | 0.4134 | 0.2615 | 0.5164 | 0.4243 | 0.3931 | |
| 2013 | 原 | 0.9858 | 0.9280 | 0.9867 | 0.9866 | 0.7442 | 0.9215 | 0.8259 | 0.8680 | 0.7819 | 0.6619 | 0.9183 | 0.9025 | 0.7773 |
| 新 | 0.7757 | 0.5868 | 0.8169 | 0.8135 | 0.3519 | 0.6125 | 0.4721 | 0.5160 | 0.4043 | 0.2746 | 0.6006 | 0.5692 | 0.4184 | |
| 2014 | 原 | 0.9942 | 0.9488 | 0.9834 | 0.9815 | 0.6713 | 0.8995 | 0.8283 | 0.8917 | 0.7556 | 0.6955 | 0.9270 | 0.9064 | 0.8257 |
| 新 | 0.8523 | 0.6353 | 0.7939 | 0.7829 | 0.2532 | 0.5627 | 0.4708 | 0.5540 | 0.3797 | 0.3067 | 0.6191 | 0.5750 | 0.4723 | |
| 2015 | 原 | 0.9854 | 0.9367 | 0.9873 | 0.9836 | 0.7994 | 0.9146 | 0.8719 | 0.9160 | 0.7731 | 0.6982 | 0.9156 | 0.9176 | 0.8183 |
| 新 | 0.7682 | 0.5963 | 0.8137 | 0.7917 | 0.4115 | 0.5861 | 0.5281 | 0.5961 | 0.3889 | 0.3019 | 0.5833 | 0.5873 | 0.4547 | |
| 2016 | 原 | 0.9886 | 0.9490 | 0.9781 | 0.9867 | 0.7982 | 0.9274 | 0.8444 | 0.9292 | 0.7908 | 0.6964 | 0.9424 | 0.9175 | 0.8714 |
| 新 | 0.7870 | 0.6257 | 0.7564 | 0.8085 | 0.3862 | 0.6110 | 0.4765 | 0.6189 | 0.4065 | 0.2861 | 0.6457 | 0.5805 | 0.5280 | |
| 2017 | 原 | 0.9685 | 0.9876 | 0.9664 | 0.9589 | 0.8336 | 0.9242 | 0.8532 | 0.8893 | 0.8293 | 0.7264 | 0.9375 | 0.9241 | 0.8514 |
| 新 | 0.6527 | 0.8079 | 0.7122 | 0.6842 | 0.4381 | 0.6124 | 0.4857 | 0.5479 | 0.4504 | 0.3052 | 0.6292 | 0.5920 | 0.4896 | |
注:表中颜色对应的协调度等级参照
表9 原模型与修正后模型计算京津冀13市生态—经济协调发展度D值
Table 9
| 年份/D值 | 北京 | 天津 | 石家庄 | 唐山 | 秦皇岛 | 邯郸 | 邢台 | 保定 | 张家口 | 承德 | 沧州 | 廊坊 | 衡水 | |
|---|---|---|---|---|---|---|---|---|---|---|---|---|---|---|
| 2008 | 原 | 0.5736 | 0.4999 | 0.4328 | 0.4457 | 0.4415 | 0.3926 | 0.3598 | 0.3867 | 0.3899 | 0.3779 | 0.4013 | 0.4038 | 0.3402 |
| 新 | 0.5565 | 0.4667 | 0.3390 | 0.3554 | 0.2931 | 0.2974 | 0.2520 | 0.2830 | 0.2693 | 0.2514 | 0.2964 | 0.2949 | 0.2453 | |
| 2009 | 原 | 0.6145 | 0.5039 | 0.4588 | 0.4676 | 0.4480 | 0.4136 | 0.3964 | 0.4013 | 0.3956 | 0.4195 | 0.4078 | 0.4237 | 0.3474 |
| 新 | 0.5911 | 0.4957 | 0.3583 | 0.3711 | 0.2951 | 0.3061 | 0.2722 | 0.2918 | 0.2775 | 0.2746 | 0.3004 | 0.3007 | 0.2524 | |
| 2010 | 原 | 0.6390 | 0.5257 | 0.4806 | 0.4920 | 0.4593 | 0.4402 | 0.4014 | 0.4291 | 0.4063 | 0.4322 | 0.4340 | 0.4335 | 0.3798 |
| 新 | 0.6337 | 0.4865 | 0.3796 | 0.3949 | 0.3037 | 0.3273 | 0.2783 | 0.3127 | 0.2903 | 0.2759 | 0.3226 | 0.3087 | 0.2676 | |
| 2011 | 原 | 0.6761 | 0.5681 | 0.5003 | 0.5088 | 0.4734 | 0.4591 | 0.4109 | 0.4443 | 0.4052 | 0.4597 | 0.4415 | 0.4520 | 0.3817 |
| 新 | 0.6247 | 0.5087 | 0.4092 | 0.4216 | 0.3224 | 0.3441 | 0.2906 | 0.3246 | 0.2945 | 0.2914 | 0.3364 | 0.3304 | 0.2759 | |
| 2012 | 原 | 0.6727 | 0.5914 | 0.5818 | 0.5309 | 0.5138 | 0.4614 | 0.4096 | 0.4494 | 0.4183 | 0.4713 | 0.4580 | 0.4723 | 0.3923 |
| 新 | 0.6540 | 0.5425 | 0.5803 | 0.4247 | 0.3132 | 0.3468 | 0.2945 | 0.3302 | 0.3033 | 0.2975 | 0.3519 | 0.3411 | 0.2826 | |
| 2013 | 原 | 0.6747 | 0.5540 | 0.4727 | 0.4929 | 0.4590 | 0.4196 | 0.3839 | 0.4269 | 0.4304 | 0.4571 | 0.4396 | 0.4413 | 0.3777 |
| 新 | 0.5985 | 0.4406 | 0.4301 | 0.4476 | 0.3156 | 0.3421 | 0.2902 | 0.3292 | 0.3095 | 0.2944 | 0.3555 | 0.3505 | 0.2771 | |
| 2014 | 原 | 0.6784 | 0.5791 | 0.4944 | 0.4985 | 0.5074 | 0.4445 | 0.3973 | 0.4274 | 0.4216 | 0.4539 | 0.4399 | 0.4465 | 0.3820 |
| 新 | 0.6281 | 0.4739 | 0.4442 | 0.4453 | 0.3116 | 0.3515 | 0.2995 | 0.3369 | 0.2989 | 0.3014 | 0.3595 | 0.3556 | 0.2889 | |
| 2015 | 原 | 0.6983 | 0.5914 | 0.5201 | 0.5149 | 0.4621 | 0.4639 | 0.4067 | 0.4387 | 0.4444 | 0.4682 | 0.4800 | 0.4805 | 0.4083 |
| 新 | 0.6165 | 0.4718 | 0.4722 | 0.4620 | 0.3315 | 0.3713 | 0.3165 | 0.3539 | 0.3152 | 0.3079 | 0.3831 | 0.3844 | 0.3044 | |
| 2016 | 原 | 0.7283 | 0.6111 | 0.5472 | 0.5302 | 0.5140 | 0.4725 | 0.4428 | 0.4591 | 0.4498 | 0.4936 | 0.4801 | 0.5010 | 0.4044 |
| 新 | 0.6498 | 0.4962 | 0.4812 | 0.4800 | 0.3575 | 0.3835 | 0.3327 | 0.3747 | 0.3225 | 0.3163 | 0.3974 | 0.3986 | 0.3148 | |
| 2017 | 原 | 0.7524 | 0.5727 | 0.5155 | 0.5220 | 0.5022 | 0.4419 | 0.4522 | 0.4342 | 0.4582 | 0.5128 | 0.4945 | 0.5110 | 0.4333 |
| 新 | 0.6177 | 0.5179 | 0.4426 | 0.4409 | 0.3641 | 0.3597 | 0.3411 | 0.3408 | 0.3377 | 0.3324 | 0.4051 | 0.4090 | 0.3286 | |
注:表中颜色对应的协调发展度等级参照
5.3 研究对象变化对模型信度的影响
如表10所示,当仅以河北省11市2008—2017年进行标准化后计算生态—经济系统的耦合协调度C时,C值分布于 [0.3867,0.9978],95个C值为耦合关系,15个C值为拮抗关系。当以京津冀13市2008—2017年数据进行标准化后计算生态—经济系统的耦合协调度C时,河北省11市的C值发生了显著变化:43个C值为耦合关系,67个C值变为拮抗关系。当变更研究区域后,河北省11市的生态—经济耦合关系C的变化幅度为 [0.0301, 0.4045],其中石家庄市2008年的耦合关系从优质协调(0.9485)变为勉强协调(0.5440)。如表11所示,河北省11市的协调发展度D也出现显著变化。因此,当研究区域发生扩大或缩小,会导致研究区域的耦合协调度与协调发展度发生变化,同理,变更研究时间也会存在同样问题。其根源都是来自于标准化与熵权法确定指标权重过程依赖于数据池中的最大与最小值。因此,以往研究中利用因时空选择范围而波动的耦合协调度和协调发展度研究区域发展的时空特征,存在明显信度问题。而在实际管理应用中,则导致评价标准不稳定,因而削弱该模型的实践指导意义。
表10 河北省11市变更研究区域后耦合度C值变化情况
Table 10
| 年份/C值 | 石家庄 | 唐山 | 秦皇岛 | 邯郸 | 邢台 | 保定 | 张家口 | 承德 | 沧州 | 廊坊 | 衡水 | |
|---|---|---|---|---|---|---|---|---|---|---|---|---|
| 2008 | 省内 | 0.9485 | 0.9566 | 0.4873 | 0.8686 | 0.5998 | 0.7554 | 0.5608 | 0.4393 | 0.7673 | 0.7560 | 0.6480 |
| 三地 | 0.5440 | 0.5769 | 0.3006 | 0.4780 | 0.3344 | 0.4171 | 0.3278 | 0.2700 | 0.4374 | 0.4196 | 0.3738 | |
| 差值 | 0.4045 | 0.3796 | 0.1868 | 0.3906 | 0.2654 | 0.3384 | 0.2331 | 0.1693 | 0.3300 | 0.3364 | 0.2742 | |
| 2009 | 省内 | 0.9139 | 0.9669 | 0.4567 | 0.7358 | 0.5463 | 0.7053 | 0.5507 | 0.4120 | 0.7162 | 0.6428 | 0.6449 |
| 三地 | 0.5435 | 0.5716 | 0.2946 | 0.4445 | 0.3224 | 0.4117 | 0.3533 | 0.2731 | 0.4352 | 0.3821 | 0.3906 | |
| 差值 | 0.3705 | 0.3953 | 0.1621 | 0.2913 | 0.2238 | 0.2936 | 0.1974 | 0.1389 | 0.2810 | 0.2607 | 0.2543 | |
| 2010 | 省内 | 0.9642 | 0.9793 | 0.4850 | 0.8040 | 0.5742 | 0.7400 | 0.6128 | 0.3918 | 0.7676 | 0.6764 | 0.5916 |
| 三地 | 0.5659 | 0.5942 | 0.3041 | 0.4593 | 0.3385 | 0.4245 | 0.3857 | 0.2533 | 0.4574 | 0.3908 | 0.3529 | |
| 差值 | 0.3983 | 0.3851 | 0.1808 | 0.3446 | 0.2356 | 0.3155 | 0.2271 | 0.1386 | 0.3102 | 0.2856 | 0.2388 | |
| 2011 | 省内 | 0.9002 | 0.8767 | 0.5692 | 0.8429 | 0.6356 | 0.7691 | 0.6694 | 0.4091 | 0.8497 | 0.7704 | 0.6755 |
| 三地 | 0.6271 | 0.6503 | 0.3454 | 0.4767 | 0.3720 | 0.4332 | 0.4123 | 0.2600 | 0.4994 | 0.4361 | 0.3951 | |
| 差值 | 0.2731 | 0.2265 | 0.2238 | 0.3661 | 0.2636 | 0.3359 | 0.2571 | 0.1491 | 0.3503 | 0.3343 | 0.2804 | |
| 2012 | 省内 | 0.6351 | 0.9778 | 0.3989 | 0.8298 | 0.6483 | 0.7577 | 0.6361 | 0.3867 | 0.8536 | 0.7128 | 0.6369 |
| 三地 | 0.9949 | 0.5937 | 0.2497 | 0.4816 | 0.3967 | 0.4433 | 0.4134 | 0.2615 | 0.5164 | 0.4243 | 0.3931 | |
| 差值 | -0.3598 | 0.3841 | 0.1492 | 0.3482 | 0.2516 | 0.3144 | 0.2227 | 0.1252 | 0.3372 | 0.2885 | 0.2438 | |
| 2013 | 省内 | 0.7377 | 0.7235 | 0.5428 | 0.9902 | 0.7543 | 0.8706 | 0.6175 | 0.4034 | 0.9900 | 0.9473 | 0.6662 |
| 三地 | 0.8169 | 0.8135 | 0.3519 | 0.6125 | 0.4721 | 0.5160 | 0.4043 | 0.2746 | 0.6006 | 0.5692 | 0.4184 | |
| 差值 | -0.0792 | -0.0900 | 0.1910 | 0.3778 | 0.2822 | 0.3546 | 0.2132 | 0.1288 | 0.3894 | 0.3781 | 0.2478 | |
| 2014 | 省内 | 0.7443 | 0.7472 | 0.4176 | 0.9291 | 0.7526 | 0.9470 | 0.5783 | 0.4489 | 0.9733 | 0.9542 | 0.7438 |
| 三地 | 0.7939 | 0.7829 | 0.2532 | 0.5627 | 0.4708 | 0.5540 | 0.3797 | 0.3067 | 0.6191 | 0.5750 | 0.4723 | |
| 差值 | -0.0496 | -0.0356 | 0.1644 | 0.3664 | 0.2818 | 0.3930 | 0.1986 | 0.1422 | 0.3542 | 0.3792 | 0.2715 | |
| 2015 | 省内 | 0.7449 | 0.7616 | 0.5935 | 0.9293 | 0.7963 | 0.9481 | 0.5609 | 0.4181 | 0.9266 | 0.9423 | 0.6807 |
| 三地 | 0.8137 | 0.7917 | 0.4115 | 0.5861 | 0.5281 | 0.5961 | 0.3889 | 0.3019 | 0.5833 | 0.5873 | 0.4547 | |
| 差值 | -0.0688 | -0.0301 | 0.1819 | 0.3433 | 0.2683 | 0.3520 | 0.1720 | 0.1162 | 0.3434 | 0.3550 | 0.2260 | |
| 2016 | 省内 | 0.7889 | 0.7356 | 0.5808 | 0.9825 | 0.7370 | 0.9978 | 0.6017 | 0.4165 | 0.9621 | 0.9500 | 0.8007 |
| 三地 | 0.7564 | 0.8085 | 0.3862 | 0.6110 | 0.4765 | 0.6189 | 0.4065 | 0.2861 | 0.6457 | 0.5805 | 0.5280 | |
| 差值 | 0.0325 | -0.0729 | 0.1945 | 0.3715 | 0.2604 | 0.3789 | 0.1951 | 0.1304 | 0.3164 | 0.3694 | 0.2726 | |
| 2017 | 省内 | 0.8342 | 0.8473 | 0.6685 | 0.9765 | 0.7463 | 0.8917 | 0.6729 | 0.4589 | 0.9825 | 0.9866 | 0.7713 |
| 三地 | 0.7122 | 0.6842 | 0.4381 | 0.6124 | 0.4857 | 0.5479 | 0.4504 | 0.3052 | 0.6292 | 0.5920 | 0.4896 | |
| 差值 | 0.1219 | 0.1631 | 0.2304 | 0.3641 | 0.2607 | 0.3438 | 0.2225 | 0.1537 | 0.3533 | 0.3946 | 0.2817 | |
| 注:差值变化 | [0, 0.1) | [0.1, 0.2) | [0.2, 0.3) | [0.3, 0.4) | [0.4, 0.5) |
表11 河北省11市变更研究区域后协调发展度D值变化情况
Table 11
| 年份/D值 | 石家庄 | 唐山 | 秦皇岛 | 邯郸 | 邢台 | 保定 | 张家口 | 承德 | 沧州 | 廊坊 | 衡水 | |
|---|---|---|---|---|---|---|---|---|---|---|---|---|
| 2008 | 省内 | 0.5185 | 0.5378 | 0.4059 | 0.4421 | 0.3640 | 0.4125 | 0.3811 | 0.3570 | 0.4341 | 0.4354 | 0.3514 |
| 三地 | 0.3390 | 0.3554 | 0.2931 | 0.2974 | 0.2520 | 0.2830 | 0.2693 | 0.2514 | 0.2964 | 0.2949 | 0.2453 | |
| 2009 | 省内 | 0.5306 | 0.5553 | 0.3958 | 0.4186 | 0.3749 | 0.4077 | 0.3710 | 0.3693 | 0.4172 | 0.4152 | 0.3473 |
| 三地 | 0.3583 | 0.3711 | 0.2951 | 0.3061 | 0.2722 | 0.2918 | 0.2775 | 0.2746 | 0.3004 | 0.3007 | 0.2524 | |
| 2010 | 省内 | 0.5720 | 0.5911 | 0.4151 | 0.4718 | 0.3862 | 0.4462 | 0.3972 | 0.3739 | 0.4582 | 0.4379 | 0.3709 |
| 三地 | 0.3796 | 0.3949 | 0.3037 | 0.3273 | 0.2783 | 0.3127 | 0.2903 | 0.2759 | 0.3226 | 0.3087 | 0.2676 | |
| 2011 | 省内 | 0.5814 | 0.5849 | 0.4568 | 0.5053 | 0.4106 | 0.4731 | 0.4135 | 0.4002 | 0.4895 | 0.4837 | 0.3918 |
| 三地 | 0.4092 | 0.4216 | 0.3224 | 0.3441 | 0.2906 | 0.3246 | 0.2945 | 0.2914 | 0.3364 | 0.3304 | 0.2759 | |
| 2012 | 省内 | 0.5397 | 0.6380 | 0.4224 | 0.5015 | 0.4041 | 0.4724 | 0.4093 | 0.3917 | 0.5018 | 0.4791 | 0.3865 |
| 三地 | 0.5803 | 0.4247 | 0.3132 | 0.3468 | 0.2945 | 0.3302 | 0.3033 | 0.2975 | 0.3519 | 0.3411 | 0.2826 | |
| 2013 | 省内 | 0.4963 | 0.5143 | 0.4275 | 0.4923 | 0.3993 | 0.4723 | 0.4163 | 0.3866 | 0.5149 | 0.5041 | 0.3748 |
| 三地 | 0.4301 | 0.4476 | 0.3156 | 0.3421 | 0.2902 | 0.3292 | 0.3095 | 0.2944 | 0.3555 | 0.3505 | 0.2771 | |
| 2014 | 省内 | 0.5229 | 0.5305 | 0.4220 | 0.5078 | 0.4114 | 0.4932 | 0.3996 | 0.3984 | 0.5139 | 0.5107 | 0.3929 |
| 三地 | 0.4442 | 0.4453 | 0.3116 | 0.3515 | 0.2995 | 0.3369 | 0.2989 | 0.3014 | 0.3595 | 0.3556 | 0.2889 | |
| 2015 | 省内 | 0.5471 | 0.5468 | 0.4385 | 0.5208 | 0.4221 | 0.5010 | 0.4066 | 0.3919 | 0.5414 | 0.5411 | 0.3988 |
| 三地 | 0.4722 | 0.4620 | 0.3315 | 0.3713 | 0.3165 | 0.3539 | 0.3152 | 0.3079 | 0.3831 | 0.3844 | 0.3044 | |
| 2016 | 省内 | 0.5923 | 0.5595 | 0.4851 | 0.5526 | 0.4531 | 0.5435 | 0.4288 | 0.4141 | 0.5555 | 0.5744 | 0.4307 |
| 三地 | 0.4812 | 0.4800 | 0.3575 | 0.3835 | 0.3327 | 0.3747 | 0.3225 | 0.3163 | 0.3974 | 0.3986 | 0.3148 | |
| 2017 | 省内 | 0.5794 | 0.5926 | 0.5107 | 0.5189 | 0.4615 | 0.4923 | 0.4631 | 0.4468 | 0.5794 | 0.6087 | 0.4549 |
| 三地 | 0.4426 | 0.4409 | 0.3641 | 0.3597 | 0.3411 | 0.3408 | 0.3377 | 0.3324 | 0.4051 | 0.4090 | 0.3286 | |
注:表中颜色对应的协调发展度等级参照
6 结论与讨论
6.1 结论
随着对科学全面发展的追求,耦合效应与协调发展度成为有效的评价与研究区域发展水平的工具。其中耦合协调度模型因简便直观成为研究中使用最为普遍的模型。但在以往研究中,存在包括书写错误、丢失系数、错用权重和模型不成立四类主要误区,已经显著影响到学术研究的科学性。本文参照以往研究明确了传统耦合协调度模型的规范公式。但对于传统模型的现有解释惯例使得耦合度C在解释耦合关系时效度降低,同时也存在传统模型中协调发展度计算被简化问题。在探讨该传统模型在社会科学领域研究中效度问题基础上,进一步提出了耦合度的修正模型。无论是传统还是修正后的耦合协调度模型,仍存在指标构建的主观性、耦合结果的波动性和无可比性的信度问题。以京津冀生态与经济系统为例进行验证,证实修正后的耦合协调度模型具有较好的效度,并证实研究对象的时空变化会显著影响耦合协调度模型的信度。
6.2 讨论
首先,虽然本文提出了修正模型,并验证了模型效度,但鉴于研究者水平所限,仍存在四个有待突破的不足。第一,该新模型并非在 [0, 1] 完全效度高,在子系统差值较小的情况下C值的区分度较高,因而适用于社会科学研究。当子系统值差距极大,原模型效度可能更高。第二,该模型仍不够简化,特别是当推导到多元系统时,计算难度呈指数上升。第三,在以往研究中曾出现C值为0的极端情况[70,71,72]。这一极端情况多在对全国区域研究时出现,因为当对原始数据标准化处理时,可能会出现某个地区(西部地区为多)某个子系统所有指标全为全国该指标下的最小值,因此标准化处理后该子系统值为0,从而代入到耦合度计算公式中,出现只要一个子系统值为0,不论其他子系统值如何,最终计算出的C值都为0。本文新修正的模型仍未能解决这个问题。第四,新模型有一个潜在存在争议的地方,即C值对协调发展度D的影响变大。一方面由于原模型中 C值分异度低、值积聚于0.9~1.0之间,所以对D的影响远小于T。而在新模型中,C值分异度加大,使得其对D的影响与T相当,虽然更符合耦合协调度模型的初衷,即从单纯的发展水平转向基于协调水平与发展水平的整体均衡发展评价,但会出现D(0.5,0.5)> D(0.5,0.7) 这类看似异常情况。有两个解释或解决途径:一是回归到耦合协调度模型的初衷,即两个子系统耦合关系非常重要,所以即使均值更高,但认为出现差异就是潜在的风险信号;二是探寻更为有效的模型,如对于C和T的重要性赋予系数后再进行开方计算D。希望有学者能够修正出更加合适的模型,以解决上述问题。其次,该模型的学术性较高,但因为其本身的信度较低,导致其作为一种研究工具很有意义。但对于政府决策来说,不具有延续性,因而面向未来的实用性较低。因此,如何开发一个更具普适性的模型,或如何提高该模型的信度与稳定性,也是未来值得继续探讨的问题。
参考文献
资源型城市环境库兹涅茨曲线研究: 基于面板数据的实证分析
Environmental Kuznets Curve of resource-based cities in China: An empirical research based on panel data
丽江市经济发展与环境污染水平的关系
Study on the relationship between economic growth and environmental degradation of Lijiang city
北京市经济增长与环境污染水平计量模型研究
Modeling economic growth and environmental degradation of Beijing
城市化与生态环境交互耦合机制与规律性分析
Analysis of coupling mechanism and rules between urbanization and eco-environment
黄河三角洲区域生态经济系统动态耦合过程及趋势
Analysis of the dynamic coupling processes and trend of regional eco-economic system development in the Yellow River Delta
城乡耦合地域系统相互作用模型建构及应用: 以南京为例
The construction and application of interaction modeling about urban-rural coupling region's system: A case study of Nanjing
西南边疆山区耕地资源利用与粮食生产耦合态势: 以云南省为例
The coupling situation of farmland resources use and food production in mountainous area at China's southwest border: A case study in Yunnan province
渭河流域人地关系地域系统耦合状态分析
Quantitative analysis of coupling status of man-land relationship areal system in Weihe River Basin
福州市土地生态系统服务与城市化耦合度分析
Coupling degrees of land ecosystem services and urbanization of Fuzhou city
长江三角洲城市化效率与经济发展水平的耦合关系
Coupling relationship between urbanization efficiency and economic development level in the Yangtze River Delta
桂西地区地质遗迹与民族文化资源的空间关系及成因机理
Spatial relationship and formation mechanism of geological relics and ethnic cultural resources in Western Guangxi, China
秦巴特困连片区生态资产与经济贫困的耦合关系
Coupling relation analysis between ecological value and economic poverty of contiguous destitute areas in Qinling-Dabashan Region
转型期城市旅游业绩效系统耦合关联性测度及其前景预测: 以泛长江三角洲地区为例
Measure of city tourism performance system coupling association and forecast: A case study of the Pan-Yangtze River Delta
新疆区域基础设施与经济耦合的关联分析
Grey associative analysis of infrastructure system and economic development coupling in Xinjiang
西北干旱地区水资源—城市化复合系统耦合效应研究: 以石羊河流域为例
Coupling effect of water resources-urbanization composite system in north west arid region of China: A case of Shiyang River Basin
城市化与生态环境协调发展的动态耦合模型及其在干旱区的应用
The dynamic coupling model of the harmonious development between urbanization and eco-environment and its application in arid area
京津冀都市圈经济增长与生态环境关系研究
Research on the relationship between economic growth and ecological environment of Beijing-Tianjin-Hebei Metropolitan
长江三角洲地区产业演变的就业响应研究
Research on employment response of industrial evolution in Yangtze River Delta. Geography and
甘肃省县区单元城镇工矿用地与二三产业耦合状态的时空变化研究
Spatiotemporal changes of coupling between industrial land and secondary & service industries of Gansu's counties
辽宁沿海经济带经济与环境协调发展度的时空演变
The analysis of spatiotemporal evolution of economic and environmental coordination development degree in Liaoning Coastal Economic Belt
广西城市化与环境系统的耦合协调测度与互动分析
Coupling and coordination measurement and interactive analysis of urbanization and environment system in Guangxi province, China
中国资源型城市精明发展与环境质量的耦合关系及响应机制
Coupling relationship and its response mechanism between smart development and environmental quality in Chinese resource-based cities
区域经济增长与建筑业技术效率耦合的空间差异
The fluctuation and regional difference about the total factors productivity growth of township village enterprises in China
辽宁沿海地区用水效率与经济的耦合协调发展评价
Evaluation of the coupling coordination development between water use efficiency and economy in Liaoning Coastal Economic Belt
成都市县域土地利用碳收支与经济发展关系研究
Relations between land use carbon budget and economic development at county level in Chengdu city
城市基础设施与社会经济协调发展的定量评价方法与应用
Quantitative evaluation method and its application for infrastructure and social economy coordinated development
超大城市“新三化”的时空耦合协调性分析: 以中国十大城市为例
Coupling mechanism and space-time coordination of new-approach urbanization, new-approach industrialization and service industry modernization in megacity behemoths: A case study of ten cities in China
城市土地集约利用内部协调性的时空演变: 以武汉市中心城区为例
Spatio-temperal characteristics of internal coordination of intensive urban land use: A case study of the downtown of Wuhan
耕地保护、建设用地集约利用与城镇化耦合协调性研究
Research on coupling coordination among cultivated land protection, construction land intensive use and urbanization
农业现代化与工业化、信息化、城镇化的耦合协调发展研究
Study on the coupled and harmonious development of agricultural modernization and industrialization, informatization and urbanization
中国区域工业化与城市化的时空耦合协调机制分析
Analysis of coupling mechanism and space-time coordination of industrialization and urbanization in regions of China
基于投影寻踪模型的河南县域交通与经济协调性评价
Coordination degree between transportation and regional economic development based on projection pursuit model in Henan
人口—土地—经济城镇化的时空耦合协调性分析: 基于中国省际面板数据的实证研究
Analysis on spatial-temporal coupling coordinate degree among population, land and economy urbanization: Based on China provincial panel data
2007—2015年中国农村居民点用地与农村人口时空耦合关系
Coupling analysis of rural residential land and rural population in China during 2007-2015
三峡库区环境—经济—社会复合生态系统耦合协调发展研究
Coupling and coordinated development of the Three Gorges Reservoir Area's compound ecological system of environment, economy and society
四川农村人口土地和经济系统的协调发展及时空演变
Coordinated development and its' spatio-temporal evolution of rural population, land and economy system in Sichuan province. Chinese Journal of
沿海地区海洋经济—社会—生态协调度研究: 以山东省为例
Coastal marine economic-social-ecological coordination degree research: Take Shandong as the example
哈大走廊城市规模、紧凑度与土地集约化的耦合
Coupling coordinate degree among urban scale, compactness and land intensive utilization degree in Harbin-Dalian urban corridor
盘锦海岸带开发与生态耦合性分析
Development and ecological coupling analysis of Panjin Coastal Zone
基于耦合模型的新疆高新技术产业与新型工业化协调发展研究
Researching coordinate development of high-tech industry and new-type industrialization in Xinjiang based on coupling degree model
西北地区人口—经济—环境耦合协调度评价: 以甘肃庆阳为例
Evaluation of population-economy-environment coupling coordination degree in Northwest China: A case study of Qingyang, Gansu province
基于创新驱动的区域经济与生态环境协调发展的研究
Research on the harmonious development of regional economy and ecological environment based on innovation
生态文明视角下“五位一体”协调发展研究
Synergy among "Five Constructions" in China from the perspective of ecological civilization. Journal of Xi'an Jiaotong University:
贵州省人口、经济、空间、生活城市化耦合协调性研究
Study on coupling and coordination of population, economy, space and life urbanization in Guizhou province
耦合视角下的高校科研与教育系统关系: 以美国百强高校为例
The coordination analysis of coupling relationship between scientific research and education system in university: Case study of top 100 universities in USA
云南省人口城镇化与土地城镇化耦合协调性分析
Analysis on coupling and coordination between population urbanization and land urbanization in Yunnan province
人口—区域经济—环境发展耦合协调度分析
Coupling coordination of population, regional economy and environmental development
一种储能技术发展与储能标准耦合度计算方法
A method of quantifying coupling degree of energy storage technology and standard
中国省域经济、资源与环境协调分析: 兼论三系统耦合公式及其扩展形式
Coupling and coordinating degrees of provincial economy, resources and environment in China
中国区域工业化、城镇化与农业现代化耦合协调度及其影响因素研究
Analysis of coordinated degree of China's regional industrialization, urbanization and agricultural modernization and is influencing factors
东北振兴以来吉林省四化发展的协调性研究
The coordination development of four modernizations in Jilin province since the revival of Northeast China
环境与经济协调发展的定量评判及其分类体系: 以珠江三角洲城市群为例
Quantitative judgement and classification system for coordinated development of environment and economy: A case study of the city group in the Pearl River Delta
建筑业与区域经济增长的耦合协调机理研究
On coupling coordinative mechanism of construction industry and regional economic development
中国区域开发强度与资源环境水平的耦合关系演化
Evolution of the coupling relationship between regional development strength and resource environment level in China
城乡经济均衡发展与基本公共服务均等化: 基于耦合与协调模型的分析
Coordinated development of urban and rural economy and equalization of basic public services: Based on the coupling and coordinating model
江苏省经济与文化协调发展的过程、格局研究
A study on the process and structure of coordinated development between economy and culture of Jiangsu province
基于耦合模型的陕西省农业生态环境与经济协调发展研究
On coordination development of agricultural ecological-environment and economy in Shaanxi province based on coupling degree model
南疆铁路沿线地区发展质量监测与预警系统的耦合
Monitoring and early warning system of development quality along the Southern Xinjiang Railway
兰州市经济与环境协调发展评价与对策研究
Countermeasures study and assessment on coordinated development of economy and environment in Lanzhou
南京市土地利用协调发展度分区评价研究
Evaluation of land use coordinated development degree of districts and counties in Nanjing city. China Population,
2000中国可持续发展战略报告
2000 China Sustainable Development Strategy Report
重庆市新型城镇化质量与生态环境承载力耦合分析
An analysis of coupling between the bearing capacity of the ecological environment and the quality of new urbanization in Chongqing
基于精明发展的城市绩效与生态环境耦合研究: 以哈长城市群为例
Coupling research between urban performance and ecological environment based on smart development: A case study of Harbin-Changchun City Group
中国陆地经济与生态环境协调发展的空间演变
Evaluation of the coordinated development of economy and eco-environmental systems and spatial evolution in China
沈阳经济区经济与环境系统动态耦合协调演化
Coordinated evolvement of dynamic coupling between economic and environmental systems in Shenyang Metropolitan Area
哈大齐工业走廊经济与环境协调发展评价指标体系: 基于脆弱性视角的研究
Research on evaluation index system of the coordination between economic development and environment in Ha-Da-Qi industrial corridor based on the angle of view of vulnerability
哈大巨型城市带空间开发—经济发展—环境演变的耦合分异机制
The differentiation mechanism of coupling degree among space exploitation, economy development and environment evolution in Harbin-Dalian Giant Urban Belt
适宜性人力资本与区域经济协调发展
Appropriate human capital and coordinated development of regional economy
基于熵权TOPSIS模型的区域资源环境承载力评价实证研究
Empirical study about the carrying capacity evaluation of regional resources and environment based on entropy-weight TPOSIS model
海洋产业集聚与海洋科技人才集聚协同发展研究: 基于耦合模型构建
The coupling evaluation model of China's marine industrial aggregation and marine science and technology talents aggregation
中国省域新型城镇化的动态耦合协调发展机制研究
Research on the dynamic coupling and healthy development mechanism of the new urbanization in the provinces of China
