×
模态框(Modal)标题
在这里添加一些文本
Close
Close
Submit
Cancel
Confirm
×
模态框(Modal)标题
×
Journal
Article
Figure
Search
EN
中文
Home
About Journal
Overview
Indexing
Awards
Editorial Board
Guide for Authors
Browse
Current Issue
Online First
Archive
Highlights
Topic
Archive by Subject
Most Viewed
Most Download
Most Cited
E-mail Alert
RSS
Subscription
Guidelines
Contact Us
EN
中文
Figure/Table detail
The characteristics and influencing factors of the embodied energy flow network in fishery trade among countries along the 21st Century Maritime Silk Road
ZHAO Liang-shi, JIANG Jia-xi, WANG Ze-yu
JOURNAL OF NATURAL RESOURCES
, 2024, 39(
11
): 2691-2720. DOI:
10.31497/zrzyxb.20241112
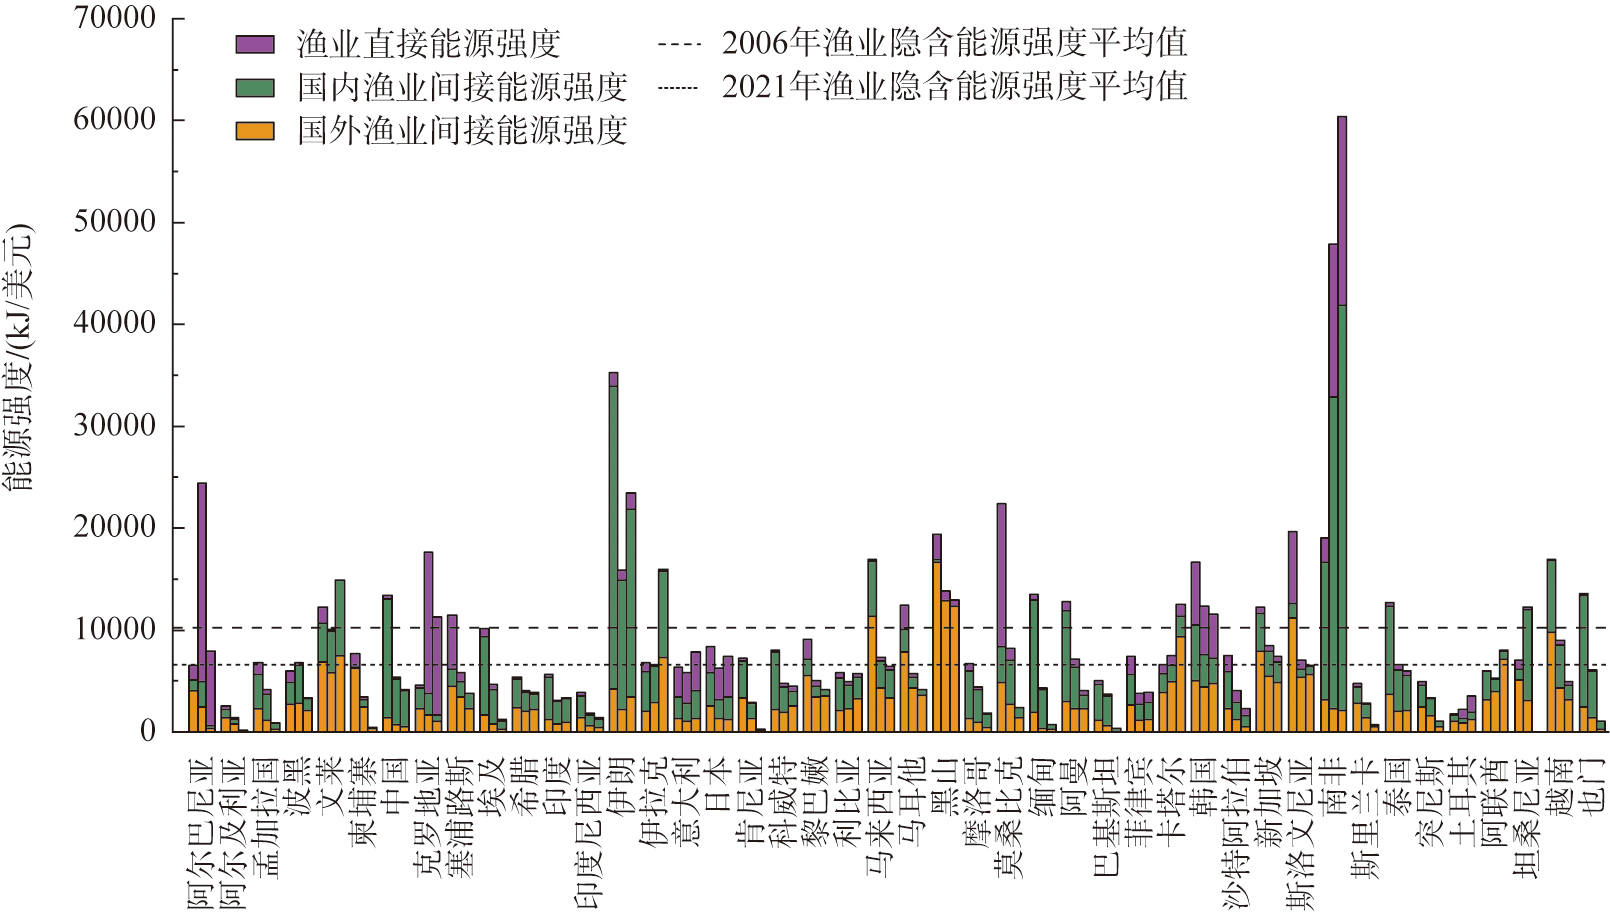
Fig. 3
Evolution and comparison of embodied energy intensity of fishery in countries along the MSR during 2006-2021
Other figure/table from this article
Table 1
Countries along the 21st Century Maritime Silk Road (MSR) and their regional division
Fig. 1
Evolution of fishery trade volume among countries along the MSR from 2002 to 2022
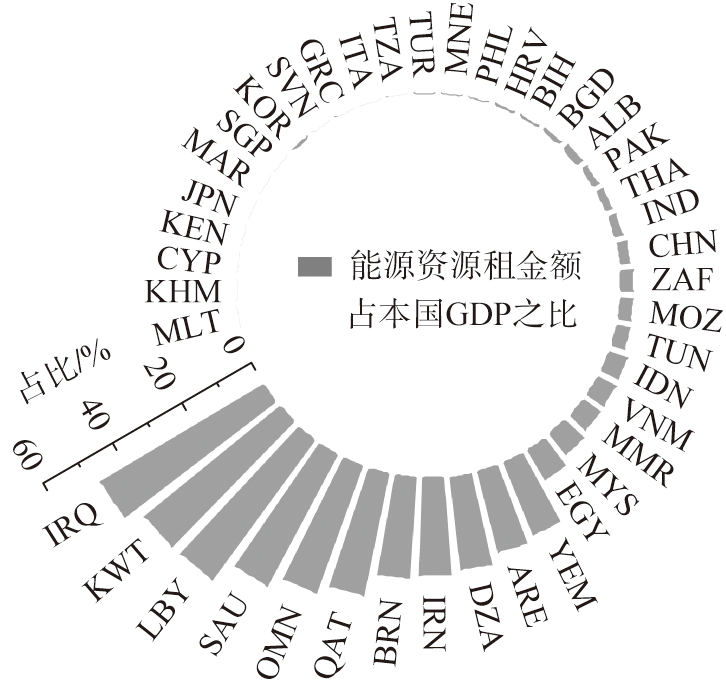
Fig. 2
The ratio of rent amount of energy resources of countries along the MSR to their GDP
Fig. 4
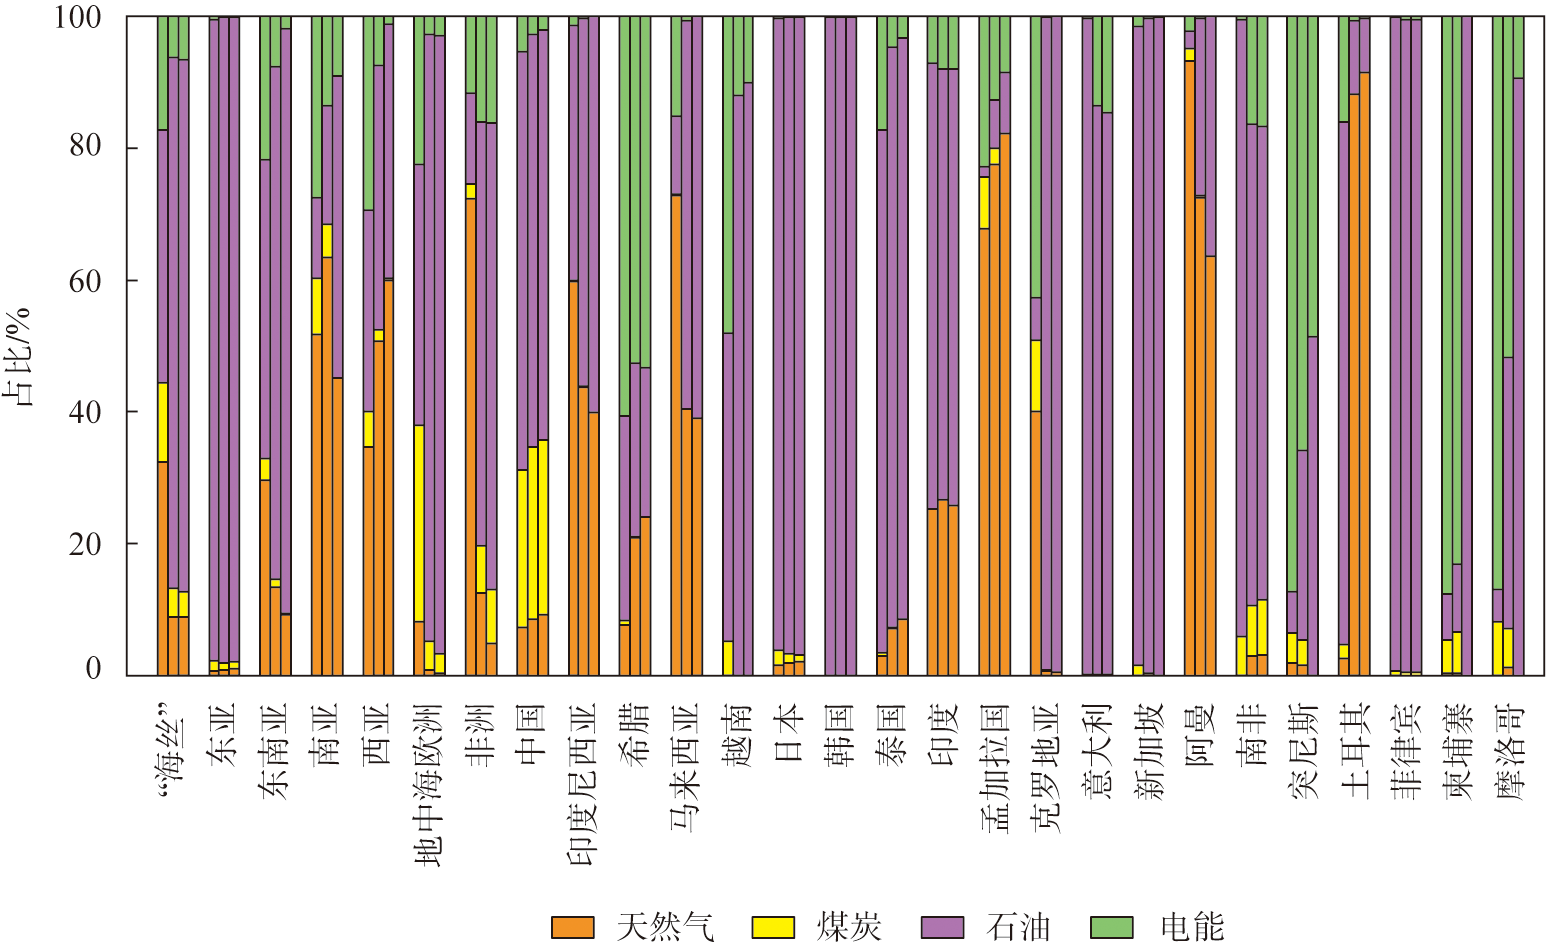
Energy type structure of direct energy intensity of fishery in countries along the MSR
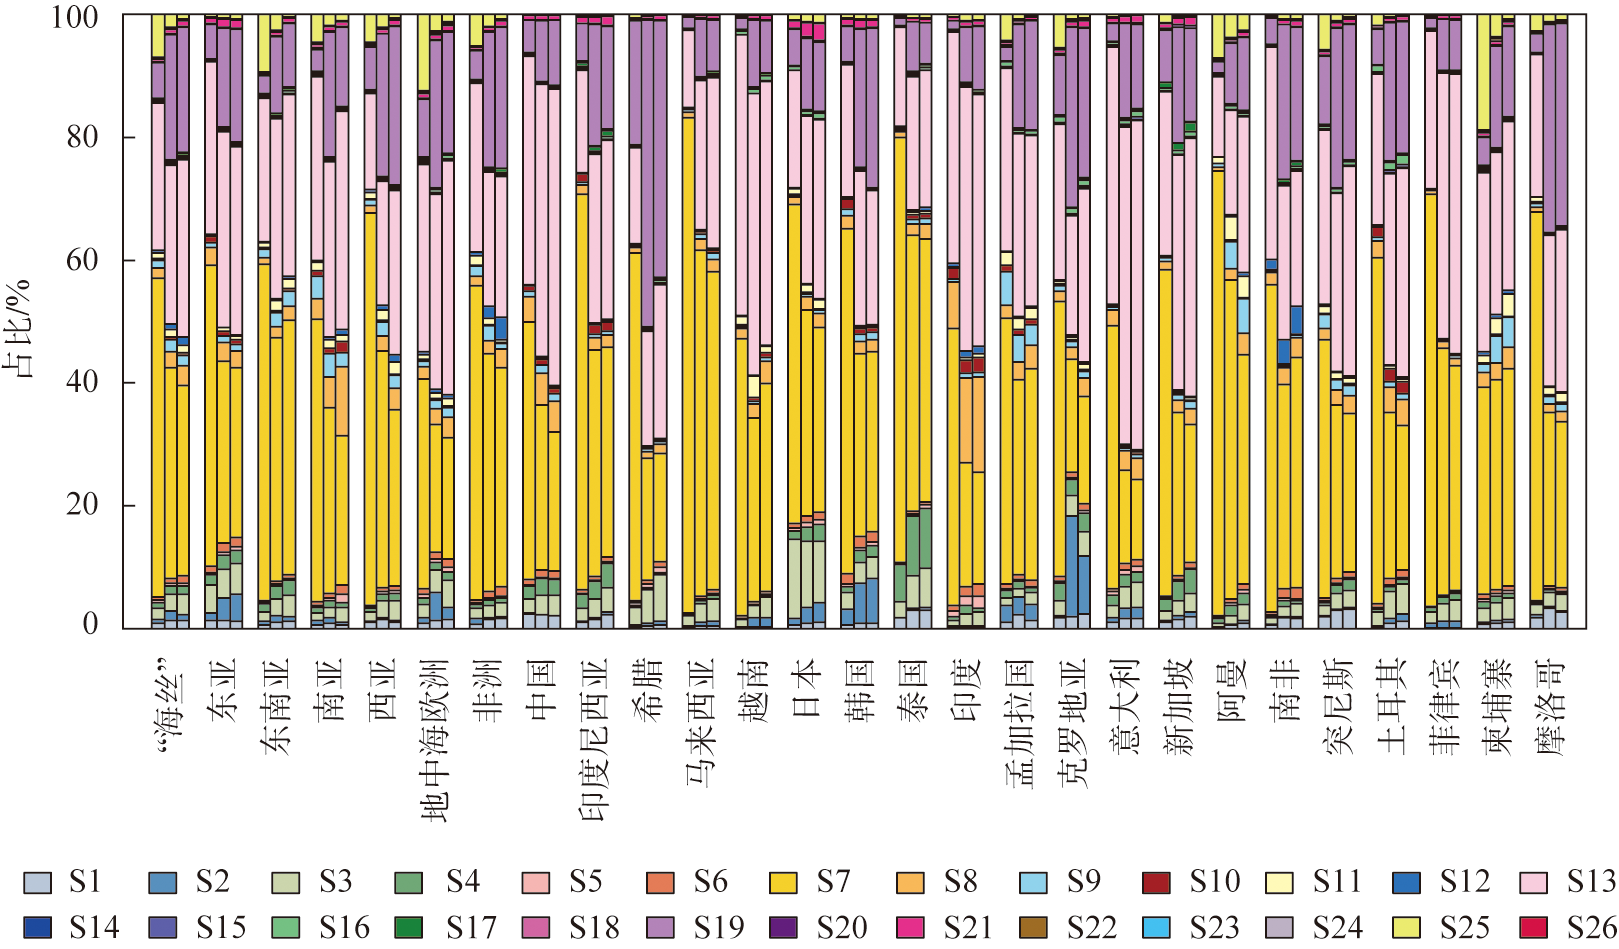
Fig. 5
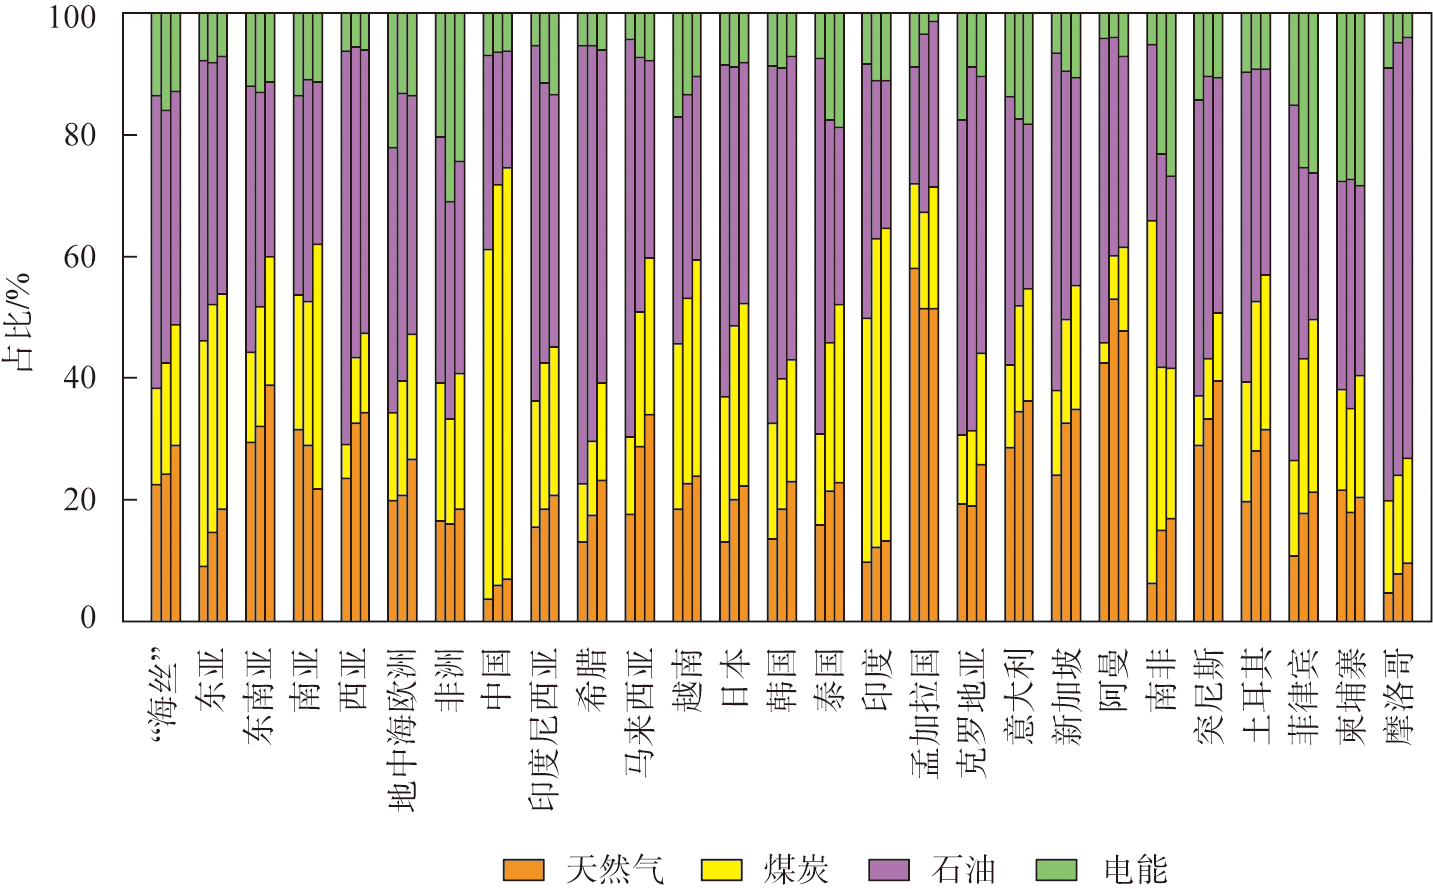
Energy type structure of indirect energy intensity of fishery in countries along the MSR
Fig. 6
Sectoral structure of indirect energy intensity of fishery in countries along the MSR
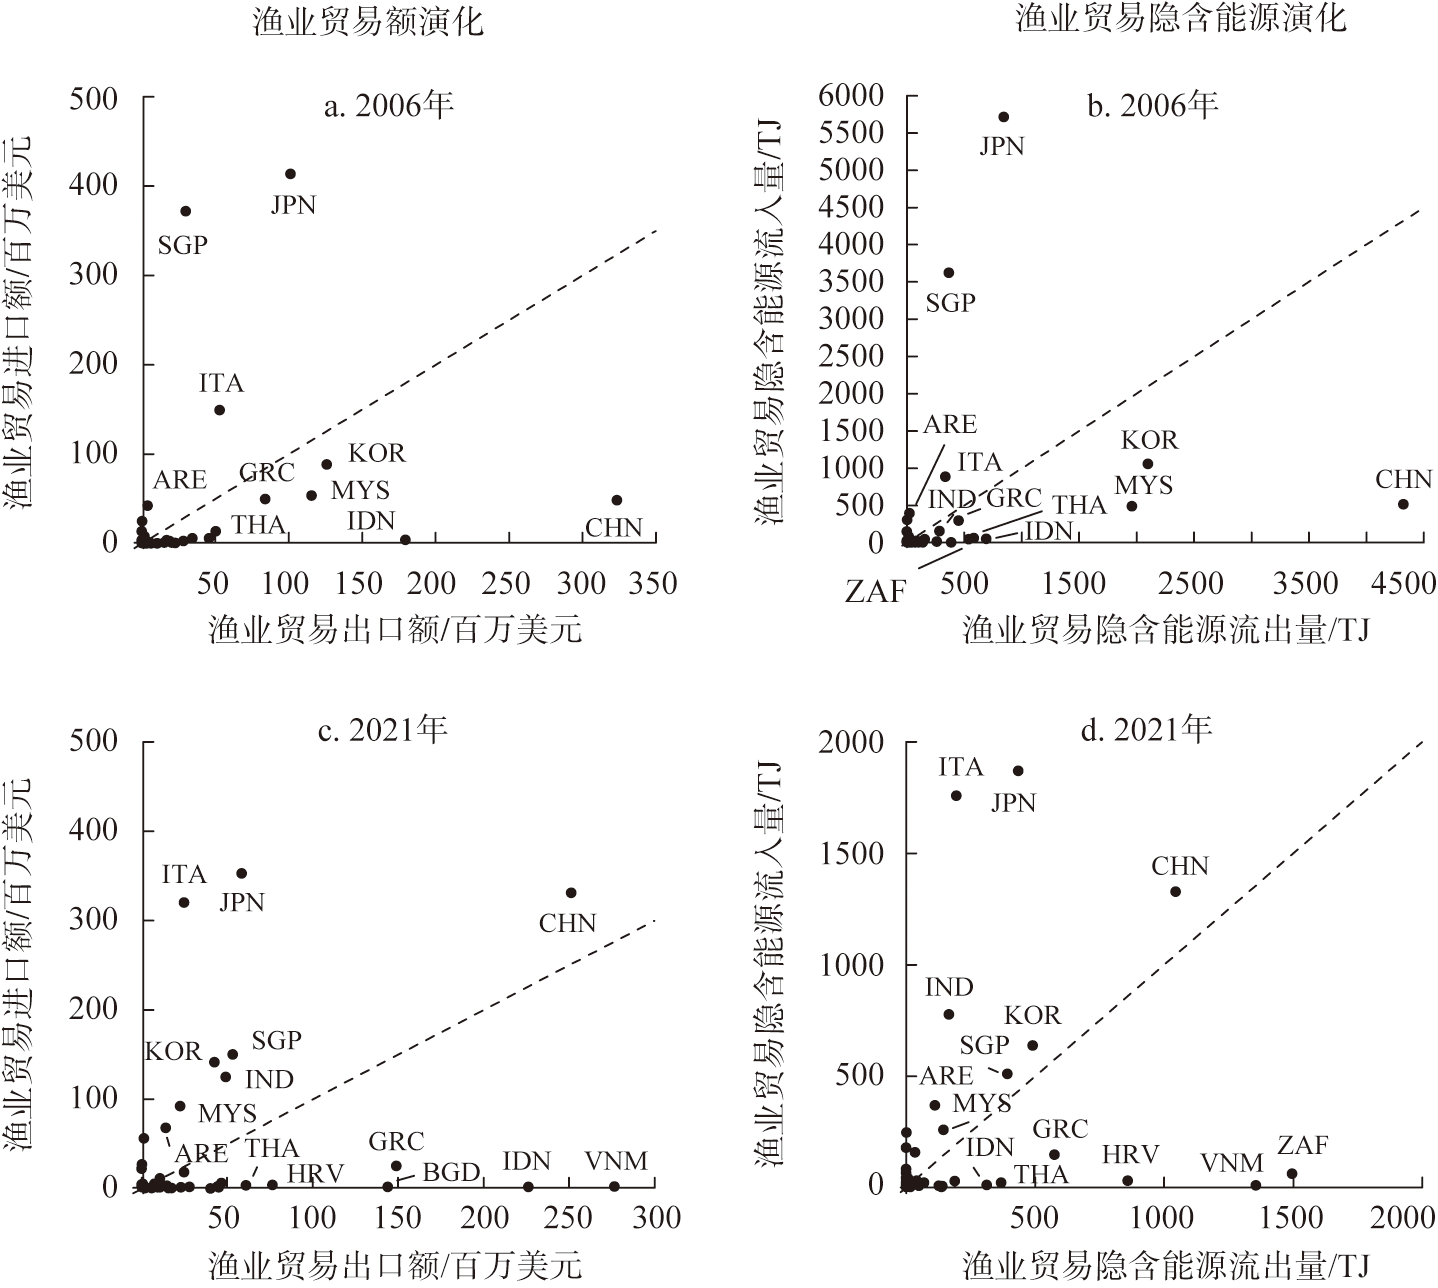
Fig. 7
Evolution of fishery trade and its embodied energy in countries along the MSR
Table 2
Evolution of the overall network characteristics from 2006 to 2021
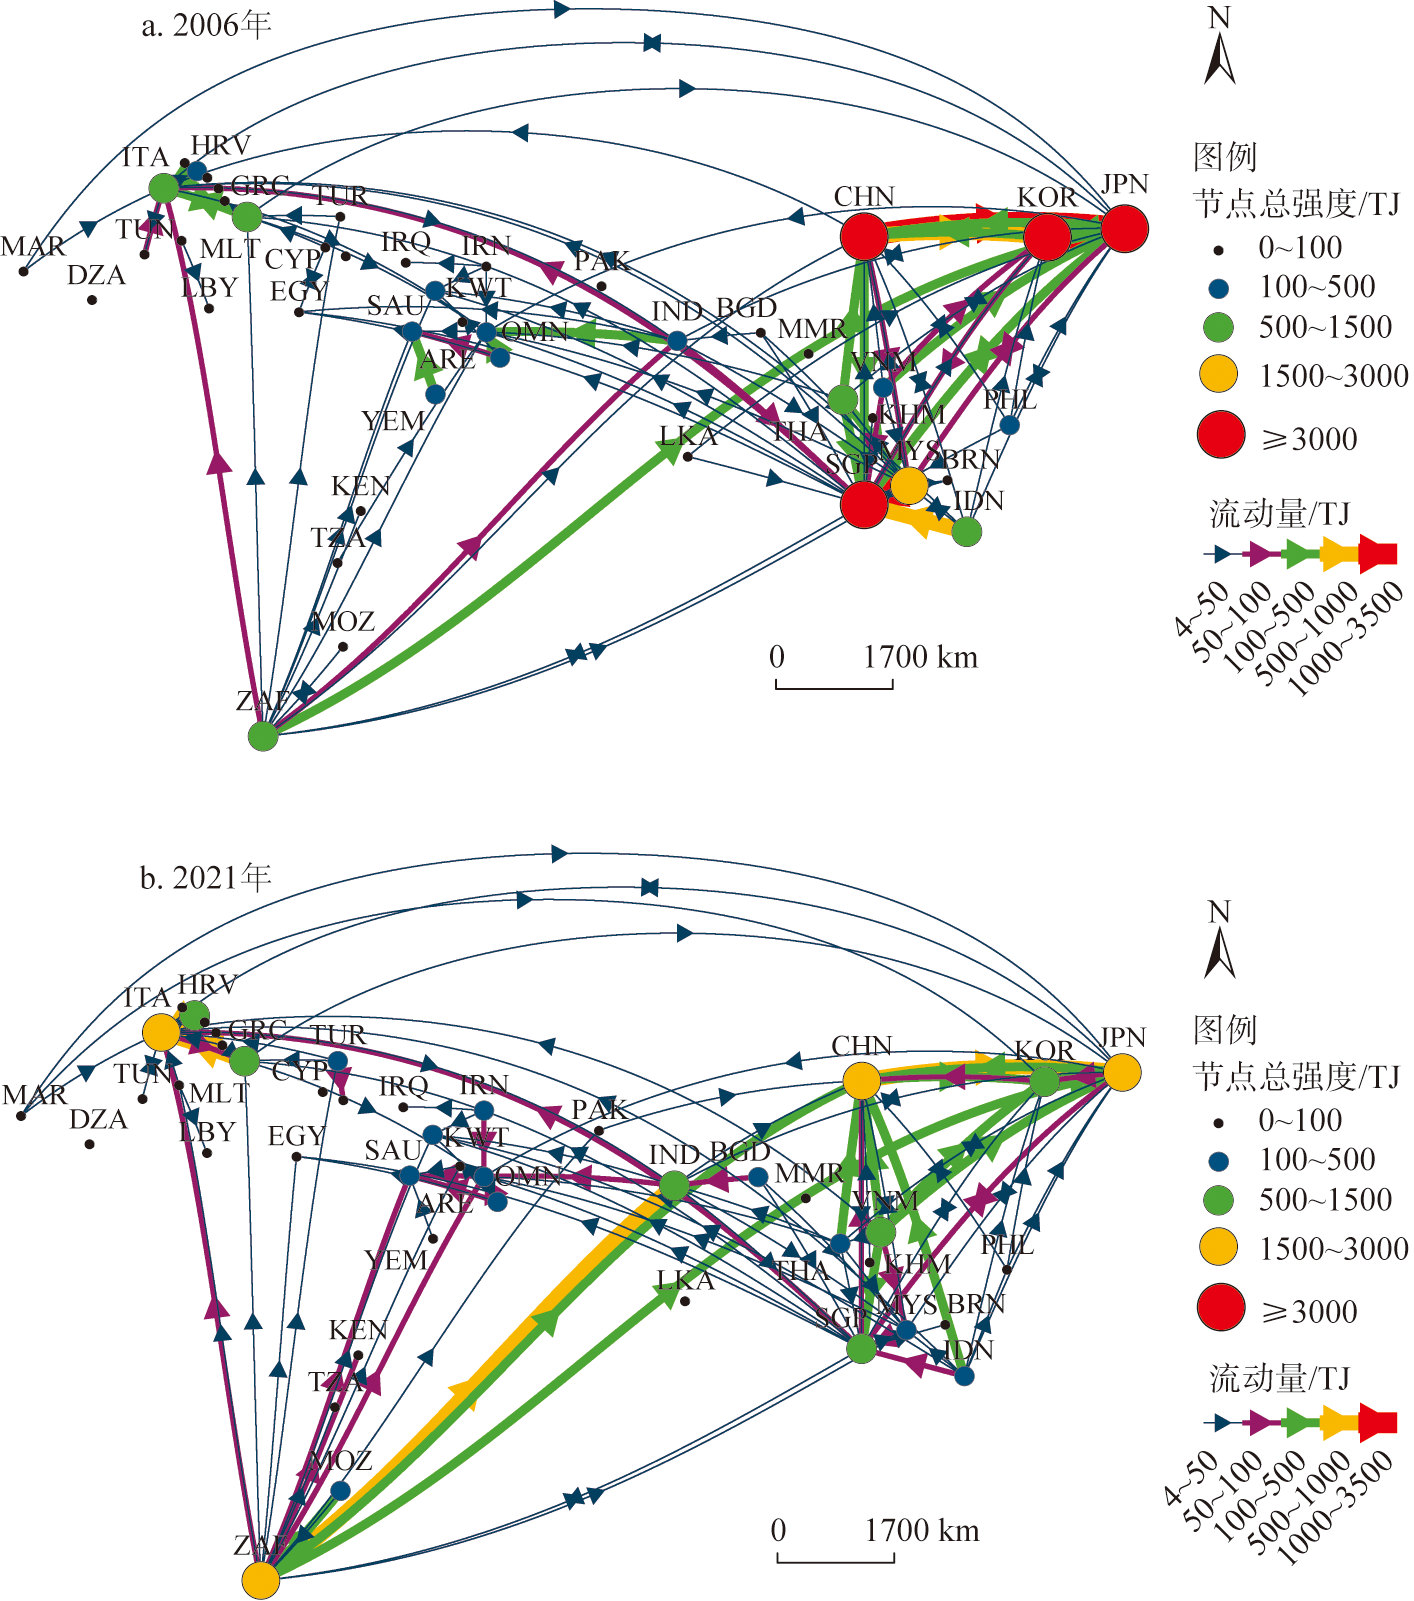
Fig. 8
Spatial patterns of embodied energy flow in fishery trade among countries along the MSR in 2006 and 2021
Table 3
The top 10 countries of
K
and
S
values in 2006 and 2021
Table 4
The top 10 countries of
BC
and
CC
values in 2006 and 2021
Table 5
The spillover effect among plates
Table 6
The density matrix and image matrix of plates
Table 7
The influencing factors and their explanations
Table 8
Region-wide QAP regression results from 2006 to 2021
Table 9
QAP regression results by region from 2006 to 2021
Table 10
Region-wide QAP regression robustness test results (The breakpoint value=80% of the average)
Table 11
Region-wide QAP regression robustness test results (The breakpoint value=120% of the average)
Table 12
QAP regression robustness test results by region