
西部资源型城市绿色发展效率时空分异与驱动力
|
窦睿音(1989- ),男,陕西西安人,博士,副教授,主要从事资源型城市转型研究。E-mail: douruiyin@xisu.edu.cn |
收稿日期: 2022-01-04
修回日期: 2022-04-07
网络出版日期: 2023-01-28
基金资助
国家自然科学基金项目(42201324)
西安外国语大学校级科研项目(21XWC02)
Research on spatiotemporal heterogeneity and driving forces of green development efficiency in resource-based cities of Western China
Received date: 2022-01-04
Revised date: 2022-04-07
Online published: 2023-01-28
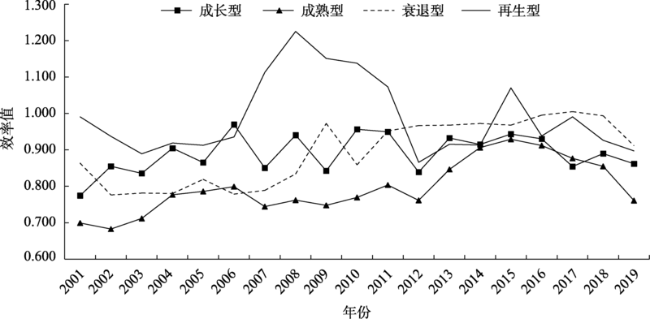
绿色发展是资源型城市高质量转型的重要体现。通过构建绿色发展效率评价体系,基于MinDs模型、泰尔指数、地理探测器等方法,测算2001—2019年西部资源型城市绿色发展效率时空分异特征,分析其驱动因素。结论如下:(1)西部资源型城市绿色发展效率以2015年为界,呈“先升后降”变化,西北、广西的资源型城市整体上升,西南和内蒙古的资源型城市近年呈下降趋势,成长型城市发展较为稳定,成熟型和再生型城市2017年后下降明显,衰退型城市呈上升趋势;(2)西部资源型城市绿色发展效率表现为极低和极高区间数量少、中间得分数量多的正态分布特征;(3)绿色发展效率空间非均衡的问题较为严重,其中,西北与西南地区的成熟型城市的变化是导致绿色发展效率差异扩大的主要原因;(4)经济发展、城市化、城市规模和技术创新能够显著提升西部资源型城市绿色发展效率,不同空间范围和不同生命周期下的资源型城市绿色发展效率驱动因素各有特点。研究对提升西部各类资源型城市绿色发展效率有实际意义。
窦睿音 , 焦贝贝 , 张文洁 , 张鹏飞 . 西部资源型城市绿色发展效率时空分异与驱动力[J]. 自然资源学报, 2023 , 38(1) : 238 -254 . DOI: 10.31497/zrzyxb.20230115
Green development is an important manifestation of the high-quality transformation of resource-based cities. The study develops a green development efficiency evaluation system, using MinDs model, Theil index, Geodetector and other methods, to measure green development efficiencies in resource-based cities of Western China from 2001 to 2019, and analyzes the spatiotemporal heterogeneity characteristics and associated driving factors. The main conclusions are as follows: (1) The green development efficiency of resource-based cities in the western region is bounded by 2015, showing a trend of "rising first and then falling", the green development efficiency change trends of different types of cities are quite different, resource-based cities in Northwest China and Guangxi have shown an upward trend as a whole, resource-based cities in Southwest China and Inner Mongolia have shown a downward trend in recent years, growing cities have developed relatively stable, mature and regenerating cities have declined significantly after 2017, and declining cities have shown an upward trend. (2) The green development efficiency of resource-based cities in the western region is characterized by a normal distribution with a small number of extremely low and extremely high intervals, and a large number of intermediate scores. (3) The problem of spatial unevenness of green development efficiency is still serious. Changes in the efficiencies of mature cities in northwest and southwest regions are the dominant factors for expanding gaps in the efficiencies of resource-based cities in Western China. (4) Economic development, urbanization, city size expansion and technological innovation can significantly increase the green development efficiency of resource-based cities in the whole study area. Moreover, the driving factors of green development efficiency of resource-based cities in different spatial ranges and different life cycles have their own characteristics. The research has practical significance for improving the green development efficiency of various resource-based cities in the western region of China.
表1 本研究的研究对象Table 1 Research objects of this study |
| 研究范围 | 省(自治区) | 资源型城市 | 省会 |
|---|---|---|---|
| 西北片区 | 陕西 | 宝鸡2、咸阳1、铜川3、渭南2、延安1、榆林1 | 西安 |
| 甘肃 | 武威1、庆阳1、平凉2、白银3、金昌2、张掖4、陇南1 | 兰州 | |
| 宁夏 | 石嘴山3 | 银川 | |
| 新疆 | 克拉玛依2 | 乌鲁木齐 | |
| 西南片区 | 四川 | 攀枝花2、泸州3、南充1、雅安2、广元2、达州2、自贡2、广安2 | 成都 |
| 云南 | 昭通1、曲靖2、保山2、普洱2、丽江4、临沧2 | 昆明 | |
| 贵州 | 六盘水1、安顺2 | 贵阳 | |
| 内蒙古片区 | 内蒙古 | 包头4、乌海3、赤峰2、鄂尔多斯1、呼伦贝尔1 | 呼和浩特 |
| 广西片区 | 广西 | 贺州1、百色2、河池2 | 南宁 |
| 总计/个 | 39 | 9 |
注:按资源型城市的生命周期发展规律,1为成长型阶段;2为成熟型阶段;3为衰退型阶段;4为再生型阶段。 |
表2 西部资源型城市绿色发展效率评价指标体系Table 2 Evaluation index system of green development efficiency of resource-based cities in Western China |
| 目标层 | 决策层 | 类型 | 指标层 | 衡量方式 | 单位 | 数据来源 |
|---|---|---|---|---|---|---|
| 西部资源型城市绿色发展 | 投入指标 | 劳动力 | 个体从业人员、城镇私营与单位从业人员之和 | 人 | 各城市《统计年鉴(2002—2020年)》《中国城市统计年鉴(2002—2020年)》 | |
| 资本 | 固定资产投资额 | 万元 | ||||
| 资源 | 供水总量 | 万t | ||||
| 能源 | 全社会用电量 | 亿kW·h | ||||
| 产出指标 | 期望 产出 | 经济发展 | 城市人均GDP | 元/人 | ||
| 污染治理能力 | 污水处理率、一般固废综合利用率、工业二氧化硫处理率、工业粉尘去除率与生活垃圾无害化处理率赋权所求综合指数 | — | ||||
| 非期望 产出 | 环境污染 | 工业废水、工业烟(粉)尘及工业二氧化硫排放量赋权所求综合指数 | — |
注:—表示无单位。 |
表3 2001—2019年西部资源型城市与其省会城市绿色发展效率得分对比Table 3 Comparison of green development efficiency scores between resource-based cities in Western China and their provincial capital cities during 2001-2019 |
| 年份 | 总得分 | 西北 | 西南 | 内蒙古 | 广西 | |||||||||||||
|---|---|---|---|---|---|---|---|---|---|---|---|---|---|---|---|---|---|---|
| 省会 | 资源型 | 省会 | 资源型 | 省会 | 资源型 | 省会 | 资源型 | 省会 | 资源型 | |||||||||
| 2001 | 1.107 | 0.762 | 1.390 | 0.771 | 0.909 | 0.733 | 1.574 | 0.855 | 1.209 | 0.715 | ||||||||
| 2002 | 1.015 | 0.768 | 1.282 | 0.842 | 0.774 | 0.688 | 1.492 | 0.840 | 1.203 | 0.695 | ||||||||
| 2003 | 1.150 | 0.771 | 1.268 | 0.816 | 1.295 | 0.715 | 1.492 | 0.864 | 1.056 | 0.694 | ||||||||
| 2004 | 1.274 | 0.829 | 1.813 | 0.897 | 0.906 | 0.781 | 1.742 | 0.851 | 1.027 | 0.705 | ||||||||
| 2005 | 1.150 | 0.823 | 1.399 | 0.899 | 1.127 | 0.747 | 1.490 | 1.005 | 1.029 | 0.553 | ||||||||
| 2006 | 1.075 | 0.864 | 1.355 | 0.908 | 1.120 | 0.775 | 1.370 | 1.197 | 0.596 | 0.568 | ||||||||
| 2007 | 0.897 | 0.810 | 1.095 | 0.859 | 0.836 | 0.732 | 1.586 | 1.093 | 0.495 | 0.511 | ||||||||
| 2008 | 1.202 | 0.857 | 1.713 | 0.945 | 1.105 | 0.767 | 1.325 | 1.076 | 0.533 | 0.535 | ||||||||
| 2009 | 0.960 | 0.836 | 1.343 | 0.916 | 0.879 | 0.744 | 1.095 | 1.087 | 0.497 | 0.513 | ||||||||
| 2010 | 1.009 | 0.868 | 1.425 | 0.984 | 0.876 | 0.765 | 1.137 | 1.031 | 0.621 | 0.566 | ||||||||
| 2011 | 1.123 | 0.890 | 1.461 | 0.988 | 1.148 | 0.799 | 1.322 | 1.066 | 0.619 | 0.598 | ||||||||
| 2012 | 0.962 | 0.818 | 1.273 | 0.966 | 0.874 | 0.702 | 1.242 | 0.896 | 0.658 | 0.567 | ||||||||
| 2013 | 1.009 | 0.892 | 1.253 | 1.024 | 0.928 | 0.796 | 1.190 | 0.929 | 1.105 | 0.676 | ||||||||
| 2014 | 1.008 | 0.921 | 1.180 | 1.027 | 1.026 | 0.816 | 1.212 | 0.930 | 1.068 | 0.935 | ||||||||
| 2015 | 0.949 | 0.950 | 1.238 | 1.036 | 0.750 | 0.855 | 1.207 | 1.022 | 1.084 | 0.903 | ||||||||
| 2016 | 0.974 | 0.933 | 1.254 | 1.020 | 0.788 | 0.822 | 1.276 | 0.966 | 1.088 | 1.038 | ||||||||
| 2017 | 1.101 | 0.897 | 1.403 | 0.992 | 1.077 | 0.831 | 1.092 | 0.988 | 1.071 | 0.627 | ||||||||
| 2018 | 1.078 | 0.887 | 1.361 | 1.022 | 1.066 | 0.783 | 1.085 | 0.905 | 1.057 | 0.736 | ||||||||
| 2019 | 1.105 | 0.822 | 1.368 | 1.009 | 1.149 | 0.682 | 1.071 | 0.862 | 1.056 | 0.564 | ||||||||
表4 绿色发展效率驱动力指标Table 4 Driving force indicators of green development efficiency |
| 代码 | 探测因子 | 因子含义 |
|---|---|---|
| X1 | 经济发展水平 | 人均GDP(以2001年为基期折算后的实际值) |
| X2 | 产业转型水平 | 第三产业增加值/第二产业增加值 |
| X3 | 市场多元化水平 | 第三产业从业人员/社会从业人员 |
| X4 | 人力资本素质 | 每万人在校大学生数 |
| X5 | 城市化水平 | 城市常住人口/总人口 |
| X6 | 能源强度 | 全社会用电量与用水量综合指数 |
| X7 | 政府支持 | 一般性地方财政支出占GDP总值比例 |
| X8 | 城市规模 | 地区年末总人口数 |
| X9 | 教育投入 | 地区财政支出中教育支出占比 |
| X10 | 对外开放水平 | 当年直接利用外资金额占GDP比例 |
| X11 | 技术创新水平 | 地区财政支出中技术研发支出占比 |
| X12 | 金融发展水平 | 金融机构年末存贷款余额占GDP比例 |
| X13 | 信息基础设施水平 | 地区邮电业务总量 |
表5 不同空间划分视角下绿色发展效率驱动因素Table 5 Driving factors of green development efficiency from the perspective of different spatial divisions |
| 研究时段/年 | 影响因素 | 全域 | 西北 | 西南 | 内蒙古 | 广西 | 影响因素 | 全域 | 西北 | 西南 | 内蒙古 | 广西 |
|---|---|---|---|---|---|---|---|---|---|---|---|---|
| 整体 | 经济发展 水平X1 | 0.331 | 0.244 | 0.076 | 0.618 | 0.385 | 城市规模X8 | 0.565 | 0.569 | 0.402 | 0.828 | 0.459 |
| 2001—2012 | 0.243 | 0.154 | 0.056 | 0.478 | 0.282 | 0.535 | 0.552 | 0.391 | 0.741 | 0.455 | ||
| 2013—2019 | 0.482 | 0.399 | 0.110 | 0.858 | 0.560 | 0.615 | 0.597 | 0.421 | 0.977 | 0.466 | ||
| 整体 | 产业转型 水平X2 | 0.286 | 0.251 | 0.239 | 0.292 | 0.364 | 教育投入X9 | 0.360 | 0.330 | 0.322 | 0.352 | 0.435 |
| 2001—2012 | 0.276 | 0.321 | 0.288 | 0.181 | 0.314 | 0.373 | 0.302 | 0.361 | 0.390 | 0.438 | ||
| 2013—2019 | 0.304 | 0.130 | 0.155 | 0.481 | 0.451 | 0.338 | 0.378 | 0.256 | 0.287 | 0.430 | ||
| 整体 | 市场多元 化水平X3 | 0.292 | 0.301 | 0.289 | 0.398 | 0.180 | 对外开放水平X10 | 0.271 | 0.167 | 0.084 | 0.591 | 0.240 |
| 2001—2012 | 0.286 | 0.299 | 0.231 | 0.398 | 0.215 | 0.227 | 0.059 | 0.115 | 0.608 | 0.126 | ||
| 2013—2019 | 0.303 | 0.306 | 0.388 | 0.398 | 0.119 | 0.345 | 0.352 | 0.032 | 0.561 | 0.435 | ||
| 整体 | 人力资本 素质X4 | 0.236 | 0.261 | 0.288 | 0.215 | 0.180 | 技术创新水平X11 | 0.376 | 0.113 | 0.178 | 0.382 | 0.830 |
| 2001—2012 | 0.223 | 0.246 | 0.210 | 0.222 | 0.215 | 0.401 | 0.171 | 0.261 | 0.316 | 0.855 | ||
| 2013—2019 | 0.258 | 0.289 | 0.421 | 0.203 | 0.119 | 0.333 | 0.013 | 0.036 | 0.495 | 0.789 | ||
| 整体 | 城市化水平X5 | 0.453 | 0.428 | 0.177 | 0.454 | 0.752 | 金融发展水平X12 | 0.257 | 0.075 | 0.098 | 0.320 | 0.536 |
| 2001—2012 | 0.517 | 0.410 | 0.171 | 0.543 | 0.945 | 0.305 | 0.070 | 0.139 | 0.331 | 0.681 | ||
| 2013—2019 | 0.342 | 0.460 | 0.188 | 0.301 | 0.421 | 0.175 | 0.084 | 0.027 | 0.302 | 0.286 | ||
| 整体 | 能源强度X6 | 0.227 | 0.099 | 0.175 | 0.248 | 0.387 | 信息基础设施水平X13 | 0.224 | 0.194 | 0.083 | 0.218 | 0.402 |
| 2001—2012 | 0.195 | 0.095 | 0.190 | 0.259 | 0.235 | 0.180 | 0.118 | 0.054 | 0.214 | 0.333 | ||
| 2013—2019 | 0.283 | 0.107 | 0.151 | 0.229 | 0.647 | 0.301 | 0.324 | 0.131 | 0.226 | 0.522 | ||
| 整体 | 政府支持X7 | 0.322 | 0.113 | 0.300 | 0.367 | 0.508 | ||||||
| 2001—2012 | 0.305 | 0.123 | 0.315 | 0.298 | 0.485 | |||||||
| 2013—2019 | 0.350 | 0.095 | 0.274 | 0.485 | 0.548 |
表6 不同城市生命周期划分视角下绿色发展效率驱动因素Table 6 Driving factors of green development efficiency from the perspective of different growth stages |
| 研究时段/年 | 影响因素 | 成长型 | 成熟型 | 衰退型 | 再生型 | 影响因素 | 成长型 | 成熟型 | 衰退型 | 再生型 |
|---|---|---|---|---|---|---|---|---|---|---|
| 整体 | 经济发展 水平X1 | 0.429 | 0.333 | 0.435 | 0.744 | 城市规模X8 | 0.493 | 0.384 | 0.792 | 0.751 |
| 2001—2012 | 0.407 | 0.267 | 0.299 | 0.636 | 0.463 | 0.399 | 0.726 | 0.657 | ||
| 2013—2019 | 0.468 | 0.447 | 0.669 | 0.930 | 0.544 | 0.357 | 0.904 | 0.913 | ||
| 整体 | 产业转型 水平X2 | 0.192 | 0.221 | 0.395 | 0.556 | 教育投入X9 | 0.499 | 0.367 | 0.319 | 0.482 |
| 2001—2012 | 0.214 | 0.211 | 0.459 | 0.668 | 0.419 | 0.273 | 0.290 | 0.370 | ||
| 2013—2019 | 0.154 | 0.238 | 0.285 | 0.363 | 0.638 | 0.527 | 0.370 | 0.674 | ||
| 整体 | 市场多元 化水平X3 | 0.176 | 0.232 | 0.428 | 0.691 | 对外开放 水平X10 | 0.350 | 0.069 | 0.227 | 0.697 |
| 2001—2012 | 0.197 | 0.177 | 0.420 | 0.581 | 0.338 | 0.073 | 0.201 | 0.590 | ||
| 2013—2019 | 0.140 | 0.326 | 0.443 | 0.878 | 0.370 | 0.062 | 0.273 | 0.880 | ||
| 整体 | 人力资本 素质X4 | 0.138 | 0.229 | 0.196 | 0.921 | 技术创新 水平X11 | 0.296 | 0.157 | 0.128 | 0.258 |
| 2001—2012 | 0.143 | 0.152 | 0.207 | 0.886 | 0.265 | 0.242 | 0.192 | 0.338 | ||
| 2013—2019 | 0.130 | 0.361 | 0.175 | 0.980 | 0.348 | 0.012 | 0.017 | 0.120 | ||
| 整体 | 城市化水平X5 | 0.320 | 0.430 | 0.905 | 0.780 | 金融发展 水平X12 | 0.043 | 0.045 | 0.286 | 0.438 |
| 2001—2012 | 0.370 | 0.374 | 0.915 | 0.665 | 0.045 | 0.038 | 0.353 | 0.289 | ||
| 2013—2019 | 0.235 | 0.527 | 0.888 | 0.978 | 0.039 | 0.059 | 0.173 | 0.692 | ||
| 整体 | 能源强度X6 | 0.109 | 0.093 | 0.306 | 0.719 | 信息基础设施水平X13 | 0.219 | 0.085 | 0.353 | 0.691 |
| 2001—2012 | 0.045 | 0.079 | 0.327 | 0.607 | 0.231 | 0.068 | 0.301 | 0.581 | ||
| 2013—2019 | 0.220 | 0.118 | 0.270 | 0.910 | 0.200 | 0.113 | 0.443 | 0.878 | ||
| 整体 | 政府支持X7 | 0.189 | 0.066 | 0.117 | 0.579 | |||||
| 2001—2012 | 0.116 | 0.073 | 0.073 | 0.373 | ||||||
| 2013—2019 | 0.315 | 0.053 | 0.191 | 0.931 |
| [1] |
王洪涛. 中国西部地区农村反贫困问题研究. 北京: 中央民族大学, 2013.
[
|
| [2] |
刘纪远, 邓祥征, 刘卫东, 等. 中国西部绿色发展概念框架. 中国人口·资源与环境, 2013, 23(10): 1-7.
[
|
| [3] |
车磊, 白永平, 周亮, 等. 中国绿色发展效率的空间特征及溢出分析. 地理科学, 2018, 38(11): 1788-1798.
[
|
| [4] |
钱争鸣, 刘晓晨. 中国绿色经济效率的区域差异与影响因素分析. 中国人口·资源与环境, 2013, 23(7): 104 - 109.
[
|
| [5] |
|
| [6] |
吴延兵. 用DEA方法评测知识生产中的技术效率与技术进步. 数量经济技术经济研究, 2008, 25(7): 67-79.
[
|
| [7] |
刘杨, 杨建梁, 梁媛. 中国城市群绿色发展效率评价及均衡特征. 经济地理, 2019, 39(2): 110-117.
[
|
| [8] |
赵金凯, 杨万平. 中国各地区绿色发展效率测算. 统计与决策, 2017, (24): 115-120.
[
|
| [9] |
黄杰. 中国绿色发展效率的区域差异及动态演进. 地域研究与开发, 2018, 37(4): 13-18.
[
|
| [10] |
郭付友, 佟连军, 仇方道, 等. 鲁南经济带城乡绿色发展效率时空分异及驱动因素识别. 自然资源学报, 2020, 35(8): 1972-1985.
[
|
| [11] |
林晓, 徐伟, 杨凡, 等. 东北老工业基地绿色经济效率的时空演变及影响机制: 以辽宁省为例. 经济地理, 2017, 37(5): 125-132.
[
|
| [12] |
吴传清, 宋筱筱. 长江经济带城市绿色发展影响因素及效率评估. 学习与实践, 2018, (4): 8-13.
[
|
| [13] |
黄建欢, 吕海龙, 王良健. 金融发展影响区域绿色发展的机理: 基于生态效率和空间计量的研究. 地理研究, 2014, 33(3): 532-545.
[
|
| [14] |
杨志江, 文超祥. 中国绿色发展效率的评价与区域差异. 经济地理, 2017, 37(3): 10-18.
[
|
| [15] |
张文博, 邓玲, 尹传斌. “一带一路”主要节点城市的绿色经济效率评价及影响因素分析. 经济问题探索, 2017, (11): 84-90.
[
|
| [16] |
朴胜任, 李健. 基于超效率DEA模型的中国区域环境效率时空差异研究. 干旱区资源与环境, 2018, 32(4): 1-6.
[
|
| [17] |
周亮, 车磊, 周成虎. 中国城市绿色发展效率时空演变特征及影响因素. 地理学报, 2019, 74(10): 2027-2044.
[
|
| [18] |
辛龙, 孙慧, 王慧, 等. 基于地理探测器的绿色经济效率时空分异及驱动力研究. 中国人口·资源与环境, 2020, 30(9): 128-138.
[
|
| [19] |
林志炳, 陈志注. 工业结构绿色化对绿色经济效率的影响研究. 电子科技大学学报: 社科版, 2021, 23(1): 19-26.
[
|
| [20] |
方杏村, 田淑英, 王晓玲. 财政分权、产业集聚与绿色经济效率. 经济问题探索, 2019, (11): 164-172.
[
|
| [21] |
|
| [22] |
陈明华, 刘文斐, 王山, 等. 长江经济带城市生态效率的时空分异及其驱动因素. 中国人口资源与环境, 2020, 30(9): 121-127.
[
|
| [23] |
陈秋星, 陈少晖. 中国城镇基本养老保险支付能力区域差异与影响因素: 基于泰尔指数多指标测度和省际面板数据的实证研究. 湖北经济学院学报, 2021, 19(3): 39-48, 127.
[
|
| [24] |
陈明华, 仲崇阳, 张晓萌. 中国人口老龄化的区域差异与极化趋势: 1995—2014. 数量经济技术经济研究, 2018, (10): 111-125.
[
|
| [25] |
王劲峰, 徐成东. 地理探测器: 原理与展望. 地理学报, 2017, 72(1): 116-134.
[
|
| [26] |
阎晓, 涂建军. 黄河流域资源型城市生态效率时空演变及驱动因素. 自然资源学报, 2021, 36(1): 223-239.
[
|
| [27] |
王晓楠, 孙威. 黄河流域资源型城市转型效率及其影响因素. 地理科学进展, 2020, 39(10): 1643-1655.
[
|
| [28] |
崔丹, 卜晓燕, 徐祯, 等. 中国资源型城市高质量发展综合评估及影响机理. 地理学报, 2021, 76(10): 2489-2503.
[
|
/
| 〈 |
|
〉 |


