 PDF(4780 KB)

基于“三生”功能的西藏自治区水资源承载力系统耦合关系
刘庆芳, 王小坤, 朱青, 宋金平, 闫秋宇, 赵育
自然资源学报 ›› 2023, Vol. 38 ›› Issue (6) : 1618-1631.
PDF(4780 KB)
PDF(4780 KB)
基于“三生”功能的西藏自治区水资源承载力系统耦合关系
Coupling relationship of water resources carrying capacity system in Tibet Autonomous Region based on "production-living-ecological" function
 ({{custom_author.role_en}}), {{javascript:window.custom_author_en_index++;}}
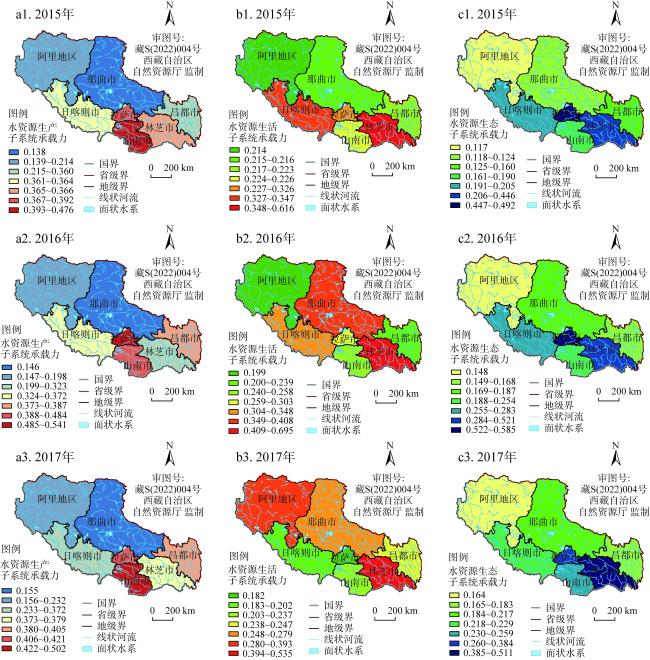
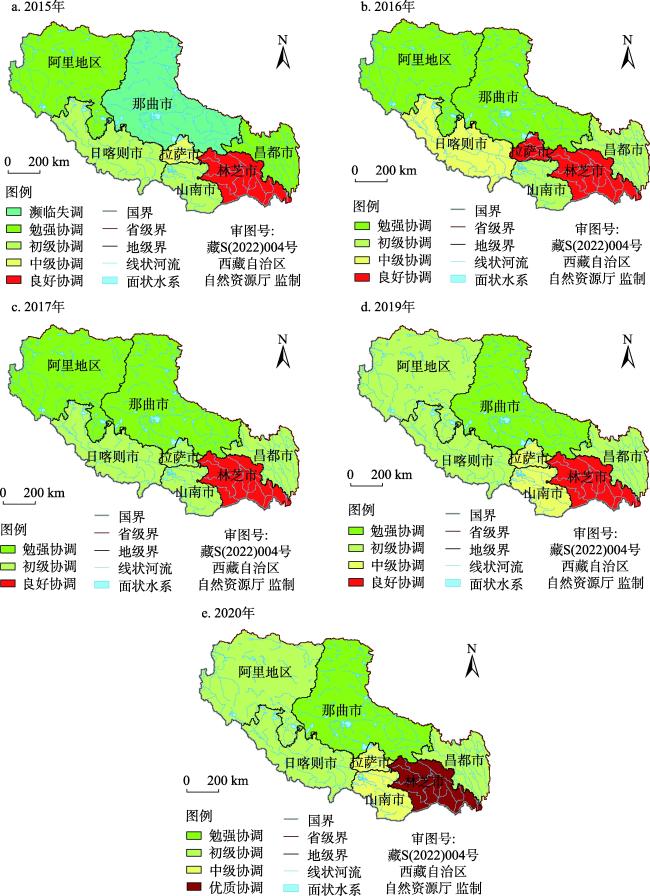
基于PSR模型,从“三生”功能出发,实证评价西藏自治区水资源承载力,并采用耦合协调模型进一步探析水资源承载力“三生”子系统间的耦合协调关系。结果表明:(1)研究期内,西藏的水资源承载力偏低,总体呈现出波动上升的演化态势,但存在显著的空间异质性。(2)水资源“三生”子系统承载力差异显著,生产、生活和生态子系统的承载力均呈现提升态势;生产和生态子系统的承载力在空间上表现出“东高西低”的分布特征,生活子系统承载力则呈现“中部强于四周”的交替式分布规律。(3)西藏水资源承载力子系统处于较高水平耦合状态,水资源承载力子系统耦合协调度呈现出“藏东南高于藏西北,林芝市显著优于其他地市”的空间分布特征。
The total water resources in Tibet Autonomous Region are abundant but unevenly distributed in space and time, which makes it difficult for water resources to support the efficient and sustainable development of local production, life and ecology. Combined with the actual situation of Tibet and based on the PSR model framework, the water resources carrying capacity of the region was empirically evaluated from the perspective of the "production-living-ecological" function, and the coupling coordination relationship among the subsystems of the "production-living-ecological" function in water resources carrying capacity was further explored by adopting the coupling coordination model. The results show that: (1) From 2015 to 2020, the water resources carrying capacity in Tibet was relatively low, showing a fluctuating and rising evolutionary trend in general, which, however, presented significant spatial heterogeneity. (2) The carrying capacity of the "production-living-ecological" subsystems of water resources varied significantly, with the carrying capacity of the production, living and ecological subsystems all showing an increase. The carrying capacity of the production and ecological subsystems presented the spatial pattern of "high in the east and low in the west", while the carrying capacity of the living subsystem showed the alternating characteristics of "stronger in the middle than in the periphery". (3) The subsystems of water resources carrying capacity in Tibet was in a relatively high-level coupling state, and those of the coupling coordination degree presented the spatial pattern of "Southeast Tibet was higher than Northwest, and Nyingchi was significantly better than other cities". In view of the low comprehensive level of water resources carrying capacity in Tibet and the low coordination degree of subsystems of water resources carrying capacity in Northwest Tibet, it is suggested to relocate from other places, adjust the industrial structure, strengthen the construction of municipal water conservancy facilities and improve the system of farmland water conservancy projects, so as to improve the comprehensive level of water resources carrying capacity in the whole region and the coupling coordination degree among the "production-living-ecological" subsystems of water resources carrying capacity in Northwest Tibet.
水资源承载力 / “三生”功能 / PSR模型 / 耦合协调度 / 西藏自治区 {{custom_keyword}} /
water resources carrying capacity / "production-living-ecological" function / PSR model / coupling coordination degree / Tibet Autonomous Region {{custom_keyword}} /
表1 西藏水资源承载力“三生”子系统耦合协调发展阶段划分Table 1 Division of the coupling coordinated development stages of the "production-living-ecological" subsystem of water resources carrying capacity in Tibet |
| 水平分类 | 耦合协调等级 | 耦合协调度 | 特征 |
|---|---|---|---|
| 失调衰退阶段 | 失调 | 0≤ D<0.4 | 区域水资源承载力“三生”功能间无法相互促进,出现相互制约的情况,水资源承载力“三生”子系统间处于失调状态 |
| 起步阶段 | 濒临失调 | 0.4≤ D<0.5 | 区域水资源承载力逐渐走向兼顾各子系统综合发展的道路,三者存在相互促进的趋势 |
| 勉强协调 | 0.5≤ D<0.6 | ||
| 稳定阶段 | 初级协调 | 0.6≤ D<0.7 | 区域水资源承载力“三生”子系统之间存在明显的协调状态,三者相互促进,薄弱处逐渐补齐,发展成效开始凸显,水资源承载力“三生”子系统之间进入磨合阶段 |
| 中级协调 | 0.7≤ D<0.8 | ||
| 成熟阶段 | 良好协调 | 0.8≤ D<0.9 | 区域水资源承载力“三生”子系统之间存在良好的协调发展状况,三者相辅相成,系统进入高度协调阶段,迈向高质量发展 |
| 优质协调 | 0.9≤ D ≤1 |
表2 西藏水资源承载力评价指标体系Table 2 Evaluation index system of water resources carrying capacity in Tibet |
| 子系统 | 准则层 | 指标层(性质) | 取值范围 | 指标权重 | 系统权重 |
|---|---|---|---|---|---|
| 生产 | 压力(P) | 农业用水量/亿m3(-) | 0.646~11.447 | 0.012 | 0.285 |
| 工业用水量/亿m3(-) | 0.017~0.916 | 0.011 | |||
| 人均GDP/万元(+) | 1.872~8.009 | 0.028 | |||
| 状态(S) | 万元GDP用水量/m3(-) | 86.086~730.117 | 0.006 | ||
| 供水能力/亿m3(+) | 0.684~11.429 | 0.040 | |||
| 农田有效灌溉率/%(+) | 0~95.500 | 0.019 | |||
| 响应(R) | 第一产业占GDP比例/%(-) | 3.253~17.836 | 0.023 | ||
| 第二产业占GDP比例/%(+) | 23.952~53.626 | 0.017 | |||
| 农用水泵/台(+) | 0~504 | 0.074 | |||
| 农村小型水电站个数/个(+) | 0~132 | 0.057 | |||
| 生活 | 压力(P) | 居民生活用水量/亿m3(-) | 0.017~0.709 | 0.010 | 0.208 |
| 人均日生活用水量/L(-) | 71.320~843.630 | 0.005 | |||
| 人口密度/(人/km2)(+) | 821~7154 | 0.023 | |||
| 状态(S) | 人均占有水资源量/万m3(+) | 0.8~140.800 | 0.091 | ||
| 供水普及率/%(+) | 30.510~100 | 0.005 | |||
| 漏损水量/万m3(-) | 0~2638 | 0.006 | |||
| 响应(R) | 绿地面积/m2(+) | 0~547 | 0.049 | ||
| 第三产业占GDP比例/%(+) | 41.194~62.375 | 0.019 | |||
| 生态 | 压力(P) | 年降水量/mm(+) | 136.6~2780.72 | 0.054 | 0.507 |
| 污水排放量/万m3(-) | 10~10353 | 0.005 | |||
| 化肥施用量/t(-) | 0~23068 | 0.012 | |||
| 农用塑料薄膜使用量/t(-) | 0~1055 | 0.011 | |||
| 状态(S) | 水资源总量/亿m3(+) | 65.22~2524.69 | 0.063 | ||
| 产水模数/(万m3/km2)(+) | 3~221.500 | 0.062 | |||
| 污水处理率/%(+) | 0~97.65 | 0.017 0.019 | |||
| 森林覆盖率/%(+) | 0.120~47.660 | ||||
| 响应(R) | 雨水管道长度/km(+) | 0~165 | 0.077 | ||
| 雨污合流管道长度/km(+) | 0~552 | 0.103 | |||
| 污水处理总量/万m3(+) | 0~6215 | 0.074 | |||
| 城镇环境用水量/万m3(+) | 0~0.227 | 0.008 |
表3 西藏各地市水资源承载力综合评价指数Table 3 Comprehensive evaluation index of water resources carrying capacity of each city in Tibet |
| 年份 | 拉萨 | 日喀则 | 昌都 | 林芝 | 山南 | 那曲 | 阿里 |
|---|---|---|---|---|---|---|---|
| 2015 | 0.429 中等水平 | 0.281 较低水平 | 0.231 较低水平 | 0.459 中等水平 | 0.280 较低水平 | 0.147 低水平 | 0.165 低水平 |
| 2016 | 0.514 中等水平 | 0.323 较低水平 | 0.246 较低水平 | 0.502 中等水平 | 0.321 较低水平 | 0.222 较低水平 | 0.174 低水平 |
| 2017 | 0.349 较低水平 | 0.266 较低水平 | 0.260 较低水平 | 0.515 中等水平 | 0.323 较低水平 | 0.209 较低水平 | 0.212 较低水平 |
| 2019 | 0.384 较低水平 | 0.276 较低水平 | 0.281 较低水平 | 0.524 中等水平 | 0.389 中等水平 | 0.223 较低水平 | 0.233 较低水平 |
| 2020 | 0.409 中等水平 | 0.285 较低水平 | 0.293 较低水平 | 0.560 中等水平 | 0.380 较低水平 | 0.213 较低水平 | 0.229 较低水平 |
表4 西藏水资源承载力“三生”子系统耦合度指数Table 4 Coupling degree index of "production-living-ecological" subsystem of water resources carrying capaity in Tibet |
| 年份 | 拉萨 | 日喀则 | 昌都 | 林芝 | 山南 | 那曲 | 阿里 |
|---|---|---|---|---|---|---|---|
| 2015 | 0.986 | 0.969 | 0.946 | 0.977 | 0.920 | 0.971 | 0.963 |
| 2016 | 0.961 | 0.993 | 0.944 | 0.954 | 0.954 | 0.905 | 0.991 |
| 2017 | 0.924 | 0.966 | 0.947 | 0.968 | 0.940 | 0.978 | 0.971 |
| 2019 | 0.991 | 0.975 | 0.952 | 0.977 | 0.904 | 0.922 | 0.968 |
| 2020 | 0.998 | 0.968 | 0.949 | 0.990 | 0.863 | 0.974 | 0.969 |
表5 西藏水资源承载力“三生”子系统耦合协调度Table 5 The coupling coordination degree of the "production-living-ecological" subsystem of water resources carrying capacity in Tibet |
| 年份 | 拉萨 | 日喀则 | 昌都 | 林芝 | 山南 | 那曲 | 阿里 |
|---|---|---|---|---|---|---|---|
| 2015 | 0.773 | 0.667 | 0.593 | 0.835 | 0.641 | 0.482 | 0.513 |
| 2016 | 0.829 | 0.706 | 0.613 | 0.857 | 0.690 | 0.580 | 0.521 |
| 2017 | 0.670 | 0.625 | 0.628 | 0.879 | 0.683 | 0.557 | 0.581 |
| 2019 | 0.744 | 0.649 | 0.657 | 0.894 | 0.736 | 0.585 | 0.609 |
| 2020 | 0.778 | 0.656 | 0.669 | 0.932 | 0.706 | 0.573 | 0.602 |
| [1] |
郭海丹. 水资源承载能力基础理论及实证研究. 北京: 中国地质大学(北京), 2009.
[
{{custom_citation.content}}
{{custom_citation.annotation}}
|
| [2] |
{{custom_citation.content}}
{{custom_citation.annotation}}
|
| [3] |
{{custom_citation.content}}
{{custom_citation.annotation}}
|
| [4] |
{{custom_citation.content}}
{{custom_citation.annotation}}
|
| [5] |
{{custom_citation.content}}
{{custom_citation.annotation}}
|
| [6] |
{{custom_citation.content}}
{{custom_citation.annotation}}
|
| [7] |
{{custom_citation.content}}
{{custom_citation.annotation}}
|
| [8] |
许有鹏. 干旱区水资源承载能力综合评价研究: 以新疆和田河流域为例. 自然资源学报, 1993, 8(3): 229-237.
[
{{custom_citation.content}}
{{custom_citation.annotation}}
|
| [9] |
阮本青, 沈晋. 区域水资源适度承载能力计算模型研究. 土壤侵蚀与水土保持学报, 1998, 4(3): 58-62, 86.
[
{{custom_citation.content}}
{{custom_citation.annotation}}
|
| [10] |
夏军, 朱一中. 水资源安全的度量: 水资源承载力的研究与挑战. 自然资源学报, 2002, 17(3): 262-269.
[
{{custom_citation.content}}
{{custom_citation.annotation}}
|
| [11] |
李燕, 张兴奇. 基于主成分分析的长江经济带水资源承载力评价. 水土保持通报, 2017, 37(4): 172-178.
[
{{custom_citation.content}}
{{custom_citation.annotation}}
|
| [12] |
张琦, 李松森, 夏慧琳. 基于模糊综合评判模型的东北三省水资源承载力研究. 水土保持通报, 2019, 39(5): 179-188, 193.
[
{{custom_citation.content}}
{{custom_citation.annotation}}
|
| [13] |
潘思成, 崔东文. 新型萤火虫算法—投影寻踪模型在区域人水和谐评价中的应用. 水资源与水工程学报, 2020, 31(1): 124-130.
[
{{custom_citation.content}}
{{custom_citation.annotation}}
|
| [14] |
高玉琴, 李媛媛, 高见, 等. 虚拟水影响下区域水资源承载力评价. 水利水电科技进展, 2022, 42(5): 22-27, 77.
[
{{custom_citation.content}}
{{custom_citation.annotation}}
|
| [15] |
李玲, 潘雪倩, 夏威夷, 等. 基于SD模型的重庆市水资源承载力模拟分析. 中国农村水利水电, 2018, (5): 128-133.
以系统动力学理论为基础,借助 vensim 软件建立重庆市水资源承载力模型,设计现状延续型、经济发展型、节水型 3 种情景,模拟 2016-2025 年重庆市水资源承载力。运行结果显示,节水型虽未能达到水资源平衡,但可将供需比保持在 0.8 以上,节水效果很显著;生活用水量随人口增加而逐年增加,降低人均生活用水量的节水效果并不显著;降低万元工业增加值用水量,第二产业需水量保持在 30~ 40 亿 m3,节水效果非常显著。
[
{{custom_citation.content}}
{{custom_citation.annotation}}
|
| [16] |
郑奕, 魏文寿, 崔彩霞. 新疆焉耆盆地水资源承载力研究. 中国人口·资源与环境, 2010, 20(11): 60-65.
[
{{custom_citation.content}}
{{custom_citation.annotation}}
|
| [17] |
张妍, 郭萍, 张帆, 等. 基于评价的水资源优化模型适用性比较. 排灌机械工程学报, 2019, 37(2): 154-159.
[
{{custom_citation.content}}
{{custom_citation.annotation}}
|
| [18] |
贾建辉, 龙晓君. 水资源承载力预测模型研究. 水利水电技术, 2018, 49(10): 21-27.
[
{{custom_citation.content}}
{{custom_citation.annotation}}
|
| [19] |
王煜, 杨立彬, 张新海, 等. 西北地区水资源可利用量及承载能力分析. 人民黄河, 2002, 24(6): 10-12.
[
{{custom_citation.content}}
{{custom_citation.annotation}}
|
| [20] |
梁春玲. 区域水资源承载力评价方法研究. 河南科技, 2011, (16): 7-8.
[
{{custom_citation.content}}
{{custom_citation.annotation}}
|
| [21] |
张荣天, 张小林, 尹鹏. 长江经济带市域土地资源承载力时空分异与影响因素探析. 经济地理, 2022, 42(5): 185-192.
[
{{custom_citation.content}}
{{custom_citation.annotation}}
|
| [22] |
余灏哲, 李丽娟, 李九一. 京津冀水资源承载力风险评估模型构建研究. 地理研究, 2021, 40(9): 2623-2637.
本文聚焦国家重要战略区——京津冀地区需水压力增大、水资源超载等问题,基于水资源承载力理论,将风险评估引入水资源承载系统,探索建构水资源承载力风险的概念内涵、因子识别与评估模型等理论体系,综合考虑气候变化、城镇化与产业结构变动等影响水资源承载系统的关键因子,利用多种计量经济模型、遥感反演模型与地理信息技术等分别开展水资源承载力危险性、脆弱性与暴露性实证评估研究,旨在客观反映未来京津冀水资源承载状态特征与风险演变规律。结果表明:① 未来京津冀水资源承载力危险性指数平均值为0.531,属中危险等级,其中人口增长与城镇化危险性等级(平均值为0.682,高危险)最高,其次为气候变化危险性(0.471,中危险)与经济与产业发展危险性(0.254,弱危险)。② 未来京津冀水资源承载力脆弱性程度呈升高趋势,脆弱性指数平均值为0.726,属高脆弱等级。③ 未来京津冀水资源承载力暴露性指数平均值为0.483,属于中暴露等级,并呈增强趋势,其中2035年暴露性最强。④ 未来2025年、2030年、2035年京津冀水资源承载力风险综合指数平均值较2016年分别增加了9.3%、11.5%、13.9%,高风险等级城市数量由2016年的3个增加到2035年的9个,高风险城市主要集中在北京及冀中南等地,由此表明未来京津冀水资源承载力风险程度持续加剧,水资源承载系统受风险扰动强烈。
[
Focusing on issues of increasing pressure of water demand and water overload in Beijing-Tianjin-Hebei region, an important national strategic area, and based on the theory of water resources carrying capacity, the risk assessment was introduced into water resources carrying system, and the theoretical systems of water resources carrying capacity risk were explored such as the concept and connotation, factor identification and evaluation models. Considering the key factors such as climate change, urbanization and industrial structure changes that affect the water resources carrying system, the hazard, vulnerability and exposure assessment models of water resources carrying capacity risk were constructed by using the metrological geography methods, remotely sensed retrieval model and geographic information technology. This study aims to objectively reflect the future characteristics of water resources carrying status and the law of risk evolution in Beijing-Tianjin-Hebei region. The results show that: (1) The future average value of the comprehensive hazard index in the study region is 0.53, which belongs to the middle risk level, with the risk level of population growth and urbanization being the highest in the future (0.68, high risk), followed by climate change risk (0.47, medium risk) and economic and industrial development risk (0.25, weak risk). (2) In the future, the vulnerability degree is increasing, and the average vulnerability index is 0.72, which belongs to high vulnerability level. (3) In the future, the average exposure index is 0.48, which belongs to the middle exposure level and shows an increasing trend, of which the overall exposure of the study area is the strongest in 2035. (4) In the years of 2025, 2030 and 2035, the average value of water resources carrying capacity risk index will increase by 9.3%, 11.5% and 13.9% compared with 2016 in this region. The number of high-risk cities will increase from 3 in 2016 to 9 in 2035, which shows that in the future, the risk degree of water resources carrying will increase, the risk disturbance of water resources carrying system will be strong, and the possibility of water resources overloading will increase, especially in Beijing and southern Hebei. {{custom_citation.content}}
{{custom_citation.annotation}}
|
| [23] |
岳启蒙, 文倩, 贺奕, 等. 水生态文明城市建设对城市水生态承载力的影响: 以武汉市为例. 生态学报, 2021, 41(14): 5586-5597.
[
{{custom_citation.content}}
{{custom_citation.annotation}}
|
| [24] |
何伟, 陈素雪, 仇泸毅. 长江三峡生态经济走廊地区水资源承载力的综合评价及时空演变研究. 长江流域资源与环境, 2022, 31(6): 1208-1219.
[
{{custom_citation.content}}
{{custom_citation.annotation}}
|
| [25] |
张羽, 左其亭, 曹宏斌, 等. 沁蟒河流域水资源生态足迹时空变化特征及均衡性分析. 水资源与水工程学报, 2022, 33(3): 50-57.
[
{{custom_citation.content}}
{{custom_citation.annotation}}
|
| [26] |
刘庆芳, 宋金平. 青藏高原县域人口与公共服务适配性与优化策略. 经济地理, 2022, 42(10): 43-51.
[
{{custom_citation.content}}
{{custom_citation.annotation}}
|
| [27] |
王勇, 孙瑞欣. 土地利用变化对区域水—能源—粮食系统耦合协调度的影响: 以京津冀城市群为研究对象. 自然资源学报, 2022, 37(3): 582-599.
将土地因素引入水—能源—粮食系统,运用耦合协调模型对京津冀城市群2005— 2018年水—能源—粮食—土地系统的时空变化特征进行研究。结果表明:(1)从空间尺度上来看,京津冀城市群建设用地由中心向四周扩散;从京津冀城市群土地利用格局来看,耕地和建设用地面积分别呈现较为明显的下降和增长趋势。(2)将土地纳入水—能源—粮食系统降低了京津冀城市群大多数城市水—能源—粮食系统间的耦合度和耦合协调度。(3)土地与水—能源—粮食子系统组成的两要素系统的协调水平会进行叠加或抵消进而影响水—能源—粮食—土地系统耦合协调度。本文的研究启示在于:京津冀城市群在考虑水、能源、粮食协调发展的同时,应考虑土地对水—能源—粮食系统整体及内部子系统的影响,根据城市自身资源优势合理配置资源、优化产业布局以实现可持续发展。
[
In this paper, the land factor is introduced into the water-energy-food system, and the coupling coordination model is used to study the spatio-temporal change characteristics of the water-energy-food-land system in the Beijing-Tianjin-Hebei Urban Agglomeration from 2004 to 2017. The results show that: (1) On the spatial scale, the construction land of the study area diffuses from the center to the periphery. In terms of land use pattern of the urban agglomeration, the area of cultivated land and construction land showed a relatively obvious decline and growth trend, respectively. (2) The integration of land into the water-energy-food system reduces the coupling degree and co-scheduling of water-energy-food systems in most cities of this urban agglomeration. (3) The coordination level of land and water-energy-food subsystem will be superimposed or offset, which will affect the coupling coordination of water-energy-food-land system. The research enlightenment of this paper is that considering the coordinated development of water, energy and grain, the Beijing-Tianjin-Hebei Urban Agglomeration should understand the impact of land on the whole and internal subsystems of the water-energy-food system, allocate resources reasonably and optimize the industrial layout according to the city's own resource advantages, so as to achieve sustainable development. {{custom_citation.content}}
{{custom_citation.annotation}}
|
| [28] |
刘佳骏, 董锁成, 李泽红. 中国水资源承载力综合评价研究. 自然资源学报, 2011, 26(2): 258-269.
[
{{custom_citation.content}}
{{custom_citation.annotation}}
|
| [29] |
戴明宏, 王腊春, 魏兴萍. 基于熵权的模糊综合评价模型的广西水资源承载力空间分异研究. 水土保持研究, 2016, 23(1): 193-199.
[
{{custom_citation.content}}
{{custom_citation.annotation}}
|
| [30] |
刘雅玲, 罗雅谦, 张文静, 等. 基于压力—状态—响应模型的城市水资源承载力评价指标体系构建研究. 环境污染与防治, 2016, 38(5): 100-104.
[
{{custom_citation.content}}
{{custom_citation.annotation}}
|
| [31] |
杨海峰, 翟国方. 灾害风险视角下的城市安全评估及其驱动机制分析: 以滁州市中心城区为例. 自然资源学报, 2021, 36(9): 2368-2381.
全球自然灾害以及城市化进程中的人为灾害频发,严重制约着城市的生存和安全发展。以典型的灾害多发地区滁州市中心城区为例,基于压力—状态—响应(Pressure-State-Response,PSR)概念框架,构建了各单灾种风险评价指标体系,利用耦合激励模型复合单灾种风险评估结果,定量测度了研究区的城市安全风险分布特征,并运用地理探测器对城市安全风险进行了驱动机制分析。结果表明:(1)研究区的城市安全风险等级占比从低到高分别为2.49%、8.71%、41.08%、30.47%和17.25%,以中风险占主导。在空间上,城市安全风险表现为中部高于周围边缘区域,呈现出由核心区往外逐步减弱的格局特征。(2)6个驱动因子对城市安全风险的解释力强度为人口密度(0.404)>地均GDP(0.402)>建筑承灾能力(0.095)>植被覆盖度(0.078)>路网密度(0.013)>用地类型风险(0.012),因子交互协同作用后对结果的解释力增强。研究结果为城市安全风险评估提供了新的理论视角与研究框架,能够服务于高风险区域的灾害风险管理。
[
{{custom_citation.content}}
{{custom_citation.annotation}}
|
| [32] |
王晶, 胡贵隆, 张良. 京津冀地区水资源承载力评价与预测. 中国农村水利水电, 2022, (3): 69-74.
研究区域水资源承载力是实现区域可持续发展的重要保障。以京津冀地区为研究对象,选取16个评价指标,从系统的角度将指标分为社会-经济-生态-水资源4个子系统;然后根据最小信息熵原理将熵权法、CRITIC法和变异系数法确定的权重进行耦合,构建目标函数通过遗传算法找到最优的组合权重并计算综合得分;在此基础上,通过BP神经网络训练模型并预测未来京津冀水资源承载力趋势。结果表明,京津冀地区水资源承载力一开始处于低水平但有上升趋势、中期抖动下降处于低水平、近年呈上升趋势,通过预测京津冀地区水资源承载力将处于高水平并达到稳态。
[
Studying the carrying capacity of regional water resources is an important guarantee for realizing regional sustainable development. Taking the Beijing-Tianjin-Hebei region as the research object, this paper selects 16 evaluation indicators and divides the indicators into four sub-systems: society-economy-ecology-water resources from the perspective of the system. Then according to the principle of minimum information entropy, the entropy method, CRITIC method and mutation, the weights determined by the coefficient method are coupled, and the objective function is constructed to find the optimal combination weights through the genetic algorithm and calculate the comprehensive score. On this basis, the BP neural network is used to train the model and predict the future trend of the Beijing-Tianjin-Hebei water resources carrying capacity. The results show that the water resources carrying capacity of the Beijing-Tianjin-Hebei region was initially at a low level but there was an upward trend, the mid-term jitter declined at a low level, and showed an upward trend in recent years. It is predicted that the water resources carrying capacity of the Beijing-Tianjin-Hebei Region will be at a high level and reach a steady state. {{custom_citation.content}}
{{custom_citation.annotation}}
|
| [33] |
管西柯. 基于PSR模型的济南市水资源承载能力研究. 泰安: 山东农业大学, 2013.
[
{{custom_citation.content}}
{{custom_citation.annotation}}
|
| [34] |
余灏哲, 李丽娟, 李九一. 基于量—质—域—流的京津冀水资源承载力综合评价. 资源科学, 2020, 42(2): 358-371.
京津冀地区人均水资源占有量低,用水压力大,水资源问题突出,因此亟需对该地区进行水资源承载力综合评价研究,以期为水资源综合规划与高效利用、区域可持续发展等提供一定的理论基础与实践经验。为此,首先对京津冀水资源利用情况进行分析,提出了京津冀水资源所面临的问题,以问题为导向;其次对水资源承载系统进行解析,构建基于量-质-域-流内涵的京津冀水资源承载力综合评价指标体系;最后利用AHP、熵权法对评价指标进行主客观组合赋权,借助TOPSIS评价模型对水资源承载力进行综合得分计算。结果表明:①京津冀地区水资源总量匮乏,水资源过度开发利用,地下水持续超采等已经导致该地区水生态功能退化,形成了集中连片的地下水漏斗区等;②通过对研究区水资源承载力评价计算,2006—2016年京津冀水资源承载力综合评价得分总体上呈现波动式增长态势,表明水资源承载力有所增强,但整体分值不高,水资源压力形势依然严峻。基于此,京津冀亟需构建区域、流域水资源联动机制,以京津冀协同发展为契机,针对不同地区的发展基础与城市定位,遵循“以水量城”的城镇化政策和“以水定产”的产业政策,深入贯彻最严格的水资源管理条例,实现整个区域水资源承载力的提升。
[
{{custom_citation.content}}
{{custom_citation.annotation}}
|
| {{custom_ref.label}} |
{{custom_citation.content}}
{{custom_citation.annotation}}
|


 PDF(4780 KB)
 表1 西藏水资源承载力“三生”子系统耦合协调发展阶段划分表2 西藏水资源承载力评价指标体系表3 西藏各地市水资源承载力综合评价指数
 图1 西藏水资源生产、生活和生态子系统承载力评价表4 西藏水资源承载力“三生”子系统耦合度指数表5 西藏水资源承载力“三生”子系统耦合协调度图2 2015—2020年西藏水资源承载力“三生”子系统耦合协调类型
/
| 〈 |
|
〉 |

 AI Summary

