

粮食安全是国运民生的根基,是世界和平与发展的重要保障。虽然耕地是保护粮食安全的核心载体,但伴随着全球城市化进程的加快,城市扩张导致大量耕地的流失。与此同时,耕地利用的时空格局转变也呈现出复杂的分异特征,影响国家粮食供给的稳定性[1]。尤其是中国耕地“非粮化”的问题日益凸显,对粮食安全造成较大威胁[2]。在此背景下,国家出台了一系列保护耕地、维护粮食安全的政策法规,如“耕地占补平衡”政策。大量城市中心的优质耕地随之转向城市边际土地,但有部分学者指出这种耕地的再分配会对粮食安全和可持续发展造成负面影响[3]。因此如何协调耕地保护、粮食安全与城市发展之间的矛盾,合理规划农业空间布局,提高耕地质量,已成为国家发展面临的重大挑战。
以往相关研究大多从耕地面积和耕地适宜性的角度探讨城市扩张对耕地流失的影响[4⇓-6],相对较少从粮食生产区等宏观角度分析城市发展与粮食安全的关系。一方面,中国的粮食生产功能区划定正处于初级阶段,仍较少研究探讨如何科学划定与建设粮食生产功能区[7]。合理划分粮食生产功能区,明确耕地用途对保障粮食安全具有重要意义。然而,目前国内粮食生产功能区的划定工作大多是基于永久基本农田的基础上开展的[8],在实际划定工作中,存在地方政府为了经济发展而将质量较差的耕地划入基本农田的行为;也存在规划方案制定缺乏科学依据和方法,大多依靠经验判断划定而成的局限[9]。维护国家粮食安全必须对粮食生产功能区的划定进行深入全面的研究,科学客观地推进粮食生产功能区的建设。为此,粮食生产功能区的划定可以借鉴张路等[10]提出的针对生物多样性保护的系统保护规划理念。基于系统保护理念的Marine Reserve Design using Spatially Explicit Annealing(MARXAN)模型已被广泛运用于海洋与陆地的保护体系规划和保护优先区识别[11⇓-13]。该模型综合考虑保护区的面积、边界、连通性以及社会经济成本等因素,通过模拟退火算法迭代运算得到区域内部的最佳保护方案,实现以最小成本达到保护目标的目的[14]。然而目前较少研究将该模型运用到粮食生产功能区的划定中[15]。
另一方面,虽然也有学者根据土地利用变化模型(如元胞自动机CA)模拟预测城市未来的时空格局,以此分析城市扩张对耕地的影响[16⇓⇓⇓⇓-21]。然而随着中国城市区域化进程不断加快[22],城市群之间的相互联系逐渐密切,以往大多数CA模型仅适用于分析单个城市的发展演变,较少考虑城市之间的相互流动,难以有效实现大尺度区域的城市增长模拟[23,24]。“城市流”是指城市之间人口、商品、信息、资本和技术的双向或多向交换[25]。为此,He等[26]引入城市流模型以量化城市之间空间交互作用,将其作为转换规则嵌入CA模型,用以模拟京津冀城市群的联动空间增长,证明结合城市流模型方法的合理性。但仍较少研究分析城市协同发展背景下,未来城市群扩张对优质耕地的占用情况。优质耕地是气候条件、地形条件、土壤条件和田间基础设施等均优越的耕地,是能满足多种农作物包括粮食作物生长需求的耕地,保护绝大多数优质耕地对维护区域的粮食安全具有重要意义。有学者指出在未来新增相同城市人口的前提下,发展超大城市导致的耕地损失数量更少,产量更低。以粮食安全为由遏制大城市的发展可能是无效的,甚至会导致城市发展和耕地保护的“双失败”[27]。
综上,分析城市群扩张对区域耕地保护以及粮食生产的影响,对统筹城市群内部各城市的协调发展,实现区域内的分工协作、优化配置资源、合理空间布局具有重要的实践意义。因此本文针对以往研究的不足,以中国三大城市群之一的珠三角城市群作为研究区域,利用CA模型对2030年珠三角城市群扩张情况进行模拟,分析结合城市流模型的城市群扩张模拟方法的合理性。同时,构建珠三角城市群耕地种粮成本评价指标体系,利用MARXAN模型开展区域粮食生产功能区划定,该方法划定的粮食生产功能区和粮食生产后备区的耕地破碎化程度低且农业生产条件较好,其区别在于种植粮食作物的经济成本差异。因此本文认为粮食生产功能区和粮食生产后备区都属于自然条件状况较好、适宜种植粮食作物的优质耕地。最后,对比传统城市独立发展情景下城市扩张模拟结果以及考虑城市相互作用情景下城市扩张模拟结果对此类优质耕地的侵占情况,以期为珠三角城市群的粮食生产功能区划定、区域资源配置优化和空间结构布局规划提供参考依据。
1 研究方法与数据来源
1.1 研究区概况
珠江三角洲地处广东省中南部,属亚热带海洋季风气候,水热条件好、土壤肥沃,其水稻单位面积产量在全国名列前茅。珠三角城市群包括广州、深圳、佛山、珠海、东莞、中山、惠州、肇庆、江门9个城市,涉及48个县区,总面积为55368.70 km2。其土地面积仅占广东省国土面积的23.20%,但汇集了广东省53.35%的人口和79.67%的经济总量,是中国经济最发达的地区之一。珠三角作为世界人口最多和面积最大的城市群,在人口和经济飞速发展的同时,面临着耕地资源减少、土壤污染、粮食安全等问题,识别该区域的粮食生产功能区,分析如何减少城市群发展对耕地保护和粮食安全的影响,对珠三角城市群乃至全国城市群的耕地保护规划发展具有重要意义。
1.2 研究数据
本文以珠三角城市群为研究案例,所需数据主要包括:2010年和2020年的珠三角土地利用、DEM高程数据,2010年人口密度、GDP网格数据、珠三角行政边界、交通路网以及各县区行政中心等矢量数据,2020年6月上旬MODIS EVI数据,2015年珠三角各市分部门在职人数、人口数量、GDP等社会经济数据以及2020年各县区粮食产量以及化肥、农药使用量等农业统计数据,其来源见表1。将上述不同类型的空间数据进行投影、剪裁和重采样等预处理,统一转换为500 m分辨率的栅格数据。
表1 研究所需数据及其来源
Table 1
| 数据 | 来源 | 空间分辨率 |
|---|---|---|
| 土地利用数据 | GLOBELAND30( | 30 m |
| DEM高程数据 | 地理空间数据云平台( | 30 m |
| MODIS EVI | NASA USGS( | 500 m |
| 人口密度 | Worldpop( | 100 m |
| GDP网格数据 | 中国科学院资源环境科学数据中心( | 1 km |
| 珠三角行政边界 | 国家基础地理信息中心( | — |
| 交通路网以及各县区行政中心等 | OpenStreetMap( | — |
| 各市社会经济数据 | 《广东统计年鉴》 | — |
| 各县区农业统计数据 | 《广东农村统计年鉴》 | — |
1.3 研究方法
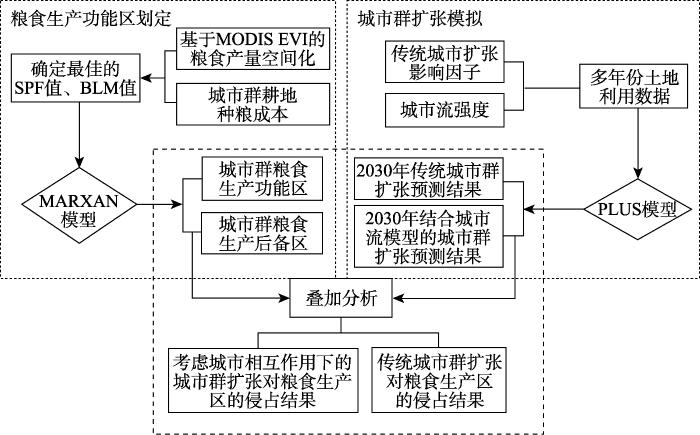
本文基于城市流理论以及Patch-generating Land Use Simulation(PLUS)模型,对比分析珠三角各城市独立发展以及各城市协同发展两种情景下城市群扩张模拟的结果与现实情况的差异。随后,基于粮食产量空间化数据与种粮成本数据,从系统保护规划的角度出发,利用MARXAN模型识别珠三角城市群的粮食生产功能区以及粮食生产后备区,并与两种不同发展情景下的2030年城市群扩张预测结果进行空间分析,探讨不同模式的城市群扩张对粮食生产区的侵占情况。技术流程如图1所示。
图1
1.3.1 基于城市相互作用的城市群扩张模拟
(1)城市流强度
城市流强度是城市外向功能量与其所产生的实际影响力之积,其作为城市群内部各个城市之间社会经济相互作用强度的有效指标,可以反映城市的经济影响力[26]。城市流强度
式中:Ni表示城市内部职能,可用从业人员人均GDP表示;Ei表示城市i的外向功能量,基于指标选取的代表性及可行性,选取城市产业从业人数作为其度量指标,其计算公式为:
式中:m表示对外的经济职能部门个数(个);Gik表示城市i第k个部门的在职人数(人);Gi表示城市i的总从业人数(人);Gk表示城市群内部第k个部门的在职人数总和(人);G为城市群总从业人数(人)。当
由于城市流强度随距离的变化会存在衰减效应[28],因此城市之间的相互作用对城市中各个元胞的影响可以表示为:
式中:
(2)基于PLUS模型的城市群扩张模拟
图2
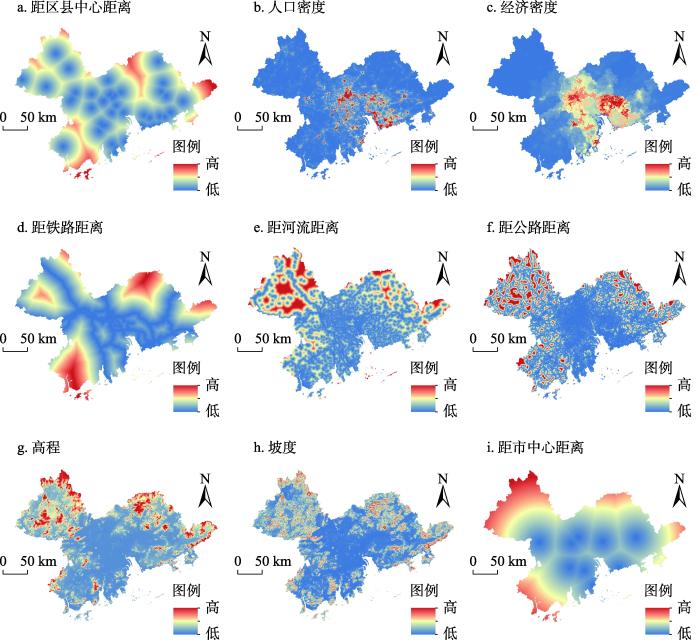
图2
土地利用变化模拟的常规影响因素
Fig. 2
Common driving factors of land use change simulation
图3
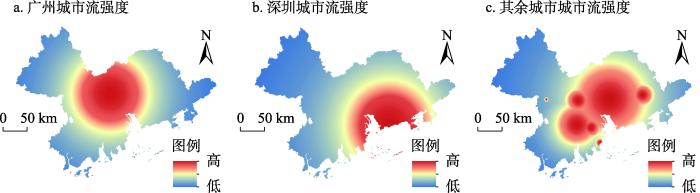
图3
广州、深圳以及其余城市的城市流强度
Fig. 3
Urban flow in Guangzhou, Shenzhen and other cities
1.3.2 基于系统保护理念的粮食生产功能区识别
(1)MARXAN模型
MARXAN是基于互补性原则和模拟退火算法的多目标系统保护规划模型,通过迭代优化运算,选出最优区划方案。其目的是在尽可能减少成本的情况下达成保护目标。该模型最早运用在海洋生态保护规划中,此后随着模型的不断改进也逐渐应用在陆地保护体系规划和保护优先区识别中。其核心目标函数如下:
式中:Score为总保护成本;Cost为单个规划单元保护成本;SPF是未达到单个保护特征的代表性目标的代价;Penalty是惩罚系数,指对未能达到保护目标的惩罚;Boundary是边界长度调节因子,用以平衡边界长度和成本支出,从而得到建设成本低且边界长度短的解决方法;BLM是修正系数,其值越小,边界长度越短,代表保护区域形状更紧凑完整。总边界较短的保护区更容易管理,成本较短。根据相关参考文献,通过对多次不同参数运算结果的敏感度分析,进一步确定合适的SPF值与最佳的BLM值[14]。
MARXAN模型运行时会将研究区域划分为一定数量的规划单元,每个规划单元包含保护对象的特定面积与单位保护成本值。本文将珠三角城市群的耕地区域作为研究对象,将其划分为43126个边长为500 m的网格规划单元。
(2)基于MODIS EVI的粮食产量空间化
根据上述思路,本文从粮食安全的角度,利用耕地规划单元去除EVI数据中非耕地的区域。然后,将珠三角各个县级行政单元的耕地EVI进行分区统计,得到每个县级单元的EVI总值,将其与各自对应的粮食产量相除,得到每个县级行政区EVI与粮食产量的关系系数。得到该系数之后,基于上述分配原则——栅格粮食产量和EVI呈正相关关系,将每一栅格的EVI值乘以系数,即可把粮食产量分配到分辨率为500 m的栅格单元。基于研究区域的粮食产量现状和国家耕地保护政策,将现阶段珠三角地区拥有粮食产出的耕地作为保护对象潜在分布范围。
(3)基于粮食安全的耕地保护成本评价
Cost值是MARXAN模型的关键参数,其可以是土地成本,也可以是基于任何成本的度量,在模型动态计算中会被加入到目标函数中。本文保护成本指标的选择将影响到粮食生产区的选址,而耕地是否适合种植粮食作物在受到自然质量条件限制的同时,更多的是受到社会经济条件的影响。因此,参考以往相关研究[38⇓⇓⇓⇓⇓-44],遵循全面性、主导性、差异性和数据可获取性等原则选取八项指标,建立珠三角耕地种植粮食作物成本的评价指标体系,具体包括:高程、坡度、田块分维度、田块连片度得分、耕地化肥评价指数、耕地农药评价指数、第一产业从业人数比、第一产业产值比。① 高程:海拔越高的区域,温度越低且交通相对闭塞,影响粮食作物生长以及耕作便利程度,种粮成本较高。② 坡度:坡度越大的耕地,水土流失、土壤侵蚀越严重,越不利于种植粮食作物。③ 田块分维度:规整的耕地易集中连片,稳定性高,不容易被建设用地侵占,种粮成本相对较低。利用景观生态学中的分维数FRAC对耕地形状复杂程度进行量化,FRAC范围在1.0~2.0,FRAC越小越规则,反之越复杂。④ 田块连片度得分:田块连片度反映耕地的空间邻近集中程度,连片度越高,越有利于农业的规模化经营,粮食种植成本越低。⑤ 耕地化肥评价指数、耕地农药评价指数:施用化肥、农药是导致村镇土地污染的重要原因,化肥和农药不合理利用会导致水资源污染浪费、生物多样性受损、土壤污染等问题。本文通过化肥和农药评价指数表示区域内部耕地的生态环境状况,生态环境越好,该区域的种粮成本越低。⑥ 第一产业从业人数比:区域内部第一产业从业人数占总从业人数比例,反映区域劳动力结构。从事第一产业的劳动力越多,种植粮食的成本越低。⑦ 第一产业产值比:区域内第一产业占总产值的比例,第一产业产值比越高,说明该区域农业经济贡献率越高,有利于农业集约化发展,种粮成本更低。基于层次分析法,运用AHP模型确定其指标权重(表2)[45⇓-47]。根据研究区域耕地种植粮食成本评价结果,采用自然断点法将其分为五个等级,在ArcGIS软件中生成粮食种植成本的点数据,使用空间连接工具将保护成本关联至各个规划单元中,形成规划单元保护成本数据。
表2 种植粮食作物成本评价指标量化赋分及其权重
Table 2
| 指标 | 1 | 2 | 3 | 4 | 5 | 权重 |
|---|---|---|---|---|---|---|
| 高程/m | <200 | 200~500 | >500 | 0.02 | ||
| 坡度/(°) | <2 | 2~6 | 6~15 | 15~25 | >25 | 0.04 |
| 耕地连片度得分 | 0.4~1 | 0.2~0.4 | 0.1~0.2 | 0.03~0.1 | 0~0.03 | 0.15 |
| 田块分维度 | <1.02 | 1.02~1.06 | 1.06~1.1 | 1.1~1.3 | >1.3 | 0.03 |
| 化肥评价指数 | 1 | 0 | 0.08 | |||
| 农药评价指数 | 1 | 0~1 | 0 | 0.13 | ||
| 第一产业从业人数比 | 0.7~1 | 0.5~0.7 | 0.3~0.5 | 0.1~0.3 | 0~0.1 | 0.33 |
| 第一产业产值占比 | 0.24~0.45 | 0.16~0.24 | 0.08~0.16 | 0.04~0.08 | 0~0.04 | 0.22 |
2 结果分析
2.1 珠三角城市输出功能量计算结果
表3 珠三角各个城市城市功能输出量(F)
Table 3
| 城市 | 广州 | 深圳 | 佛山 | 东莞 | 江门 | 惠州 | 珠海 | 肇庆 | 中山 |
|---|---|---|---|---|---|---|---|---|---|
| F | 5250.90 | 1438.38 | 259.17 | 802.95 | 444.30 | 231.11 | 99.48 | 34.25 | 207.01 |
2.2 珠三角城市群扩张模拟检验与对比分析
在充分考虑珠三角城市群内部各个城市相互作用的情况下,利用PLUS模型进行城市扩张模拟,得到珠三角地区2020年结合城市流模型的城市群扩张格局,并与2020年传统的城市扩张模拟结果、2020年实际的城市扩张情况进行对比(图4)。在珠三角整体的城市规划中,广州、深圳及其周边的地区理应获得优先增长,而离中心城市较远的地区增长速度则会较慢。但未考虑城市相互作用下的城市扩张模拟,未能突出边缘城市扩张速度较慢的特点。例如图4中所显示的肇庆市怀集县,结合城市流模型的城市扩张模拟结果更符合2020年怀集县的实际情况。因此,本文采用的结合城市流模型的城市扩张模拟方法具有合理性,且更符合城市群的实际发展趋势,能够更好地预测其内部的变化发展情况。
图4
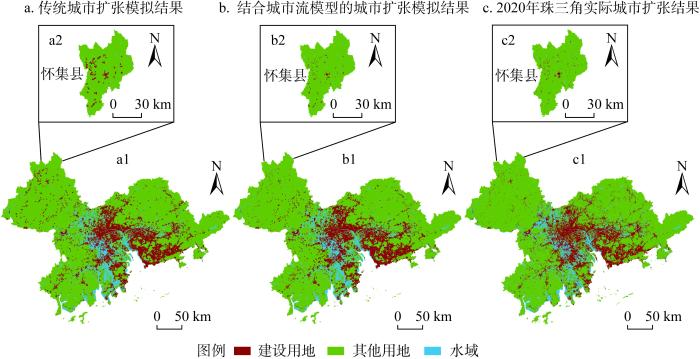
图4
2020年珠三角城市群城市扩张模拟结果对比
Fig. 4
Comparison of urban expansion simulation results in the Pearl River Delta in 2020
2.3 珠三角城市群粮食产量空间化结果
表4 珠三角各县域粮食产量分配系数
Table 4
| 县域 | 新会 | 鼎湖 | 广宁 | 高要 | 怀集 | 封开 | 德庆 | 四会 | 蓬江 |
|---|---|---|---|---|---|---|---|---|---|
| 粮食产量系数 | 717.94 | 489.56 | 398.14 | 344.32 | 306.33 | 306.17 | 273.16 | 271.80 | 244.13 |
| 县域 | 鹤山 | 惠城 | 惠东 | 惠阳 | 恩平 | 龙门 | 高朋 | 斗门 | 博罗 |
| 粮食产量系数 | 199.08 | 162.92 | 159.26 | 140.58 | 139.80 | 130.01 | 121.26 | 109.48 | 95.719 |
| 县域 | 从化 | 增城 | 中山 | 花都 | 三水 | 黄埔 | 南沙 | 东莞 | 金湾 |
| 粮食产量系数 | 68.54 | 60.47 | 37.37 | 34.38 | 30.14 | 29.72 | 29.22 | 21.98 | 18.21 |
| 县域 | 光明 | 南海 | 江海 | 番禺 | 龙岗 | 香洲 | 顺德 | 禅城 | 海珠 |
| 粮食产量系数 | 13.00 | 11.86 | 11.00 | 8.49 | 6.20 | 3.85 | 2.30 | 0 | 0 |
| 县域 | 天河 | 越秀 | 宝安 | 福田 | 龙华 | 罗湖 | 南山 | 坪山 | 盐田 |
| 粮食产量系数 | 0 | 0 | 0 | 0 | 0 | 0 | 0 | 0 | 0 |
图5
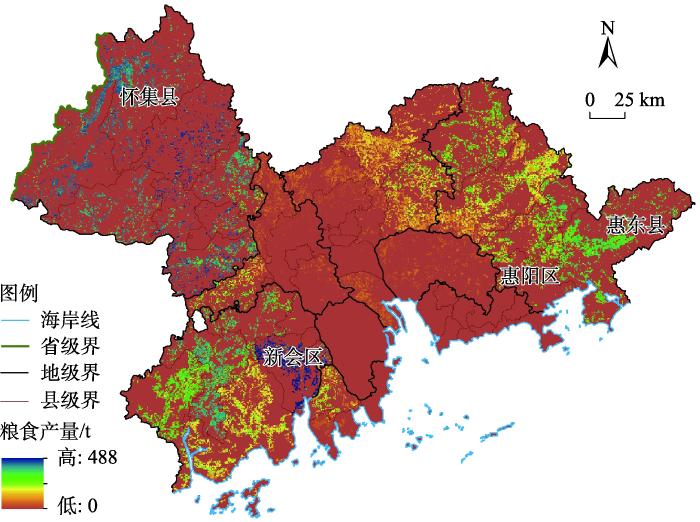
图5
2020年珠三角城市群粮食产量空间化结果
Fig. 5
Spatialization results of grain yield in the Pearl River Delta in 2020
2020年珠三角各城市的粮食产量差异明显,珠三角中部地区,如广州、深圳、东莞、佛山等城市作为改革开放的前沿阵地,城镇化率高,耕地利用多元化,耕地每单位粮食产量较低。惠州市西接广州、南连深圳,近些年在广州、深圳的辐射带动下,抓住重大历史机遇,城镇化进程加快,尤其是靠近深圳市的惠阳区,每单位耕地粮食产量明显少于较偏远的惠东县。粮食产量较高的地区主要集中在珠三角西部的江门市、肇庆市,其农业生产基础条件较好、耕地集中连片。在这两个城市内部,江门的新会区以及肇庆的怀集县耕地单位粮食产量较高,但这两个地区的粮食生产有较明显的区别。肇庆怀集县地处山区,经济发展水平较低,农业生产的地位和作用比较重要,这在一定程度上确保了该区域粮食作物的种植。而江门新会区临近中山和珠海,是珠三角地区新兴的工业城市,是江门市发展水平较高的县域,2020年GDP总值位列全市第一。但其耕地非粮化率相比该市其他地区更低,且该区内部耕地更加集中连片、粮食产量差异较小。原因在于,新会区坚持以科技为导向,提高粮食的生产效率,拥有广东省首个袁隆平院士工作站,是广东省重要的粮食产地和储备库点。
2.4 种植粮食成本及粮食生产区划定结果
本文综合考虑珠三角地区的自然条件和社会经济条件,确定其耕地种植粮食作物的成本(图6)。珠三角地区粮食种植成本呈现四周低、中间高的空间分布特征。由于经济发展水平较高的区域,能够提供更多的就业机会,农业劳动力不足,耕地地租高、破碎化程度高,因此农民种植粮食的积极性降低,更多选择种植更高经济价值的非粮作物,导致种地成本更高。
图6
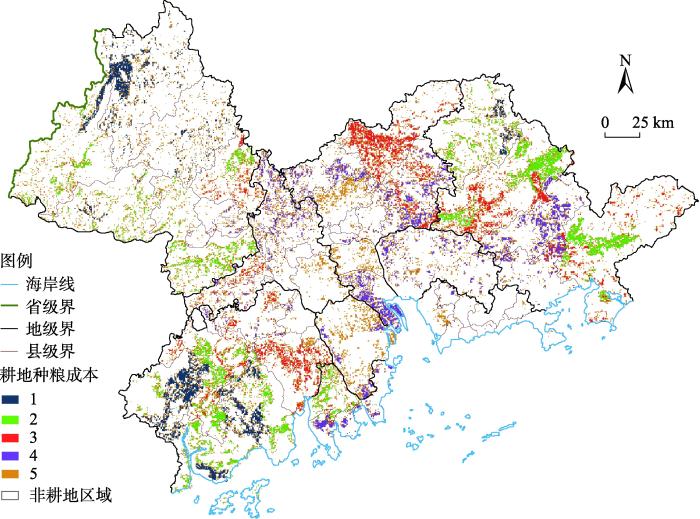
图6
珠三角城市群耕地种植粮食作物的成本
Fig. 6
The cost of farmland to grow grain crops in the Pearl River Delta
图7
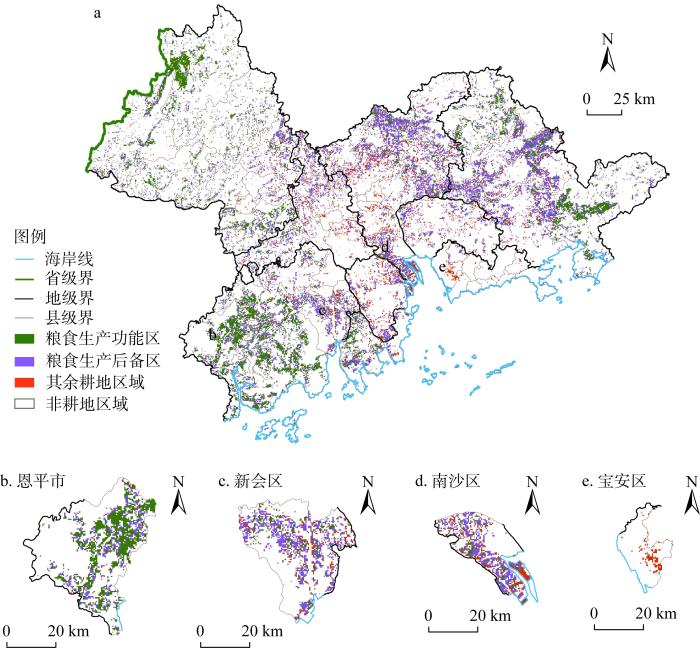
图7
珠三角粮食生产区域划定结果
Fig. 7
The demarcation result of grain production regions in the Pearl River Delta
由粮食生产区域划定结果可知,珠三角粮食生产功能区主要分布在种植粮食作物成本较低、耕地集中连片的区域(肇庆、江门及惠州南部),占珠三角地区耕地面积的34.37%(图7b)。粮食生产后备区域主要分布在农业生产基础较好、耕地破碎化程度低的小城市中心城区和大城市郊区,例如江门新会区(图7c)和广州南沙区(图7d),占珠三角耕地面积的48.89%。但由于其经济发展水平较粮食生产功能区域更高,农民种植粮食的积极性受到影响。其余区域经济发展实力强劲,土地与劳动力价格高昂,耕地难以集中连片,种植粮食成本高,约占珠三角耕地面积的16.74%,主要分布在大城市的中心区域,比如深圳宝安区(图7e)。单纯按照粮食产量的划分结果(图8)未考虑耕地的面积、边界、连通性以及区域的经济成本等因素。一方面,该划分方法将广州、深圳等地的大部分耕地划入其余区域,忽略了经济发达地区适宜种植粮食作物的耕地;另一方面,由于目前粮食产量数据只能获取到县区级,该划分方法忽略了行政区域内部耕地质量的差异,难以为后续的耕地保护及粮食功能区规划提供具有针对性的建议和措施,不利于形成差异化的非粮化治理模式。因此,本文基于系统保护理念的粮食生产功能区划定在空间规划布局上合理性较高,该结果可为城市群中耕地利用空间配置优化以及跨区域非粮化协同治理提供依据。
图8
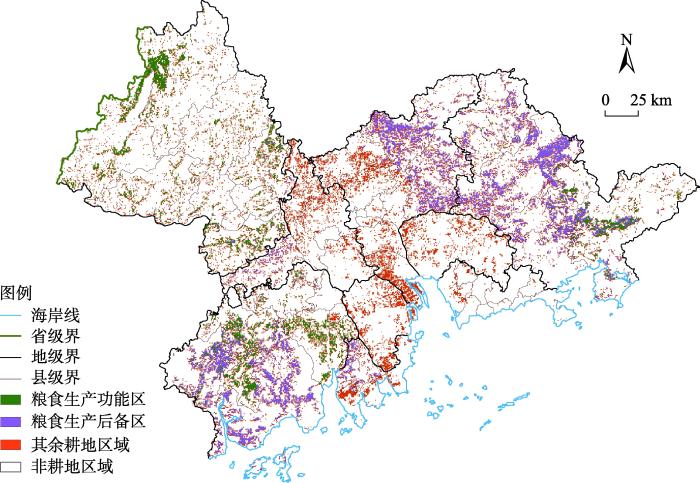
图8
珠三角粮食生产区域传统划定结果
Fig. 8
The traditional demarcation result of grain production regions in the Pearl River Delta
2.5 未来建设用地侵占粮食生产区结果对比及分析
本文将各城市协同发展情景及各城市独立发展情景的2030年珠三角城市群扩张预测结果与上述粮食生产区域划定结果进行叠加,得出两种情景下新增建设用地侵占粮食生产功能区以及粮食生产后备区的情况。在城市群各城市联动发展条件下,2030年新增建设用地侵占粮食生产功能区的面积为31575 hm2,侵占粮食生产后备区的面积为72225 hm2;而基于城市独立发展的城市扩张预测结果表明,建设用地侵占粮食生产功能区的面积为43175 hm2,侵占粮食生产后备区的面积为80275 hm2,对粮食生产区域的损害更为严重。各个城市的粮食生产区域被侵占情况如表5所示,仅深圳、佛山和珠海在城市协同发展的情况下被侵占的粮食生产区面积更大。这是由于深圳、佛山和珠海的经济发展水平较高,粮食种植成本高,建设用地扩张速度快,耕地容易被侵占。如图9所示,深圳光明区这一类经济发达地区被侵占的粮食生产区较为细碎,难以发展大规模的机械化农业,不适宜种植粮食作物;而怀集县在城市协同发展的情况下被侵占的粮食生产区面积远远小于城市独立发展情景下被侵占的面积,且在各城市独立发展的城市群扩张模拟结果中,怀集县被占用的粮食生产区较为集中连片,农业生产条件较好。
表5 2030年珠三角各城市扩张侵占粮食生产区面积
Table 5
| 城市 | 传统城市扩张结果侵占 粮食生产功能区 | 传统城市扩张结果侵占 粮食生产后备区 | 结合城市流模型的结果侵占粮食生产功能区 | 结合城市流模型的结果侵占粮食生产后备区 |
|---|---|---|---|---|
| 广州 | 6525 | 26300 | 6075 | 24025 |
| 深圳 | 50 | 325 | 50 | 475 |
| 佛山 | 1450 | 5975 | 1650 | 6300 |
| 东莞 | 1025 | 5550 | 900 | 4900 |
| 中山 | 425 | 3325 | 250 | 2650 |
| 珠海 | 1025 | 1625 | 1525 | 1625 |
| 江门 | 9300 | 9525 | 6850 | 7975 |
| 肇庆 | 12225 | 7600 | 5700 | 6800 |
| 惠州 | 11150 | 20050 | 8575 | 17475 |
图9
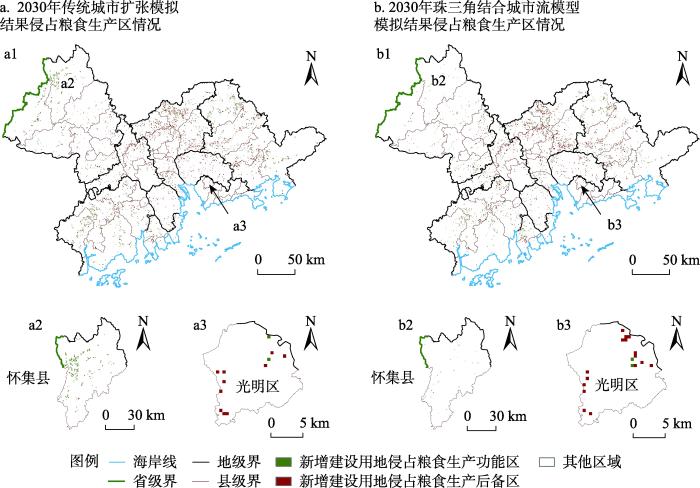
图9
2030年城市扩张预测结果侵占粮食生产区情况
Fig. 9
Predicted urban encroachment on grain production regions in 2030
由上述结果可以得出,城市群各城市协同发展的情景可以减少高质量耕地的侵占,更有利于保护粮食安全。在未来城市组团式发展的趋势下,应该充分考虑耕地的地理区位条件以及社会经济发展水平,依据区域的自然生产条件开展粮食安全保护工作以及加快农业结构调整转型,促进各个城市群乃至全国的耕地保护协同发展,减少城市扩张对耕地保护和粮食安全的负面影响。
3 结论与建议
3.1 结论
本文结合城市流理论与PLUS模型模拟2020年珠三角城市群的扩张情况,并且与传统的城市扩张预测结果、现实城市扩张情况进行验证对比,证实该方法的合理性。在此基础上,分别对城市独立发展与各城市联动发展两种情景下珠三角城市群2030年的城市扩张情况进行预测。其次,通过珠三角城市群的粮食产量空间化以及耕地种粮成本的量化,利用MARXAN模型划定粮食生产功能区以及粮食生产后备区,并将其与两种城市群扩张预测结果进行叠加分析。进而探讨在城市组团式发展的背景下,如何有效保护耕地和维护粮食安全。根据研究结果可以得到以下结论:
(1)结合城市流理论的城市群扩张模拟方法具有较高合理性。本文通过与传统模拟方法、实际扩张情况对比验证后证实考虑城市相互作用下的城市扩张预测结果更符合城市群扩张的实际情况。结果表明未来珠三角城市群的城市扩张主要分布在广州、深圳两大中心城市的周围区域,这对珠三角城市群将来的城市协同规划具有重要参考价值。
(2)基于系统保护理念的粮食生产功能区划定在空间规划布局上具有合理性与可行性。粮食生产功能区分布在种粮成本低、集中连片的耕地区域,达到总耕地面积的34.37%,符合广东省划定粮食生产功能区的数量要求;粮食生产后备区分布在种粮成本略高、农业基础较好的区域,占研究区耕地面积的48.89%;其余区域分布在经济发达、种粮成本高、耕地零散的区域,仅占耕地面积的16.74%。
(3)在城市组团发展的背景下,发展大城市以集约利用建设用地,可以减少对耕地,特别是优质耕地的侵占。各城市独立发展情景下2030年珠三角城市群扩张预测结果比考虑城市相互作用下的预测结果多侵占粮食生产功能区11600 hm2和粮食生产后备区8050 hm2。针对该研究结果,本文提出在保护粮食安全的同时,应当顾及各个城市的社会经济差异和自然环境差异,因地制宜实现耕地保护与城市发展的动态平衡,推动城市群内部耕地利用空间优化配置和跨区域非粮化的协同治理。
3.2 珠三角城市群粮食生产区规划建议
本文以珠三角城市群作为研究案例,基于系统保护规划理念,从保护区域粮食安全的角度出发,利用MARXAN模型将珠三角城市群的耕地划分为三个区域:粮食生产功能区、粮食生产后备区、其余区域。在各城市相互影响、协同发展的大背景下,为珠三角城市群未来的耕地保护及粮食功能区规划提出以下建议:
(1)本文划分的粮食生产功能区主要集聚在珠三角东西部地区,耕地集中连片且种植粮食作物成本较低。但由于地处偏远,这些耕地也存在着利用效率低下、农业生产环境较差等问题。因此这些区域应该加快农业基础设施建设,提高农业生产效率,并且重视资源环境的保护,推动粮食安全保护和生态发展齐头并进。政府可加大政策支持力度,提高农业补贴,并引导工商资本下乡,为当地农户提供多元化的农业生产服务。例如:通过改良土壤的方式培肥地力,提高粮食复种指数;将细碎的耕地建设成集中连片的高标准农田,提高农业生产机械化水平和种粮规模;建立粮食生产、加工、运输、销售一体化的经营体系,打造粮食生产产业带,推动一、二、三产业联动发展,突破区域粮食生产经营资金约束的问题,提高粮食作物的经济效益。
(2)粮食生产后备区大多位于珠三角经济发展水平中等地区,该区域种粮成本较高,但此类型的耕地破碎化程度低且农业生产条件较好。因此,政府应对该类型的耕地进行分类管控管理,根据土地的性质、类型合理配置耕地资源,在确保优质耕地用于种植粮食的情况下,因地制宜,允许一般农地种植特色农作物,优化农业生产布局,提高耕地的利用效率和经济收益。同时,应该发挥该区域的经济资本优势,加大农业人才引进力度,大力推动农业生产技术的创新发展,打造高质量粮食生产示范区,推动区域农业生产的高质量发展。
(3)未划入粮食生产区的耕地集中在大城市的中心地带,该类型的耕地粮食种植成本高、耕地零散破碎,非粮化类型以蔬菜种植为主。但此类耕地仍需要政府的保护以及管控,不可盲目侵占或改变土地利用用途。可发展都市农业,建立休闲农业园,如广州的香蜜山生态农业公园、珠海斗门的十里莲江农业观光体验园等,提高该区域的农业生产价值、社会经济价值以及生态服务价值。同时,政府也应加强对此类耕地的管理监督,引导经济作物的生态化耕种,预防农药、化肥等投入过度的情况,便于后续粮食复种,推动耕地保护的可持续发展。
(4)建设用地扩张的同时会造成耕地的流失,但在城市群联动发展的情况下,大城市的组团式发展有利于提高建设用地利用效率,减少对高质量耕地的侵占。提高粮食产量应该充分考虑城市社会经济空间结构特征的影响,完善城市群内部经济发达地区与欠发达地区之间的联动机制,提高城市群内部农业空间资源配置效率。经济发达地区应该加大对欠发达地区的耕地保护和粮食生产的帮扶力度,提供资金和技术支撑,建立和完善种粮区与非种粮区的利益补偿机制,弥补非种粮区经济发展对耕地的占用,保障粮食生产地区的经济发展和人民的生活水平,提高农民种粮的积极性。
本文仍存在部分不足,有待后续深入探讨研究:(1)本文利用MODIS EVI数据将珠三角城市群县区级粮食产量分配到500 m分辨率的空间网格。在未来研究中可进一步获取更精细的粮食产量数据,并结合更多影响粮食产量的因子进行空间化,以提高粮食产量空间分布模拟结果的精度。(2)受基础数据的限制,本文选取的种粮成本评价指标并不完善,导致结果可能存在一定的误差,后续研究需进一步完善。
参考文献
耕地非粮化的系统认知与研究框架: 从粮食安全到多维安全
Systematic review and research framework of "Non-grain" utilizationof cultivated land: From a perspective of food security tomulti-dimensional security
耕地“非粮化”问题、成因及对策
Problems, causes and countermeasures of "non-grain" utilizationof cultivated land
Cropland redistribution to marginal lands undermines environmental sustainability
城市扩张对大城市周边基本农田的影响: 以西安市长安区为例
Analysis of the effects of urban expansion on the basic farmland around the big city: A case study of Changan in Xian
中国城乡建设占用耕地的时空格局及形成机制
DOI:10.11821/dlyj201808011
[本文引用: 1]

描绘了1996-2006年间中国城乡建设用地增长及其占用耕地的时空特征,探讨了城乡建设占用耕地的驱动机制。研究发现:人口流动为主的城镇化模式导致农业转移人口在城乡“两头占地”,这是中国城乡建设用地持续扩张的主要根源;各类开发区的设立和扩张都以占用耕地为主,对城乡建设占用耕地的贡献超过一半;而城市和镇的扩张速度更慢、土地来源更为多元。实证结果表明,投资和产出增长的差异性对城乡建设及其耕地占用的时空格局起到了关键作用;中西部地区的基础设施建设占用了大量耕地,但对区域经济发展和人口集聚的带动作用有限;以开发区为载体的产业集聚发展模式有利于中西部地区的土地集约利用和耕地保护,而东部沿海地区的省级开发区则容易成为地方政府的圈地运动。土地集约利用和耕地保护政策应重点解决农业转移人口城乡同时占地的问题,发挥城镇化的节地效应,并强化政策的区域差异性和针对性。
Urban-rural development and occupation of cultivated landin China: Trends, geography, and drivers
Construction land expansion and cultivated land protection in urbanizing China: Insights from national land surveys, 1996-2006
DOI:10.1016/j.habitatint.2014.10.019 URL [本文引用: 1]
我国粮食主产区粮食生产现状、存在问题及政策建议
The status and problems of grain production in the main grain production areas of China and policy suggestion
基于物—场模型的“两区”划定空间布局合理性评价
Rational evaluation of the spatial lay out of the "Two Zones" Demarcation on object-field model
系统保护规划的理论、方法及关键问题
Theory, work frame and hot issues of systematic conservation planning
基于系统保护规划的黄河流域湿地优先保护格局
DOI:10.13287/j.1001-9332.201809.040
[本文引用: 1]
黄河流域湿地为我国生物多样性维持提供了重要生境.本研究基于黄河流域气候分区、地貌单元及湿地遥感数据,构建黄河流域生态地理综合湿地分类系统.在系统保护规划理论框架下,将湿地气候-地貌分类单元作为生态系统层次保护对象,结合黄河流域鸟类分布范围作为物种层次的保护对象,设定30%湿地优化目标,将公路、铁路、城镇、农村居民点、水坝等作为度量因子创建黄河流域保护代价图层,并利用系统保护规划工具——Marxan软件构建黄河流域湿地保护优化格局,识别湿地保护空缺.结果表明: 黄河流域大部分沼泽湿地集中在黄河上游区域,目前源区保护区覆盖面积大,在内蒙古、甘肃及四川部分区域一些稀有湿地类型游离在保护体系外;黄河中游湿地类型以河道和河滩湿地类型为主,保护覆盖率极低,保护空缺严重,经优化保护网络体系后,保护成效可分别得到29.1%、37.6%的提升.黄河下游湿地主要集中在黄河三角洲区域,目前保护体系完整,保护空缺面积极小.总体上,黄河流域中游河流湿地的保护空缺比例最高,亟需重视.本研究基于湿地保护格局优化结果分区分析黄河流域湿地保护模式,为黄河流域湿地的保护规划管理提供了科学性建议,从宏观层面上为黄河流域水生态保护奠定了基石.
Priority conservetion pattern of wetlands in the Yellow River Basin on systematic conservation planning
DOI:10.13287/j.1001-9332.201809.040
[本文引用: 1]
Yellow River basin is a significant habitat for biodiversity conservation in China. Here, we established a integrated classification system of wetlands based on climate types and geomorphological units, with which as the coarse-filter surrogates of biodiversity elements to complement the fine-filter surrogates of distribution of focal bird species. Then, we applied the theoretical framework of systematic conservation planning (SCP), with those two biodiversity surrogates as protection objects and watershed as planning units. We calculated social and economic costs (including roads, railroads, towns, rural settlements, dams) and set targets of 30% to input Marxan to figure out the optimal set of planning units, which met the protection target with the minimum of social economy cost and land resources. We identified a conservation priority pattern by calculating the irreplaceability of each unit by Marxan. Then, we compared the priority pattern with the existing reserve system to analyze conservation gap in the Yellow River basin. The results showed that most marsh wetlands were concentrated in the upper reaches of the Yellow River. The coverage of reserves in the source area was large. Some rare wetland types in Inner Mongolia, Gansu and Sichuan were separated from the protection system. The main wetland types in the middle reaches of the Yellow River were riverine wetlands, with low protection coverage rate and large conservation gaps. After protection network system being optimized, the protection effect was improved by29.1%-37.6%. The wetland in the lower reaches of the Yellow River was mainly concentrated in the Yellow River Delta area. The protection system was good and the conservation gaps was small. Overall, riverine wetlands in the middle reaches of the Yellow River basin had the highest area proportion of conservation gaps which needed more attention. Based on the priority conservation pattern, our results provided scientific suggestions for the protection planning and management of wetlands in the Yellow River basin, which would lay a foundation for the water ecological protection of the Yellow River basin from the macro scale.
基于系统保护理念的弹性生态保护空间划定: 以广东省茂名市为例
Delineation of flexible ecological protection space based on the concept of systematic conservation: Take Mao city of Guangdong province as anexample
Conservation prioritization for seahorses (Hippocampus spp.) at broad spatial scales considering socioeconomic costs
DOI:10.1016/j.biocon.2019.04.008 URL [本文引用: 1]
基于神经网络的元胞自动机及模拟复杂土地利用系统
Cellular automata for simulating complex land use systems using neural networks, China
DOI:10.11821/yj2005010003
[本文引用: 1]
This paper presents a new method to simulate the dynamics of multiple land uses based on the integration of neural networks,cellular automata and GIS. Recently, cellular automata (CA) have been increasingly used to simulate urban growth and land use dynamics. However, simulation of multiple land use changes using CA models is difficult because numerous spatial variables and parameters have to be utilized. Conventional CA models have problems in defining simulation parameter values, transition rules and model structures. In this paper, a three-layer neural network with multiple output neurons is designed to calculate conversion probabilities for competing multiple land uses. The neural-network-based CA model is directly developed in a GIS environment by using ARC/INFO GRID AML. The GIS provides both data and spatial analysis functions for constructing the neural network. Real data are conveniently retrieved from the GIS database for calibrating and testing the model. The GIS functions are also used for the neural network calculations. The neural network has multiple output neurons to generate conversion probabilities at each iteration. Land use conversion is decided by comparing the conversion probabilities. The model is carried out by iterative looping the neural network for simulating multiple land use changes. Complex global patterns can be generated from local interactions through the neural network. The simulation results are not deterministic because a stochastic variable is used and site attributes are dynamically updated at the end of each loop. The proposed method can overcome some of the shortcomings of the currently used CA models in simulating complex urban systems and multiple land use changes by significantly reducing the tedious work in defining parameter values, transition rules and model structures. The model has been successfully applied to the simulation of land use dynamics in the Pearl River Delta.
基于Agent的城市扩张占用耕地动态模型及模拟
DOI:10.11849/zrzyxb.2014.03.015
[本文引用: 1]
与传统的在景观尺度上对城市扩张占用耕地时空特征及其演变规律的研究不同,论文从微观层面提出基于Agent 的城市扩张占用耕地动态模型(Urban Encroachment on CroplandDynamic Model,UECDM),多角度深入探索耕地向城市用地转变的驱动机理及其时空动态特征,并提出协调二者平衡的可持续发展对策。在UECDM模型中引入视域分析,通过模拟地形和观察点将视觉景观的量化评价结果应用到居民居住区位决策过程,从而分别构建包含可视域的能够更全面表征环境要素及其内部关系的元胞自动机层和不同类型Agent 相互作用的多智能体层,兼顾人类决策行为和城市空间生长自组织性。应用该模型对天津城市扩张占用耕地进行动态模拟研究,并从数量与空间格局两方面展开精度验证,Kappa 系数达到0.795,依据4 个景观格局指数计算得到模拟结果的平均相对误差为3.86%,表明模型具有较高可信度。对不同时期模拟结果的分析表明,天津城市扩张占用耕地空间主要表现为“摊大饼”式外延扩展和跳跃式“卫星城”,研究结果将为未来城市发展规划和耕地保护提供决策支持。
An agent-based approach for urban encroachment on cropland dynamic model and simulation
DOI:10.11849/zrzyxb.2014.03.015
[本文引用: 1]
Unlike traditional studies about the spatio-temporal characteristics and its evolution law of urban encroachment on cropland on landscape scale, this paper proposes agent-based Urban Encroachment on Cropland Dynamic Model (UECDM) from the micro-level, exploring in depth the mechanism and dynamics of urban encroachment on cropland from diverse perspectives, so as to bring forward sustainable development countermeasures for reconciling both balance. UECDM introduces viewshed analysis, which applies quantitative assessment results of the visual landscape to residential decision-making processes by simulating terrain and observation point. The model consists of cell automata layer of viewshed to fully characterize the various environmental elements along with their internal relations and agent layer containing the interactions among different kinds of agents, which takes account of human decision-making and self-organization of urban growth. It is applied to simulate and analyze the spatio-temporal dynamics of Tianjin's urban encroachment on cropland and validation follows. The Kappa coefficient is up to 0.795 and based on four landscape indices, the average relative error of the simulation result is about 3.86%, both indicating a high credibility of this model. Analysis of the simulation and prediction results of different periods indicates that the spatial pattern of Tianjin's urban encroachment on cropland is mainly outward expansion of the "pie" type as well as "satellite towns" of the "jump" type, which makes it possible to provide decision support for future urban development planning and cropland protection.
权衡城市扩张、耕地保护与生态效益的京津冀城市群土地利用优化配置情景分析
Scenario simulation balancing multiple objectives for optimal land use allocationof the Beijing-Tianjin-Hebei Mega Region
A future land use simulation model (FLUS) for simulating multiple land use scenarios by coupling human and natural effects
DOI:10.1016/j.landurbplan.2017.09.019 URL [本文引用: 1]
Loose-coupling a cellular automaton model and GIS: Long-term urban growth prediction for San Francisco and Washington/Baltimore
DOI:10.1080/136588198241617 URL [本文引用: 1]
Understanding the drivers of sustainable land expansion using a patch-generating land use simulation (PLUS) model: A case study in Wuhan, China
城市问题就是区域问题: 中国城市规划区域观的确立和发展
Urban Issue as the regional issue: The establishment and development of the regional view of urban planning in China
Simulating urban growth in a metropolitan area based on weighted urban flows by using web search engine
DOI:10.1080/13658816.2015.1034721 URL [本文引用: 1]
A study on inter-city cooperation in the Yangtze River Delta Region, China
DOI:10.1016/j.habitatint.2008.04.002 URL [本文引用: 1]
Urban land teleconnections and sustainability
DOI:10.1073/pnas.1117622109
PMID:22550174
[本文引用: 1]
This paper introduces urban land teleconnections as a conceptual framework that explicitly links land changes to underlying urbanization dynamics. We illustrate how three key themes that are currently addressed separately in the urban sustainability and land change literatures can lead to incorrect conclusions and misleading results when they are not examined jointly: the traditional system of land classification that is based on discrete categories and reinforces the false idea of a rural-urban dichotomy; the spatial quantification of land change that is based on place-based relationships, ignoring the connections between distant places, especially between urban functions and rural land uses; and the implicit assumptions about path dependency and sequential land changes that underlie current conceptualizations of land transitions. We then examine several environmental "grand challenges" and discuss how urban land teleconnections could help research communities frame scientific inquiries. Finally, we point to existing analytical approaches that can be used to advance development and application of the concept.
Modeling the urban landscape dynamics in a megalopolitan cluster area by incorporating a gravitational field model with cellular automata
DOI:10.1016/j.landurbplan.2013.01.004 URL [本文引用: 2]
How to minimize the impacts of urban expansion on farmland loss: Developing a few large or many small cities?
DOI:10.1007/s10980-020-01073-x [本文引用: 1]
基于城市流模型的城市群扩张模拟: 以武汉城市圈为例
Simulating urban cooperative expansion in the metropolitan region based on improved CA model: A case study of Wuhan Urban Agglomeration, China
耦合InVEST-HFI-PLUS模型的生态分区规划与动态评估: 以博尔塔拉蒙古自治州为例
Ecological zoning planning and dynamic evaluation coupled with Invest-HFI-Plus model: A case study in Bortala Mongolian Autonomous Prefecture
1990年以来卢旺达森林转型路径及趋势模拟
DOI:10.18402/resci.2022.03.06
[本文引用: 1]
社会经济发展过程中一个国家(地区)森林面积由减少转为增加的“森林转型“内在驱动机制,是资源环境研究关注的热点。以4期卢旺达土地覆盖数据为主要信息源,分析1990—2015年该地区森林变化的趋势和时空特征。结合社会经济数据,借助森林转型的路径分析法,探究卢旺达森林面积变化的影响因素及其所遵循的转型路径。在此基础上,利用PLUS模型对卢旺达2030年的森林空间动态分布进行模拟预测,对如何继续保持良好转型态势提出相关建议。结果表明:①卢旺达森林面积在2010年开始出现净增长,由2010年的197383.2 hm<sup>2</sup>增加到2015年的213087.8 hm<sup>2</sup>,年增加率0.8%;②国家公园和保护区是森林增长主要地区,且主要来源于稀树草原和耕地,分别占森林净增加总面积的87.8%和8.8%;③转型的内在驱动机制主要是国家政策引导下发生的“国家森林政策路径”和“森林稀缺路径”,全球化路径体现在植树技术与资金支持;④对卢旺达2030年森林模拟预测显示,森林转型仍将继续,预计到2030年森林面积将净增加34065.2 hm<sup>2</sup>。为进一步提高研究区森林覆盖率,卢旺达政府部门应改善森林恢复的薄弱环节,加快农业集约化推广;通过为农村社区创造场外就业机会,引导经济和就业发生转型,从而推动基于“经济发展路径”与“农村集约化路径”的森林增加。
Forest transition paths in Rwanda since 1990 and trend prediction
DOI:10.18402/resci.2022.03.06
[本文引用: 1]
In the process of socioeconomic development, the internal driving mechanism of the “forest transition” in which the forest area of a country (region) changes from decreasing to increasing is a hotspot in resources and environment research. This study used Rwanda's land cover data as the main source of information to analyze the trends and temporal and spatial characteristics of forest changes in the country from 1990 to 2015. Using socioeconomic data and the path analysis method of forest transition, this study explored the influencing factors of the change in forest area in Rwanda and the transition paths that it followed. On this basis, the patch-generating land use simulation (PLUS) model was used to simulate and predict the spatial dynamics of Rwanda's forest distribution in 2030, and relevant policy recommendations on healthy forest transition was made. The results indicate that: (1) The forest area of Rwanda began to show a net increase in 2010, from 197383.2 hm2 to 213087.8 hm2, with an annual change rate of 0.8%. (2) The National parks and protected areas were the main areas of forest growth, and the growth were mainly from savanna and cropland, accounting for 87.8% and 8.8% of the total forest net increase respectively. (3) The internal driving mechanism was mainly the “national forest policy path” and the “forest scarcity path” under the guidance of national policies. The path of globalization was reflected in tree planting technology and financial assistance. (4) The simulation result shows that forest transition will continue in Rwanda by 2030. The forest area is expected to increase by 34065.2 hm2. To increase the forest coverage rate, the state should improve the weak links of forest restoration and accelerate the promotion of agricultural intensification. By creating employment opportunities for rural communities, the government can guide the transformation of the economy and employment. The state can promote the “economic development path” and “agricultural intensification path” through the above measures.
FLUS-UGB多情景模拟的珠江三角洲城市增长边界划定
DOI:10.12082/dqxxkx.2018.180052
[本文引用: 1]
城市增长边界(UGBs)能够控制城市空间的无序蔓延并引导城市合理增长,多发展情景下的UGBs是对不同规划条件下城市未来发展空间范围进行界定的常用方法。元胞自动机(CA)模型能对未来城市发展进行动态的预测,并已广泛的应用于UGBs的划定中。然而,目前的方法和模型大多只针对单一的城市发展情景进行UGBs的划定,较少能对未来多种发展情景下的UGBs进行准确划定。因此,针对这个问题本文提出了一种基于未来用地模拟(FLUS)模型和膨胀与腐蚀的算法的多情景UGBs划定模型(FLUS-UGB)。本文选取珠江三角洲地区为研究区,在对2000-2013年珠江三角洲地区城市土地利用进行模拟和验证的基础上(Kappa系数为0.715,总体精度为94.539%),预测了2013-2050年基准、耕地保护及生态控制3种情景下珠江三角洲地区的城市扩张,并根据预测结果对该地区UGBs进行划定。结果显示,该方法能够针对不同的城市发展情景进行相应UGBs的划定,具有较好的可靠性及适用性。
Multi-scenarios simulation of urban growth boundaries in Pearl River Delta based on FLUS-UGB
不同土地利用情景下汾河上游地区碳储量评估
Carbon storage assessment in the upper reaches of the Fenhe River under different land use scenarios
基于MODIS EVI的冬小麦产量遥感预测研究
Winter wheat yield estimation based on MODIS EVI
基于MODIS-EVI数据和Symlet 11小波识别东北地区水稻主要物候期
Detecting major phenological stages of rice using MODIS-EVI data and Symlet 11 wavelet in Northeast China
DOI:10.5846/stxb URL [本文引用: 1]
基于时序EVI的2000—2019年吉林省耕地生产力时空分析
Analysis on spatial-temporal changes of cultivated land productivity in Jilin province from 2000 to 2019 based on EVI time series
基于MOD13产品水稻遥感估产模型研究
Models for rice yield estimation using remote sensing data of MOD13
基于MODIS时序数据的湖南省水稻种植面积提取及时空变化分析
Extraction and analysis of spatiotemporal variation of rice planting area in Hunan province based on MODIS time-series data
1999—2007年中国粮食安全的关键影响因素
DOI:10.11821/xb201206007
[本文引用: 1]
选取耕地保护“新政”时期的1999-2007 年为研究时段,以耕地面积与粮食产量变化的分歧原因—耕地生产力变化为切入点,通过比较分析、空间与计量分析探寻粮食安全的关键影响因素。结果表明:农民种粮积极性变化决定着耕地集约利用是影响粮食安全的关键;2003-2007 年农民种粮积极性的持续提高主要来自市场粮价的上涨;粮食直补仅在开始实施的年份激发了农民对种粮收益的预期。此外,本文从提高农民种粮积极性、优化粮食生产投入及改进耕地保护模式3方面,提出了耕地保护发展的政策建议。
Key influencing factors of food security guarantee in China during 1999-2007
DOI:10.11821/xb201206007
[本文引用: 1]
Exploring the key influencing factors of food security guarantee during the typical period is of significance for the development of cultivated land protection and agricultural policy. This paper aims at exploring the factors between 1999 and 2007 which was in the new period of cultivated land protection administration. Methods such as comparison, spatial and econometric analysis are used to analyze the change in cultivated land productivity which was the cause of the disparity between cultivated land area and grain output changes. Results show that farmers' willingness to grow grain which determines cultivated land use intensity is the key factor. The sustained improvement of the willingness in 2003-2007 was mainly resulted from the rise of grain market price. Meanwhile, direct subsidy merely inspired farmers' anticipation for the profit of grain growing at the beginning years of implementing this policy. In addition, suggestions on the development of cultivated land protection are proposed involving improvement of farmers' willingness to grow grain, optimization of inputs in grain growing and improvement of cultivated land protection models.
广东省耕地非粮化的时空分异及其驱动机制
DOI:10.18402/resci.2022.03.05
[本文引用: 1]
粮食安全是保障国家经济发展和社会稳定的基石,日益严峻的耕地非粮化问题加剧了粮食安全风险,直接影响中国社会经济的可持续发展。本文从食物性生产的非粮化角度,选取广东省为研究区域,以县域为评价单元,运用社会经济统计数据及地理空间数据,集成Theil指数、空间自相关模型、随机森林模型、主成分分析和聚类分析等方法,从全省四大区域角度探讨了广东省2005和2019年耕地非粮化的时空演变特征、影响因素及其驱动类型。结果表明:①广东省耕地非粮化率由2005年的48.47%上升至2019年的54.65%,耕地非粮化程度由低度为主转向中度为主,且耕地非粮化利用空间差异呈现缩小态势,以珠三角的演变差异最为显著。②耕地非粮化的空间分布保持稳定的集聚状态,并以珠三角的高高集聚和东翼、西翼、山区的低低集聚为主。③路网密度、地均GDP对耕地非粮化存在显著的推动作用,农村第一产业劳动力占比、各县到省会城市距离是抑制耕地非粮化的重要因素。④耕地非粮化驱动类型以经济驱动型为主(44.63%),主要分布在珠三角;其次是农业支持型(33.06%),大多分布在山区;资源依赖型占比最少(22.31%),集聚在东、西两翼。研究结果有利于精准识别广东省耕地非粮化的时空特征,提升当地耕地非粮化的风险管控水平,对于农业可持续发展以及保证地区的粮食安全具有重要的理论与现实意义。
Spatiotemporal differentiation and driving mechanism of cultivated land non-grain conversion in Guangdong province
DOI:10.18402/resci.2022.03.05
[本文引用: 1]
Food security is the cornerstone of national economic development and social stability. The increasingly serious problem of cultivated land non-grain conversion intensifies the risk of food insecurity and directly affects the sustainable development of China's social and economic systems. From the perspective of non-grain production of food, this study selected Guangdong Province as the research area and county as the evaluation unit and based on socioeconomic statistics and geospatial data, using Theil index, spatial autocorrelation model, random forest model, principal component analysis, and cluster analysis to examine the spatiotemporal characteristics, influencing factors, and driving types of cultivated land non-grain conversion in 2005 and 2019. The results show that: (1) The non-grain rate of cultivated land in Guangdong Province increased from 48.47% in 2005 to 54.65% in 2019. The non-grain degree of cultivated land had changed from low to moderate, and the spatial differentiation of non-grain rate of cultivated land showed a decreasing trend, especially in the Pearl River Delta area. (2) The spatial distribution of non-grain cultivated land maintained a stable agglomeration state and showed high concentration in the Pearl River Delta area and low concentration in the east wing, west wing, and mountainous sub-regions of the province. (3) Road network density and GDP per square kilometer had significant promoting effects on cultivated land non-grain conversion, while the proportion of labor force in rural primary industry and distance between counties and provincial capital cities were important factors to restrain the cultivated land non-grain conversion. (4) The main driving type of cultivated land non-grain conversion was economy driven (44.63%), mainly distributed in the Pearl River Delta area. This was followed by agriculture supporting type (33.06%), mostly distributed in the mountainous areas. The resource dependency type was the least dominant (22.31%) and was concentrated in the east and west wing sub-regions. This research result is conducive to accurately identify the spatiotemporal characteristics of cultivated land non-grain conversion in Guangdong Province, improve the risk control level of local cultivated land non-grain conversion, and has important theoretical and practical significance for sustainable agricultural development and ensuring regional food security.
基于四象限法的城市周边永久基本农田划定研究: 基于自然质量和建设稳定性
Study on permanent basic farmland demarcation around the city with the fourquadrant method: Based on natural quality and constuction stability
农业多功能性多维评价模型及其应用研究: 以浙江省青田县为例
农业多功能性指农业除了具有生产食物及纤维这一传统功能之外,还具有其他经济、社会、环境及文化等独特的非商品生产功能。农业多功能性在概念提出后得到了研究者和政策制定者的广泛关注,国际组织和相关国家也开展了相关研究,并利用该理论指导其自身的农业发展。由于自然条件和人类活动的影响,农业文化遗产地多具有生态环境脆弱、民族文化丰富、经济发展落后等特点,农业的多功能特征表现的更为明显,其农业同时肩负着生产、生态、文化等功能。因此对农业文化遗产地的农业多功能性分析,有利于全面认识其价值,并为农业发展提供指导。本文构建了农业文化遗产地农业多功能性评价模型,并对全球重要农业文化遗产首批试点浙江省青田县进行了定量评价。青田县农业功能评价结果排序为生态环境保护功能0.86、景观保留功能0.83、文化传承功能0.53、产品生产功能0.32、生物多样性保护功能0.27,运用多维模型得出农业多功能性综合评价值为0.64。
Evaluation models for multifunctionality ofagriculture and their applications: A case study on Qingtian county in Zhejiang province, China
Multifunctionality in agriculture refers to the non-trade benefits of agriculture, that is, benefits other then commerce and food production such as environmental protection, landscape preservation, rural employment, and food security in terms of the WTO definition. Due to specific natural conditions and human activities, agricultural heritage sites always have a fragile ecological environment, rich cultures, undeveloped economy as well as multifunctionality in agriculture. This means that agricultural heritage sites have production, ecological, cultural and other functions. To that end, recognizing and evaluating multifunctionality of agriculture at agricultural heritage sites would be conducive to a comprehensive understanding of the value of the agricultural heritage, and in turn to providing guidance for agricultural development. Based on the definition of multifunctionality of agriculture at agricultural heritage sites, the authors established evaluation models for agricultural multifunctionality at agricultural heritage sites and examined Qingtian County in Zhejiang Province, the first pilot site of Globally Agricultural Heritage Systems selected by FAO in 2005. Multifunctionality of agriculture at agricultural heritage sites can reflect essentially in five aspects, i.e., the food production, agricultural biodiversity conservation, traditional agricultural knowledge system and culture conservation, agro-ecological environmental protection and agricultural landscape conservation. The value of the food production function is determined by the guaranteed rate of per capita grain and equivalent per capita arable land area. The value of agricultural biodiversity conservation function can be determined by the diversity of traditional rice varieties. The value of traditional agricultural knowledge system and culture conservation is determined by the importance of intangible culture heritage. The value of agro-ecological environmental protection is determined by fertilizer and pesticide intensity and Eco-environmental Quality Index (EQI). The value of landscape conservation is determined by the tourism revenue. Evaluation results indicated that Qingtian County showed the highest value of 0.86 in agro-ecological environmental protection and an agricultural landscapes conservation value of 0.83, but it had the lowest value of 0.27 in agricultural biodiversity conservation. Using a multi-dimensional model, the comprehensive value of multifunctionality in agriculture in Qingtian County was found to be 0.641. Qingtian County has a long history of raising fish in rice paddies and has been maintaining the traditional rice-fish system exemplified in traditional ecological agriculture. The government and people there have been dedicating to developing green rice-fish products and agricultural tourism, thereby resulting in the highest value of agro-ecological environmental protection and agricultural landscapes conservation. Located in the eastern developed areas in China, there are limited planting areas for traditional rice varieties.
中国村镇耕地污染现状、原因及对策分析
Cultivated land pollution at township level in China: Situation, factors and measures
土地利用变化对区域水—能源—粮食系统耦合协调度的影响: 以京津冀城市群为研究对象
DOI:10.31497/zrzyxb.20220303
[本文引用: 1]
将土地因素引入水—能源—粮食系统,运用耦合协调模型对京津冀城市群2005— 2018年水—能源—粮食—土地系统的时空变化特征进行研究。结果表明:(1)从空间尺度上来看,京津冀城市群建设用地由中心向四周扩散;从京津冀城市群土地利用格局来看,耕地和建设用地面积分别呈现较为明显的下降和增长趋势。(2)将土地纳入水—能源—粮食系统降低了京津冀城市群大多数城市水—能源—粮食系统间的耦合度和耦合协调度。(3)土地与水—能源—粮食子系统组成的两要素系统的协调水平会进行叠加或抵消进而影响水—能源—粮食—土地系统耦合协调度。本文的研究启示在于:京津冀城市群在考虑水、能源、粮食协调发展的同时,应考虑土地对水—能源—粮食系统整体及内部子系统的影响,根据城市自身资源优势合理配置资源、优化产业布局以实现可持续发展。
Impact of land use change on coupling coordination degree of regional water-energy-food system: A case study of Beijing-Tianjin-Hebei Urban Agglomeration
DOI:10.31497/zrzyxb.20220303
[本文引用: 1]
In this paper, the land factor is introduced into the water-energy-food system, and the coupling coordination model is used to study the spatio-temporal change characteristics of the water-energy-food-land system in the Beijing-Tianjin-Hebei Urban Agglomeration from 2004 to 2017. The results show that: (1) On the spatial scale, the construction land of the study area diffuses from the center to the periphery. In terms of land use pattern of the urban agglomeration, the area of cultivated land and construction land showed a relatively obvious decline and growth trend, respectively. (2) The integration of land into the water-energy-food system reduces the coupling degree and co-scheduling of water-energy-food systems in most cities of this urban agglomeration. (3) The coordination level of land and water-energy-food subsystem will be superimposed or offset, which will affect the coupling coordination of water-energy-food-land system. The research enlightenment of this paper is that considering the coordinated development of water, energy and grain, the Beijing-Tianjin-Hebei Urban Agglomeration should understand the impact of land on the whole and internal subsystems of the water-energy-food system, allocate resources reasonably and optimize the industrial layout according to the city's own resource advantages, so as to achieve sustainable development.
中国粮食主产区耕地撂荒程度及其对粮食产量的影响
DOI:10.31497/zrzyxb.20210607
[本文引用: 1]
耕地撂荒严重地影响着我国的粮食安全。以我国粮食主产区为研究区域,在识别撂荒地分布的基础上,测度了撂荒地空间分布格局,并建立耕地撂荒中介效应模型,探究了耕地撂荒对区域粮食产量的影响机制。结果表明:(1)中国粮食主产区耕地撂荒规模为405.53万hm<sup>2</sup>,撂荒率约为5.85%;空间上撂荒地规模分布呈“T”字形空间格局,黑龙江东北部、吉林西北部以及内蒙古南部地区为撂荒地主要集聚区。(2)耕地撂荒对于粮食主产区粮食产量具有显著负向影响,2017年我国粮食主产区因耕地撂荒损失的农田生产潜力达到1339.15万t,损失的粮食产量高达2265.6万t,损失比例达4.69%;内蒙古自治区成为粮食产出损失量和损失比例最大的地区。(3)粮食播种面积、农田生产潜力和农业技术投入均发挥了部分中介作用,系数分别为-0.194、-0.025和0.006。(4)应遵从城乡融合以及农业农村发展态势,强化粮食主产区农业生产现代要素投入与政策扶植,构建粮食生产—耕地休耕空间转换弹性机制,保障我国粮食安全。
The degree of cultivated land abandonment and its influence on grain yield in main grain producing areas of China
DOI:10.31497/zrzyxb.20210607 URL [本文引用: 1]
基于数量、质量、生态三位一体的永久基本农田快速优化布局研究
Research on the rapid optimization of the layout of permanent basic farmland based on quantity, quality, and ecology
基于AHP-FCE模型的大安市土地整理可持续性评价
Sustainability evaluation of land consolidation of Da'an city based on AHP-FCE model
珠三角地区耕地多功能空间差异与影响因素分析
Spatial differences and influencing factorsof arable land multi-functions in Pearl River Delta
广东粮食生产功能区土壤pH值的时空变化特征
Temporal-spatial changes of soil pH value in the grain production functional areas of Guangdong province
永久基本农田划定和保护理论探讨
Discussion about the permanent basic farmaland planning and protection
模拟退火算法在生态保护区空间选址中的应用: 以澳大利亚蓝山保护区为例
Study on reserve site selection by simulated annealing algorithm: An example from the Great Blue Mountain World Heritage Area
Mathematical methods for spatially cohesive reserve design
