

21世纪以来,全球人口激增、经济快速发展、人类活动强度及其对自然资源需求的日益增加,对自然生态系统造成了极大压力[1]。特别是在重点生态功能区,城市化、交通建设、过度放牧等高强度的人类活动导致草地退化、湿地减少等,极大地改变了生态系统的结构和功能,致使生态系统服务锐减,生物多样性丧失、水土流失、土地沙漠化等生态环境问题不断[2,3]。研究也表明,过去的50年里,人类活动已经影响了全球60%的生态系统[4],且全球1/3的自然保护地正承受着巨大的人类活动压力[5],这不仅对生态系统及其生态系统服务的供给造成了极大影响,而且严重威胁着人类的生存与可持续发展[6]。因此,降低人类活动对生态系统的负面影响、保护生态环境并实现可持续发展已成为全球共识。联合国人类环境大会、环境与发展大会、国际生态系统健康大会均提出要关注人类对环境的影响;千年发展目标、可持续发展目标也提出保护、恢复和促进可持续利用生态系统,确保环境的可持续能力,协调好人类活动与自然环境的关系[7];中国政府也实施了退耕还林、天然林保护、三北防护林等一系列生态保护和恢复工程,并提出要“建立以国家公园为主体的自然保护地体系”,以促进生物多样性和生态系统保护[8]。但中国国家公园建设仍处于初级阶段,目前仍面临着农牧生产、矿产开采、能源开发、道路修建等人类活动的干扰,保护与发展的矛盾较为突出[9]。当前,亟需厘清生态文明背景下人类活动对国家公园生态系统服务的影响,为指导自然资源的科学管理和合理利用、协调人地耦合系统提供借鉴。
人类活动是衡量人类对自然环境作用程度的重要指标,相关研究受到国内外学者越来越多的关注,主要体现在人地关系分析、生态环境效应评价、景观格局变化等方面。已有研究多涉及对人类活动的评价,评价方法多集中在两个方面,一是侧重对人类活动本身的基于压力的评估[10,11],多采用基于权重的多指标叠加分析方法、人类足迹指数、生态足迹指数、环境扰动指数等[12⇓-14];二是从人类活动引起的状态变化出发量化人类活动强度[15],涉及土地利用变化、生态系统服务变化或多个状态因子的变化等角度[16],主要采用人类活动强度指数、景观发展强度指数、Modis全球干扰指数等进行评估[17,18]。生态系统服务是人类从生态系统功能中直接或间接获取的效益[19],对人类福祉至关重要,是研究人与环境关系的重要切入点[20]。相关研究主要涉及生态系统服务的供给与价值评估[21]、生态系统服务供需关系及供需不匹配[22,23]、生态系统服务权衡/协同关系[24,25]等多个方面,现有研究主要采用价值量评估法、物质量评估法、能值评估法等方法[26],对森林、草地、农田、湿地等不同生态系统展开研究。目前,仅有少部分学者探究了人类活动影响下的生态系统服务变化以及二者关系的时空关联/格局[27,28]。研究发现,人类活动是影响生态系统服务的重要驱动力[29]。土地利用作为人类活动的主要表现形式,其变化对生态系统服务产生了积极或消极的影响[30]。其中,过度放牧、交通设施、矿产资源过度开采等高强度人类活动导致草地退化、城市化以及湿地向耕地转化等,极大地改变了生态系统的结构和功能,减少了生态系统服务供给,严重损害人类福祉[31,32]。总体来看,现有研究针对人类活动、生态系统服务分别展开了大量研究,但对二者相互作用关系的研究相对较少,尤其较少考察人类活动对重要生态功能区关键生态系统服务影响的动态性与差异性。因此,亟需从较长时间序列维度出发,厘清人类活动对国家公园生态系统服务的影响。
祁连山国家公园是西北地区重要的水源地和生物多样性保护的优先区域,在维护生态平衡、保障径流补给、维持区域可持续发展等方面发挥着重要作用。草地、森林、湿地等资源分布广泛,当地的自然资源特别是林草资源是农牧民赖以生存的基本生产资料。但长期以来,生态保护与经济发展的矛盾比较突出,受气候变化、超载放牧、人为破坏和保护手段滞后等多种因素的共同影响,出现了诸多生态环境问题。生态环境的恶化不仅制约着草原畜牧业的发展,更严重影响生态系统的稳定性及生态系统服务的可持续供给,进而阻碍当地居民福祉及实现可持续生计,直接威胁到区域乃至国家的生态安全。鉴于此,本文以祁连山国家公园为例,分析2000—2019年人类活动与生态系统服务的时空演化特征,并利用广义相加模型评价人类活动对生态系统服务的影响,对制定和实施生态环境保护政策、促进区域可持续发展具有重要意义。
1 研究方法与数据来源
1.1 研究区概况
祁连山国家公园地处青藏、蒙新、黄土三大高原交汇地带的祁连山北麓,位于甘肃、青海两省的交界处,是国家重点生态功能区之一(图1)。总面积为5.02×10⁴ km2,包括甘肃祁连山国家级自然保护区、甘肃盐池湾国家级自然保护区、甘肃天祝三峡国家森林公园、青海仙米国家森林公园、青海祁连黑河源国家湿地公园等5处国家级自然保护地,青海祁连山省级自然保护区、甘肃肃南马蹄寺省级森林公园、甘肃冰沟河省级森林公园等3处省级自然保护地。地形以高山、盆地为主,海拔为4000~5000 m;属高原大陆性气候,年平均气温在4 ℃以下,降水主要集中在5-9月,年降水量在400 mm左右。复杂的地形和气候特征使区内生态系统独特,森林、草原、荒漠、湿地、冰川等景观均有分布,黑河、八宝河、托勒河、疏勒河、党河、石羊河、大通河等河流广布,野生动植物资源丰富,是中国西部重要的生态安全屏障。
图1
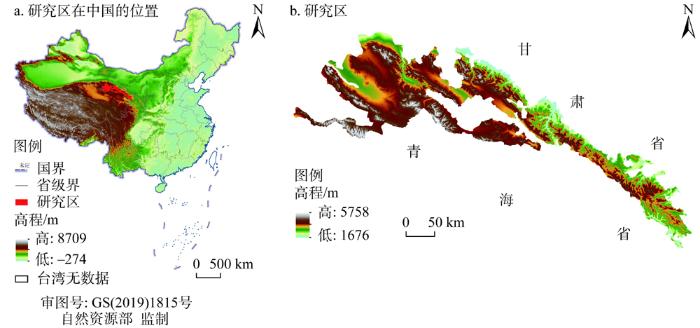
图1
研究区位置
注:本图基于自然资源部标准地图服务系统下载的标准地图制作,底图无修改,下同。
Fig. 1
Location of the study area
2017年9月,祁连山国家公园正式设立,主要目标是保护祁连山生物多样性和自然生态系统的原真性、完整性。共涉及14个县(市、区、场)45个乡(镇)的246个行政村(牧委会),常住人口约5.46万人,以藏、蒙古、裕固族等游牧民族为主。当地居民仍主要从事放牧业、种植业等传统的生计活动,生产方式落后,产业结构单一;居民受教育水平较低,家庭人均收入低,发展替代生计的途径少,对草原、森林等自然资源的传统利用是其生存和发展的基础[33]。在气候变化、超载放牧、乱采滥挖等多种因素的共同作用下,出现了冰川退缩、水源涵养功能减弱、植被严重退化、生物多样性锐减、水土流失加剧等生态环境问题。因此,评估人类活动特征及其对关键生态系统服务的影响,对实现区域可持续发展至关重要。
1.2 数据来源与预处理
2000年、2005年、2010年、2015年、2019年的土地利用数据来自于中国科学院资源环境科学数据中心(
1.3 研究方法
1.3.1 人类活动强度指数
人类活动是指一切人类行为触及生物圈的过程,主要表现为农田开垦、居民点修建、矿产开采、工矿建设、能源开发、旅游开发等[11⇓-13]。本文从人与自然关系视角出发,将人类活动定义为人类为满足自身生存和发展对自然环境所采取的各种开发、利用与保护行为的总称[36]。这些人类活动会导致土地覆盖发生变化,改变当地生态系统的原始特性,进而显著影响生态系统服务的供给。参考已有研究[37],取Lohani清单法、Leopold矩阵法和Delphi法三种方法的平均值作为人类活动强度系数(表1),采用人类活动强度指数(HAI)[36]来分析2000—2019年祁连山国家公园人类活动的时空变化特征。根据已有研究和研究区特征,将人类活动强度划分为四个等级,即低强度(HAI≤0.2)、较低强度(0.2<HAI≤0.4)、中强度(0.4<HAI≤0.6)和较高强度(0.6<HAI≤0.8),计算公式为:
式中:N为土地覆盖类型数量(类);Ai为第i种地类所反映的人类活动强度系数;Pi为土地覆盖类型;TA为土地利用总面积(m2)。
表1 不同人类活动类型的强度系数
Table 1
| 计算方法 | 耕地 | 林地 | 草地 | 水域 | 湿地 | 农村居民点 | 其他建设用地 | 未利用地 |
|---|---|---|---|---|---|---|---|---|
| Lohani | 0.57 | 0.12 | 0.09 | 0.22 | 0.17 | 0.92 | 0.96 | 0.09 |
| Leopold | 0.61 | 0.14 | 0.07 | 0.215 | 0.15 | 0.94 | 0.94 | 0.05 |
| Delphi | 0.65 | 0.11 | 0.08 | 0.24 | 0.16 | 0.96 | 0.95 | 0.04 |
| 平均值 | 0.61 | 0.12 | 0.08 | 0.225 | 0.16 | 0.94 | 0.95 | 0.06 |
1.3.2 生态系统服务评估
InVEST模型是由斯坦福大学、大自然保护协会、世界自然基金会共同研发的评估模型[36],旨在通过模拟不同土地覆盖情景下生态系统服务物质量和价值量的变化,为决策者权衡人类活动的效益和影响提供科学依据。本文选择具有普适性的水源涵养、土壤保持、固碳及生境质量等模块,对祁连山国家公园的生态系统服务进行估算。
(1)水源涵养服务评估模型
InVEST模型中的Water Yield模块是基于Budyko曲线和年平均降水量建立的[22],本文使用该模块计算祁连山国家公园的水源涵养服务,计算公式如下:
式中:Yx为像元x的产水量(m3);AETx为像元x的年实际蒸发量(mm);Px为像元x的年降水量(mm)。
(2)土壤保持服务评估模型
InVEST模型中的SDR模块是基于USLE进行计算的,土壤保持量包含土壤潜在侵蚀量和实际土壤侵蚀量两部分[23],本文使用该模块计算祁连山国家公园的土壤保持服务,计算公式如下:
式中:SEDRETx为栅格单元x的土壤保持量(t);RKLSx、USLEx分别表示土壤潜在侵蚀量(t)、实际土壤侵蚀量(t)。具体计算公式如下:
式中:Rx为降雨侵蚀力 [MJ·mm/(hm2·h·a)];Kx为土壤可蚀性;LSx为坡长—坡度因子;Cx为植被覆盖因子;Px为管理因子。
(3)碳固存服务评估模型
InVEST模型中的Carbon模块考虑了四个碳库(地上生物量、地下生物量、土壤有机物、枯落物)中的固碳量,是用平均碳密度乘以不同土地利用/土地覆被类型的面积来计算生态系统碳储量[24],本文使用该模块来计算祁连山国家公园的碳固存服务,公式如下:
式中:C为生态系统总碳储量(t);Cabove为地上部分碳储量(t);Cbelow为地下部分碳储量(t);
(4)生境质量评估模型
生境质量是网格单元中的景观类型、周围网格单元中的景观以及网格单元中的生境对周围景观构成威胁的敏感性函数[25]。InVEST模型中的Habitat Quality模块是结合景观类型信息以及生物多样性威胁来计算的,计算公式如下:
式中:Qxj为生境质量;Hj为生境适宜性指标;
1.3.3 广义相加模型
广义相加模型(generalized additive model,GAM)是广义线性模型(GLM)的扩展,本质是利用连接函数把加性模型中响应变量的期望与加性部分联系起来[29]。计算公式如下:
式中:E(Y)是Y的期望;
2 结果分析
2.1 人类活动的时空变化特征
2000—2019年祁连山国家公园HAI呈逐渐下降趋势,HAI年均值在0.5左右,表明2000年以来祁连山国家公园人类活动强度不断减弱,并呈以中强度为主的特征(图2)。其中,中强度、较高强度人类活动区域不断减少,两区域所占比例分别由2000年的43.58%、41.76%减少至2019年的42.17%、41.64%;而较低强度、低强度人类活动区域不断增加,两区域所占比例分别由2000年的11.73%、2.93%增加到2019年的11.82%、4.38%。具体来看,2000—2005年,较高强度人类活动区域呈快速扩张态势,该区域所占比例增加了近30%,即该阶段人类活动强度增加。2005—2010年,较低强度、低强度人类活动区域所占比例增加较多,分别增加了9%、4.17%,表明随着自然保护力度的不断加强,人类活动强度不断减弱。
图2
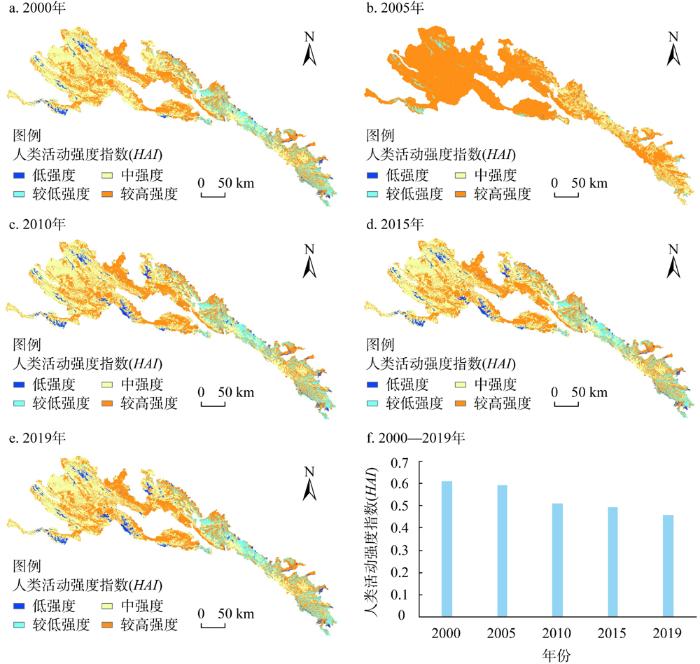
图2
祁连山国家公园HAI的时空变化
Fig. 2
Spatio-temporal change of HAI in Qilian Mountain National Park
从空间分布来看,2000—2019年祁连山国家公园人类活动整体上呈西高东低的分布格局(图2)。具体来看,较高强度人类活动区域占比较高,主要分布在西部的肃南县以及肃北县、天峻县、祁连县的部分区域,在东部的天祝县、门源县的部分低海拔区域也有分布;其中,2000—2005年增长较快,并在研究区东部的肃北县、肃南县形成大规模的连片分布区。中强度人类活动区域占比均在40%以上,主要分布在西部的肃北县,且分布范围呈不断缩小趋势。较低强度人类活动区域占比逐年增加,主要在东部的山丹县、民乐县、天祝县等的部分地区集聚分布。低强度人类活动区域占比较少,但增加较快,主要沿疏勒河、党河、野马河、大通河等流域呈条带状、团块状分布。
从人类活动类型来看,林地、草地、湿地等面积的增加反映出气候变化背景下人类活动的正面影响,而耕地、水域、农村居民点、其他建设用地、未利用地等面积的增加则反映了人类活动的负面影响。2000—2019年祁连山国家公园人类活动以草地、未利用土地、林地为主,其他类型的人类活动相对较少(表2、图3)。草地是最主要的人类活动类型,占比高于40%,但整体呈减少趋势,未利用土地也在减少,而湿地、水域、其他建设用地呈增加态势,表明近20年祁连山国家公园产生正向影响的人类活动占主要。具体来看,2000—2005年,林地、草地、未利用地等人类活动类型之间的转换较多,未利用地转草地、林地的面积最多,分别为6.52×10⁴ m2、9408 m2,多分布在甘肃祁连山国家级自然保护区的天祝县、肃南县以及甘肃盐池湾国家级自然保护区的肃北县等地。2005—2010年,未利用地、耕地转为湿地的面积较多,因而这一阶段内湿地面积明显增加,主要分布在肃南县北部及疏勒河流域等地,但未利用地面积明显减少,主要转换为林地、草地、湿地。2010—2015年,新增草地面积4446 m2,主要来源于水域、湿地、未利用地的转换,多分布在青海祁连山省级自然保护区等地,但产生负面影响的人类活动变化不大。2015—2019年产生负面影响的人类活动大多在减少,其中,未利用地面积持续减少,减少了2280 m2。
表2 祁连山国家公园不同人类活动类型的变化
Table 2
| 人类活动 | 2000年 | 2005年 | 2010年 | 2015年 | 2019年 | 2000—2009年 |
|---|---|---|---|---|---|---|
| 耕地 | 35679 | 36307 | 36809 | 36565 | 36793 | 0.031 |
| 林地 | 594643 | 593677 | 599020 | 598613 | 599303 | 0.008 |
| 草地 | 2116500 | 2114906 | 2106091 | 2110537 | 2110443 | -0.003 |
| 水域 | 4707 | 4821 | 5112 | 5926 | 5569 | 0.183 |
| 湿地 | 106526 | 106617 | 174182 | 175055 | 177364 | 0.665 |
| 农村居民点 | 1448 | 1461 | 1421 | 1499 | 1461 | 0.009 |
| 其他建设用地 | 211 | 209 | 192 | 565 | 627 | 1.972 |
| 未利用地 | 2209041 | 2209574 | 2145509 | 2139580 | 2137298 | -0.032 |
图3
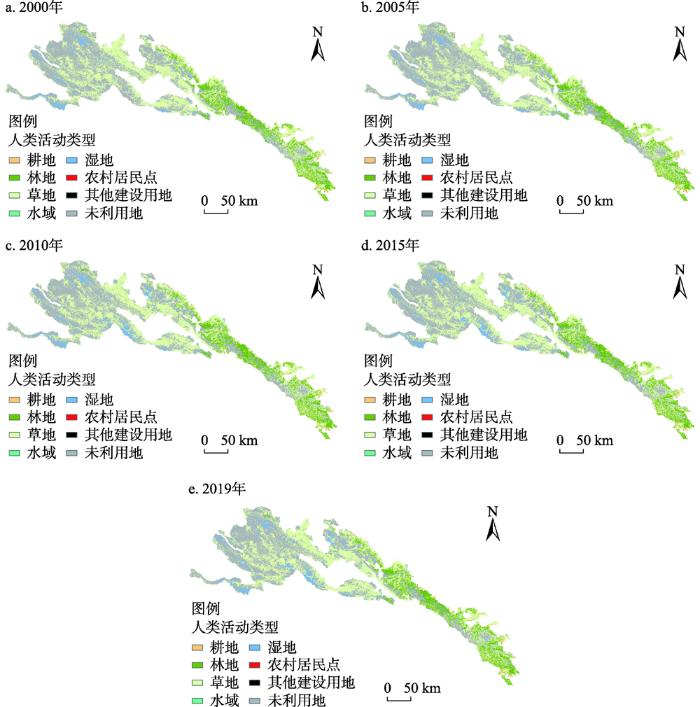
图3
祁连山国家公园人类活动类型的时空变化
Fig. 3
Spatio-temporal change of human activity types in Qilian Mountain National Park
2.2 生态系统服务的时空变化特征
2000—2019年祁连山国家公园水源涵养服务呈先增后减趋势,整体呈西低东高的分布格局,且存在较明显的空间异质性,但部分地区的水源涵养量不稳定,出现了较大面积的显著变化(图4)。2000—2005年水源涵养能力显著提升,单位面积水源涵养量由224.920 mm增加至236.361 mm,增幅为5.09%;高值区显著扩张并在中、东部形成较大规模的连片分布区,将青海祁连山省级自然保护区、甘肃马蹄寺省级森林国家公园等重要的自然保护地联通起来。2005—2010年,单位面积水源涵养量略有下降,降幅为1.24%;高值区在祁连县、天峻县、德令哈市、肃北县等地趋于收缩,主要是由于草地面积的减少所致,减少面积近1×10⁴ m2。2010—2015年,水源涵养能力剧减,单位面积水源涵养量由233.423 mm减少至217.684 mm,降幅高达6.74%;高值区明显减少,仅在东部的门源县呈零星分布,而低值区趋于扩张,主要分布在肃北县等地。2015—2020年,水源涵养能力仍在下降,降幅为3.82%,低值区仍趋于扩张,且在西部、中部形成了大规模的连片分布区;高值区也趋于扩张,主要集中在东部的甘肃天祝三峡国家森林公园等自然保护地周边,该区有较大规模的草地和林地分布区。
图4
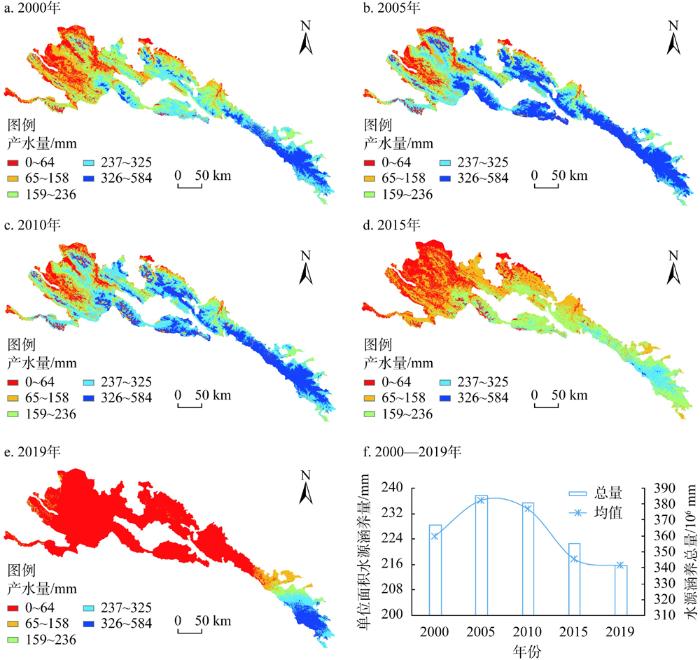
图4
祁连山国家公园水源涵养服务的时空变化
Fig. 4
Spatio-temporal change of water conservation services in Qilian Mountain National Park
2000—2019年间,祁连山国家公园土壤保持服务的变化相对较小,整体呈波动上升趋势(图5)。年平均土壤保持量在130×107 t左右,单位面积土壤保持量由2000年的39.243 t波动增加至2019年的40.276 t,但在2015年下降至最低值38.971 t,这可能与该时段的植被覆盖度相对较少有关。从空间分布来看,2000—2019年祁连山国家公园的土壤保持能力自西向东逐渐增强,且高值区、低值区的空间分布相对稳定,少见大面积的显著变化;高值区主要分布在甘肃祁连山国家级自然保护区、甘肃天祝三峡国家森林公园、甘肃马蹄寺省级森林公园、甘肃冰沟河省级森林公园等自然保护地,低值区主要分布在西部的疏勒河流域等地。
图5
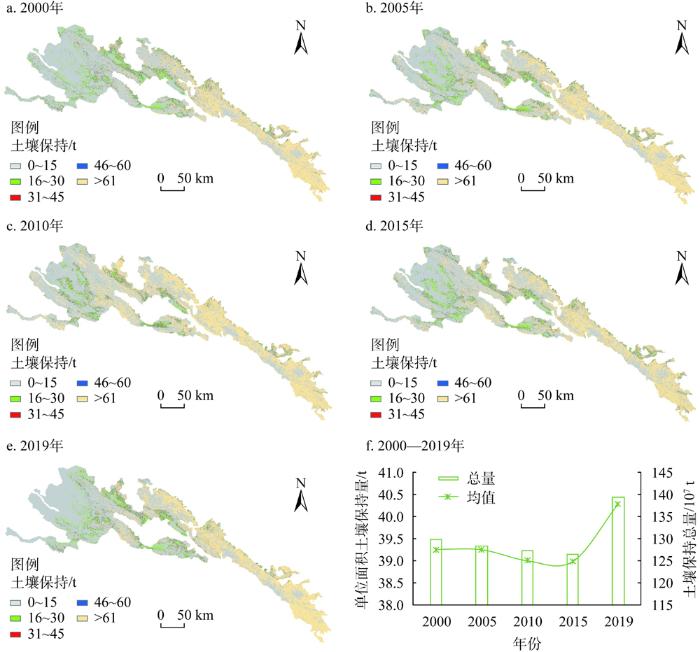
图5
祁连山国家公园土壤保持服务的时空变化
Fig. 5
Spatio-temporal change of soil conservation services in Qilian Mountain National Park
2000—2019年间,祁连山国家公园碳固存服务呈逐年增加趋势,且各个研究时段内的变化相对较小(图6)。年平均碳固存总量467×106 t,单位面积碳固存量由2000年的22.467 t增加至2019年的24.377 t,增幅为8.5%,说明当地的植被退化区域在减少,植被覆盖度逐渐增加,因而固碳能力有所提升。2000—2019年祁连山国家公园的碳固存能力也呈自西向东逐渐增强,且碳固存变化结果的空间分布相对较稳定,高值区和低值区占比均在30%以上。其中,高值区主要分布在祁连山国家公园中部及西部海拔相对较低的一些区域,低值区主要分布在祁连山国家公园西部及中部的部分高海拔地区。
图6
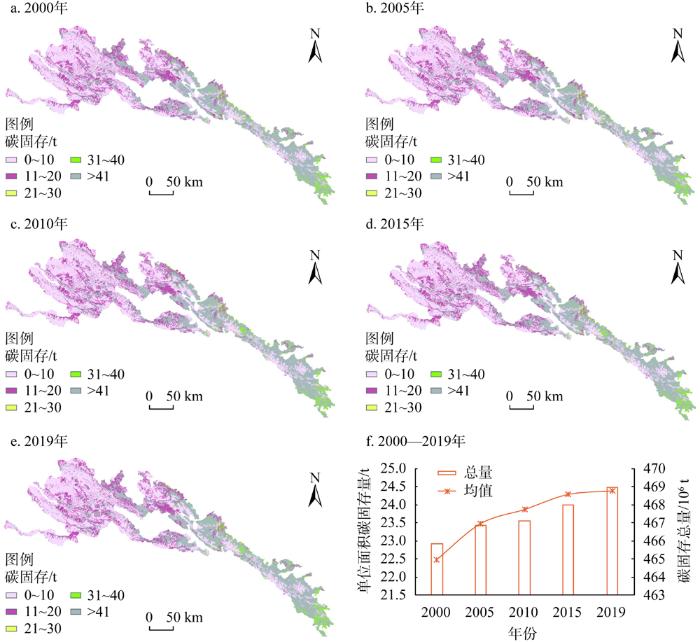
图6
祁连山国家公园碳固存服务的时空变化
Fig. 6
Spatio-temporal change of carbon sequestration service in Qilian Mountain National Park
2000—2019年间,祁连山国家公园生境质量呈缓慢增加趋势,但其变化相对较小,呈现出较稳定的“西低东高”分布格局(图7)。2019年祁连山国家公园的生境质量指数为0.650,与2000年的0.586相比,提高了0.064,表明随着生态环境保护措施的加强,祁连山国家公园的生境质量在改善。其中,2005—2010年祁连山国家公园的生境质量指数由0.596提高至0.637,提升幅度相对最高,即这一阶段内生境质量提升明显,在疏勒河、党河及大通河等流域生境质量由低值区提升至中值区,在青海祁连黑河源国家湿地公园的生境质量低值区也趋于缩小。
图7
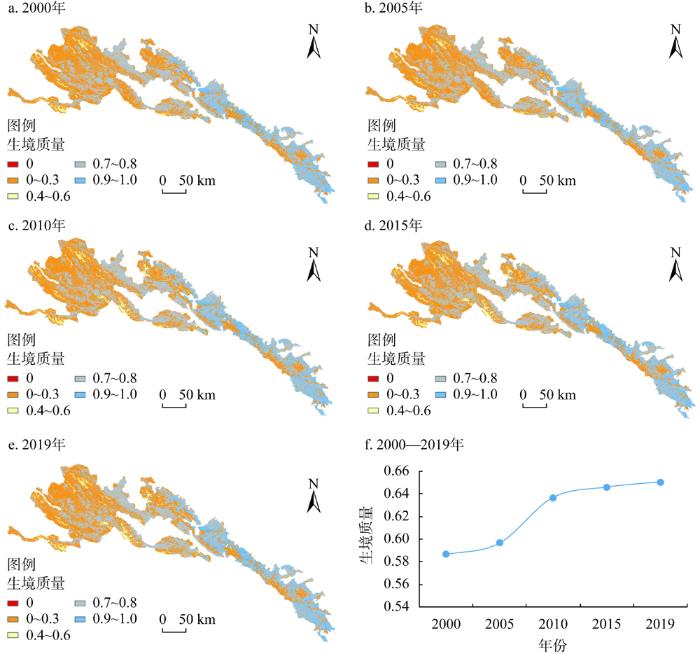
图7
祁连山国家公园生境质量的时空变化
Fig. 7
Spatio-temporal change of habitat quality services in Qilian Mountain National Park
2.3 人类活动对生态系统服务的影响
生态系统服务的分布受人类活动和自然因素的共同驱动。本文将人类活动强度指数作为解释变量,水源涵养量、土壤保持量、碳固存量、生境质量作为响应变量,运用GAM模型探究祁连山国家公园人类活动对关键生态系统服务的影响。结果表明,模型拟合效果较好,R2达到了87.70%,说明该模型能够解释响应变量87.70%的变化,且人类活动对每个响应变量变化的显著影响均在p<0.01的水平上,表明人类活动在统计学上是每个响应变量变化的单独解释变量。其中,人类活动对生境质量、土壤保持、碳固存的解释力较高,偏差解释量在55.52%~62.70%之间,但是人类活动对水源涵养的解释力较低,不足20%(表3)。
表3 GAM模型假设检验结果
Table 3
| 响应变量 | 自由度 | 偏差解释量/% | |||||||||
|---|---|---|---|---|---|---|---|---|---|---|---|
| 2000年 | 2005年 | 2010年 | 2015年 | 2019年 | 2000年 | 2005年 | 2010年 | 2015年 | 2019年 | ||
| 水源涵养 | 7.561 | 7.780 | 8.179 | 7.930 | 8.210 | 16.02 | 13.37 | 12.26 | 12.94 | 10.30 | |
| 土壤保持 | 8.195 | 8.471 | 8.232 | 7.912 | 8.531 | 55.52 | 57.31 | 58.70 | 58.93 | 60.91 | |
| 碳固存 | 7.956 | 8.241 | 8.470 | 8.809 | 8.990 | 53.30 | 54.41 | 55.73 | 56.50 | 55.64 | |
| 生境质量 | 8.921 | 9.046 | 9.123 | 9.174 | 9.177 | 57.17 | 58.32 | 59.04 | 59.56 | 62.70 | |
研究发现,人类活动确实会影响生态系统服务的提供,但其与各响应变量之间存在复杂的非线性关系(图8)。2000—2019年,随着人类活动强度的不断减弱,祁连山国家公园的生境质量、土壤保持、碳固存服务呈增加趋势,仅水源涵养服务呈下降趋势。
图8
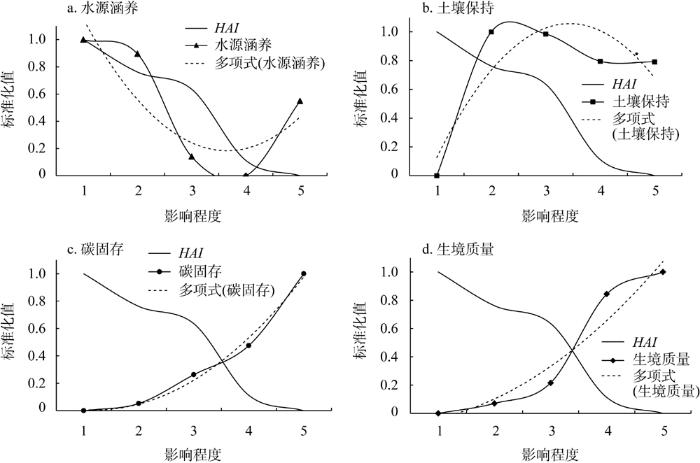
图8
人类活动对关键生态系统服务的影响
Fig. 8
Impacts of human activity on key ecosystem services
2000—2019年人类活动强度指数在0~0.6之间的区域是人类活动强度的主要变化区域。特别是当人类活动强度指数在0~0.1之间的区域时,人类活动与水源涵养服务呈显著负相关。人类活动强度指数在0.8左右的区域时,人类活动与土壤保持服务呈正相关。但就生境质量和碳固存服务而言,不论人类活动强度指数如何变化,人类活动与这两种类型的生态系统服务之间始终呈显著负相关关系。
总的来看,人类活动强度指数在0.4~0.6之间的区域增加较快,这也导致某些生态系统服务类型发生了较大变化。其中,水源涵养服务在人类活动强度指数0.4~0.8之间的区域呈大幅下降趋势,而在人类活动强度指数0~0.4的范围内变化相对较小。此外,当人类活动达到一定强度后,随着人类活动强度的下降,土壤保持服务呈急剧下降趋势。
3 结论与讨论
3.1 结论
祁连山国家公园是黄河流域的重要水源产流地、甘肃河西走廊的“生命线”,也是西北地区乃至全国最为重要的生态安全屏障之一,社会经济的不断发展使人类活动对生态系统服务的影响越来越显著。本文评估了2000—2019年祁连山国家公园的人类活动强度,并运用InVEST模型分析了关键生态系统服务的变化,最后利用广义相加模型探究了人类活动对生态系统服务的影响。得出以下结论:
(1)2000—2019年祁连山国家公园的人类活动强度不断减弱,并呈以中等强度为主的特征,空间分布特征总体上呈西高东低的态势。
(2)近20年祁连山国家公园土壤保持、碳固存、生境质量均呈增加趋势,大致呈西低东高的分布格局,但水源涵养量呈先增后减趋势,并存在较明显的空间异质性,部分地区的水源涵养量不稳定,在研究期间出现了较大面积的显著变化。
(3)祁连山国家公园人类活动与碳固存、生境质量存在显著的负相关关系,与土壤保持存在相对较弱的负相关关系,而与水源涵养存在复杂的非线性关系,研究表明人类活动强度的增加会直接影响当地生态系统服务的提供。
根据以上研究结果,建议从国家公园人地关系交互的视角充分考虑人类活动对生态系统服务的综合影响及其差异,并在国家公园的生态规划和管理中要充分考虑人类活动的不同方式与强度,针对不同管控分区实施更具针对性的保护措施。如,在核心保护区,实行最严格的管控,采取诸如生态移民等方式逐渐降低人类活动强度,保护好当地的自然生态系统;而在国家公园与区域外的缓冲地带,即一般控制区可以开展自然体验、环境教育等“全民共享”活动。同时,应鼓励原住民参与到国家公园的保护与管理中来,保障社区成为国家公园建设的直接受益者,从而将大量的社区人类活动转化为对国家公园保护和管理有利的力量。
3.2 讨论
本文发现,人类活动可以是积极的,也可以是消极的。具体来看,快速城市化、人口增长以及农业生产等人类活动会对自然环境产生极大的负面影响,使生态系统的结构、功能受损,进而影响到生态系统服务,如直接减少了水源涵养、土壤保持、碳固存、生境质量等重要生态系统服务的可持续供给[38]。人类活动造成的土地沙漠化、草地退化、湿地萎缩等负面影响是造成生态系统服务供给减少的主要原因,Dwiyahreni等[15]在印度尼西亚国家公园的研究中也有类似发现。积极的人类活动对生态环境保护和恢复有正向促进作用。研究发现,2000—2019年祁连山国家公园人类活动强度呈不断下降趋势,这与当地实施的生态保护政策有关[33]。中国实施的天然林资源保护、退耕(牧)还林(草)、水土保持工程以及自然保护区建设等生态保护工程,促进了森林资源增长、草地生态功能恢复以及荒漠化、沙化、石漠化面积持续减少,使中国生态环境质量改善、生态系统服务功能提升[30]。
本文中,碳固存、生境质量与人类活动呈负相关关系,且生境质量与人类活动的相关性高于碳固存,表明人类活动对生境质量的影响更大。这主要是由于祁连山国家公园保护与发展的矛盾比较突出,在超载放牧、过度开发和保护手段滞后等多种因素的共同作用下,地表发生了巨大的变化,土地荒漠化、盐碱化、沙化加剧,致使当地脆弱的生态系统濒临崩溃,生境质量逐渐下降[35]。已有研究也发现人类活动较强,碳储量较低[39]。土壤保持服务与人类活动呈负相关关系,但相关性较弱。水土流失是祁连山国家公园面临的主要生态环境问题之一,水土流失主要集中在西部的山区,但这些地区海拔高、人类活动相对较弱,使土壤保持能力相对增强。此外,2017年“祁连山系列环境污染案”过后,实施的水土保持工程是祁连山生态环境保护与综合治理的七大工程之一,对土壤保持能力的提升发挥了一定作用[33]。
人类活动是以自然环境为背景展开的,因此也有必要分析自然因素对生态系统服务的影响,如海拔、坡度、降水量、温度、相对湿度、日照时数等。如果忽视这些自然因素,特别是气候变化的影响,将会导致对生态系统服务的错误评估[40]。然而,气候变化对生态系统服务的影响相对较难评估,因为气候变化的影响往往是在较长时间尺度上发生变化[41],且祁连山国家公园属于中国国家公园的第一批试点区,区内分布有多个国家级、省级自然保护地,其保护目标、管理原则等等本身各有不同,对不同的气候要素的响应也有差别,具有高度的不确定性。因此,进一步的研究中需综合考虑不同要素,以提高评估的准确性。人类活动强度涉及自然条件、人文环境以及生产、生活等多重因素,后续研究中要考虑选择更具体的指标,以便更直观地表征人类活动,对于重点生态功能区等特定的区域,科学合理地界定人类活动强度也是需要进一步研究的问题。此外,由于研究区独特的地理位置和气候条件,导致数据获取的成本高、难度大,对遥感影像的解译精度也有一定影响,后续研究中应采用更系统规范的方法评定遥感分类结果的精度。
参考文献
生态保护地协同管控成效评估
DOI:10.31497/zrzyxb.20200403
[本文引用: 1]

分区分类管理是我国生态保护的重要管控制度,生态保护地是事关国家生态安全的关键区域,开展生态保护地保护成效评估及不同类型生态保护地之间的协同管控成效评估具有重要意义。以吉林省自然保护地和重点生态功能区等生态保护地(即禁止开发区和限制开发区)为研究对象,以重要生态空间、植被生态、水源涵养功能为主要内容,基于“禁止开发区—限制开发区—省域”的管控梯度差异,评估分析了生态保护地的协同管控成效。结果表明:(1)从重要生态空间协同管控成效来看,自然保护地的重要生态空间面积比例最高、人类活动干扰指数最低,这与生态保护管控严格程度呈现很好地正相关。但是1980—2015年间重要生态空间面积比例均有所减少,减少幅度与管控严格程度没有表现出正相关。(2)从植被生态协同管控成效来看,植被覆盖总体呈现出自东向西逐步降低的特点,与东部分布有重点生态功能区和森林类自然保护区、西部分布较多的湿地类自然保护地的空间特征一致。但是,由于湿地及水域类型自然保护地面积占比较高,且分布在吉林西部草原和平原区的面积比例较高,自然保护地的年际变化较大、且植被覆盖稳定度低于重点生态功能区。(3)从水源涵养功能协同管控成效来看,水源涵养能力呈现出东部和西部高、中部低的特点,与这两个区域主要分布有森林、草地和湿地等重要生态空间密切相关,也与分布着大面积的重点生态功能区和各类自然保护地密切相关。自然保护区的水源涵养能力最高,且年际变化最小、稳定性最高。
Evaluation of protection effect of eoordinated management of different kinds of nature reserves
DOI:10.31497/zrzyxb.20200403
[本文引用: 1]
Ecology reserves are the key regions relating to national ecology security. Diving into different protection regions and taking effective measures play an important role in ecological protection management in China. Evaluation of protection effect of nature reserves and coordinated management of different kinds of nature reserves is of great significance. This paper takes nature reserves and key ecological function regions in Jilin as study reasons, they are prohibited and restricted development areas respectively. This article analyses ecological space, vegetation ecology and water conservation services in different kinds of nature reserves, then evaluates and examines different management effects of these regions resulting from management gradient. According to protection effect of important ecological space, the highest area proportion of important ecological space in Jilin province was observed in nature reserves, and the lowest human disturbance index was found in the study area, which is positively correlated with the strict degree of management and control of ecological protection. However, the proportion of important ecological space area decreased from 1980 to 2015, and the extent of reduction was not positively correlated with strictness of management and control. Secondly, according to protection effect of vegetation ecology, the vegetation coverage gradually decreased from the east to the west, which is consistent with the spatial characteristics that the key ecological function areas and most of forest nature reserves are in the east, and the wetlands are in the west. However, due to the high area proportion of wetlands and water type nature reserves, and most of them are located at grassland and plain in the west, the annual variation of vegetation coverage in nature reserves is larger than that of the key ecological function areas, while the multi-year stability of vegetation coverage is lower than that of the key ecological function areas. Thirdly, in terms of protection effect of water conservation services, the water conservation services capacity in the east and west is higher than that in the middle of Jilin province. This is closely related to the fact that most of forests, grasslands and wetlands of Jilin are located in the east and west, and that the key ecological function zone and most of forest nature reserves are also in these areas. The water conservation capacity and its stability in nature reserves is better than those outside the reserves.
The performance and potential of protected areas
DOI:10.1038/nature13947 [本文引用: 1]
Sixteen years of change in the global terrestrial human footprint and implications for biodiversity conservation
DOI:10.1038/ncomms12558
PMID:27552116
[本文引用: 1]
Human pressures on the environment are changing spatially and temporally, with profound implications for the planet's biodiversity and human economies. Here we use recently available data on infrastructure, land cover and human access into natural areas to construct a globally standardized measure of the cumulative human footprint on the terrestrial environment at 1 km(2) resolution from 1993 to 2009. We note that while the human population has increased by 23% and the world economy has grown 153%, the human footprint has increased by just 9%. Still, 75% the planet's land surface is experiencing measurable human pressures. Moreover, pressures are perversely intense, widespread and rapidly intensifying in places with high biodiversity. Encouragingly, we discover decreases in environmental pressures in the wealthiest countries and those with strong control of corruption. Clearly the human footprint on Earth is changing, yet there are still opportunities for conservation gains.
One-third of global protected land is under intense human pressure
DOI:10.1126/science.aap9565
PMID:29773750
[本文引用: 1]
In an era of massive biodiversity loss, the greatest conservation success story has been the growth of protected land globally. Protected areas are the primary defense against biodiversity loss, but extensive human activity within their boundaries can undermine this. Using the most comprehensive global map of human pressure, we show that 6 million square kilometers (32.8%) of protected land is under intense human pressure. For protected areas designated before the Convention on Biological Diversity was ratified in 1992, 55% have since experienced human pressure increases. These increases were lowest in large, strict protected areas, showing that they are potentially effective, at least in some nations. Transparent reporting on human pressure within protected areas is now critical, as are global targets aimed at efforts required to halt biodiversity loss.Copyright © 2018 The Authors, some rights reserved; exclusive licensee American Association for the Advancement of Science. No claim to original U.S. Government Works.
Assessing research trends related to Sustainable Development Goals: Local and global issues
DOI:10.1016/j.jclepro.2018.09.242 URL [本文引用: 1]
Key knowledge gaps to achieve global sustainability goals
DOI:10.1038/s41893-019-0412-1
[本文引用: 1]
Regional and global assessments periodically update what we know, and highlight what remains to be known, about the linkages between people and nature that both define and depend upon the state of the environment. To guide research that better informs policy and practice, we systematically synthesize knowledge gaps from recent assessments of four regions of the globe and three key themes by the Intergovernmental Science-Policy Platform for Biodiversity and Ecosystem Services. We assess their relevance to global sustainability goals and trace their evolution relative to those identified in the Millennium Ecosystem Assessment. We found that global sustainability goals cannot be achieved without improved knowledge on feedbacks between social and ecological systems, effectiveness of governance systems and the influence of institutions on the social distribution of ecosystem services. These top research priorities have persisted for the 14 years since the Millennium Ecosystem Assessment. Our analysis also reveals limited understanding of the role of indigenous and local knowledge in sustaining nature's benefits to people. Our findings contribute to a policy-relevant and solution-oriented agenda for global, long-term social-ecological research.
"半个地球"愿景下的保护地识别: 基于全球主要优先保护模块
DOI:10.31497/zrzyxb.20210502
[本文引用: 1]
设立保护地是保护生物多样性的最有效举措。“半个地球”愿景提出将50%的面积纳入保护地,并有效保护85%的物种,是全球生态保护的目标。IUCN保护地分类系统是国际通用的标准,一系列优先保护模块研究则对保护地的识别进行着探索。本文旨在通过对这些模块的保护目标、识别标准等进行分析,为保护地科学识别提供合理参考。主要结论如下:(1)物种、栖息地与人类活动是各模块的主要考虑要素,识别标准包括物种丰富度、生境转变率、人类活动强度等;(2)各模块对生境转变率的考虑有“亡羊补牢”和“未雨绸缪”两种思路,对人类活动强度的考虑有直接和间接之分;(3)各模块分布面积占比在5.77%~25.32%之间,总范围占全球陆表的55.59%,超过了“半个地球”愿景的目标比例。
Identification of protected areas under the "Half Earth" target: Based on main global conservation priorities
DOI:10.31497/zrzyxb.20210502 URL [本文引用: 1]
中国典型自然保护区生境状况时空变化特征
DOI:10.11821/dlxb201801008
[本文引用: 1]
中国已建立各类自然保护区2740个,占全国陆地面积的14.8%。本文以典型国家级自然保护区为例,基于遥感反演、模型模拟、空间分析等方法,获得植被覆盖度、净初级生产力(NPP)和土地覆被时空数据集,分析2000-2015年中国不同区域、不同类型自然保护区生境状况时空变化及人类扰动的影响,进而评估自然保护区在栖息地及生物多样性保护方面的效果。结果表明:2000-2015年,国家级自然保护区植被覆盖度从36.3%提高到37.1%,各类型自然保护区均有不同程度提高,其中森林类保护区年增速0.11%,草原草甸类0.84%,内陆湿地类0.21%,荒漠生态类0.09%,野生动物类和野生植物类则分别为0.11%和0.08%。草原草甸类、内陆湿地类、荒漠生态类、野生动物类自然保护区植被NPP年增速分别为2.06 g·m<sup>-2</sup>、1.23 g·m<sup>-2</sup>、0.28 g·m<sup>-2</sup>、0.4 g·m<sup>-2</sup>,而森林类和野生植物类则分别以3.45 g·m<sup>-2</sup>和2.35 g·m<sup>-2</sup>的年速率减少。近15年,国家级自然保护区内人类扰动呈现微弱变化,除青藏高原区和南亚热带湿润区内保护区人类扰动略微下降以外,其他区域均有所增强,特别是北亚热带和温带湿润区,其保护区人类扰动由4.70%明显增至5.35%。
Dynamic changes of habitats in China's typical nature reserves on spatial and temporal scales
DOI:10.11821/dlxb201801008
[本文引用: 1]
Establishment of protected areas is one of the most important approaches for biodiversity conservation. Until 2015, China had established 2740 sites for nature reserves with a total area of 1.47 million km2, which covering 14.8% of Chinese land surface. Based on remote sensing inversion, model simulation and spatial analysis methods, this study analyzed spatial and temporal variations of habitat from vegetation coverage, net primary production (NPP) and their driving forces in different types and climate zones on the typical nature reserves of China, in the first 15 years of the 21st Century. Results showed that from 2000 to 2015, the vegetation coverage of national nature reserves increased from 36.3% to 37.1%, with all types of nature reserves improved to some extent. The forest ecological nature reserves observed annual growth of 0.1%, grassland meadow type 0.8%, inland wetlands classes 0.2%, desert ecological class 0.1%, wild animal 0.1% and wild plants 0.1%. The NPP of grassland meadow, inland wetlands, desert ecology, wild animal nature reserve had a growth of 2.0 g·m-2, 1.2 g·m-2, 0.3 g·m-2 and 0.4 g·m-2 respectively. However, the NPP of forest ecological and wild plants nature reserves reduced by a rate of 3.5 g·m-2 and 2.5 g·m-2 respectively. In the 15 years, national nature reserves had a weak change from human disturbance, in addition to nature reserves which located in the Qinghai-Tibet Plateau and the south subtropical humid area with a slightly fall, others are increased, especially in the north subtropical and temperate humid zone, the human disturbance increased significantly from 4.7% to 5.4%.
南水北调中线汉中市水源地生态脆弱性评价与特征分析
Analysis of Eco-environmental vulnerability characteristics of Hanzhong city, near the water source midway along the route of the south-to-north water transfer project, China
Spatio-temporal estimation of the anthropogenic environmental stress intensity in the Three-River-Source National Park Region, China
黄土高原地区人类活动强度时空变化分析
DOI:10.11821/dlyj201704005
[本文引用: 2]
在采用建设用地当量面积占区域土地总面积百分比法计算黄土高原地区各县级单元人类活动强度基础上,从总体变化、类型时空分异、地域单元变化及空间自相关性四方面分析人类活动强度时空变化特征。结果表明:1992年黄土高原地区人类活动强度为12.48%,2000年达到14.49%,2008年仅上升至14.81%,2000年以前增长相对较快,2000年以后增长明显放缓;人类活动强度空间分布格局呈现出西北低、东南高的特点,二者之间的区域则随时间发生一定变化,呈现出较低、中等、较低与中等类型交错分布的变化趋势;除黄土丘陵地区人类活动强度较低、低类型大幅度转化为中等类型外,其他五大地域单元空间分布格局变化不大;人类活动强度具有显著的空间集聚(正相关)特征,高值集聚区主要分布于黄土高原地区东南部的汾渭谷地和豫西北盆地区,低值集聚区大片集中于西北半壁的鄂尔多斯风沙区、黄土丘陵地区以及青东高原山地丘陵区。
Analysis of spatial-temporal variation of human activity intensity in Loess Plateau Region
中国国家级自然保护区人类活动及变化特征
DOI:10.11821/dlyj020200458
[本文引用: 2]
自然保护区是中国自然保护地的基础,是生物多样性保护的核心区域,国家级自然保护区更是中国自然保护区的主体。基于高分辨率影像数据,提取了中国446个国家级自然保护区2015年的人类活动及2013—2015年人类活动变化信息,分不同功能区、不同人类活动、不同区域和不同类型国家级自然保护区分析了人类活动及变化情况,并评估了2013—2015年人类活动变化强度和规律,结果表明:2015年,446个国家级自然保护区人类活动普遍存在,以农业用地和居民点占绝对优势,这两种类型人类活动总面积占国家级自然保护区人类活动总面积的88.94%、总数量占77.67%。2013—2015年,有66.59%的国家级自然保护区存在新增或规模扩大人类活动,人类活动数量增幅达到2.45%,相较于农业用地和居民点,开发建设活动的新增或规模扩大趋势更为明显。2013—2015年,33.41%的国家级自然保护区人类活动无变化,45.06%的国家级自然保护区人类活动变化较小,仅有21.53%的国家级自然保护区人类活动变化明显和较明显。从空间分布看,总体上东部的国家级自然保护区比中西部的国家级自然保护区人类活动变化强度大,沿海、沿河国家级自然保护区人类活动变化强度相对较大。
Characteristics of human activities and the spatio-temporal changes of national nature reserves in China
DOI:10.11821/dlyj020200458
[本文引用: 2]
Nature reserves are the core area for biodiversity conservation. National nature reserves are the main body of nature reserves in China. According to characteristic of each type of human activity, the patches of different human activities of 446 national nature reserves in 2015 and their change from 2013 to 2015 were interpreted with the aid of GIS and RS. Status of the distribution of human activities and their change are generally analyzed in different functional zones and different regions in China. Also according to different types of human activities, the intensity and characteristics of dynamic change of human activities are evaluated from 2013 to 2015. The results showed that in 2015, there were different kinds of human activities in 446 national nature reserves. Human activities were widely distributed, and agricultural land and residential areas were dominant. The area of the two types covered more than 88.94% of the total of human activities. And the number exceeded 77.67% of the total. In China, 66.59% of national nature reserves had new or expanded human activities from 2013 to 2015, and the amount of human activities increased by 2.45%. Compared with agricultural land and residential areas, the increase trend is more pronounced of the development or construction activities. From 2013 to 2015, the number of national nature reserves where human activities had no change covered 33.41% of the total number of national nature reserves in China, those with little change covered 45.06%, and those with and significant change covered only 21.53%. From the perspective of spatial distribution, the overall human activity in the national nature reserves of eastern China is greater than that of central and western parts of the country. The intensity of human activities in coastal and riverside national nature reserves is relatively strong.
The human footprint and the last of the wild: The human footprint is a global map of human influence on the land surface, which suggests that human beings are stewards of nature, whether we like it or not
DOI:10.1641/0006-3568(2002)052[0891:THFATL]2.0.CO;2 URL [本文引用: 1]
Changes in the human footprint in and around Indonesia's terrestrial national parks between 2012 and 2017
The human footprint (HF) was developed to measure of the impact of human activities on the environment. The human footprint has been found to be closely related to the vulnerability of protected areas around the world. In Indonesia, as nature conservation is still seen as hindering economic development, it is especially important to assess the human footprint in order to comprehend the overall pressures resulting from the various human activities on Indonesia's national parks. This study measured the change in the human footprint in and around 43 terrestrial national parks over 5 years, between 2012 and 2017. As many as 37 out of 43 NPs experienced an increase in the HF, ranging from 0.4 to 77.3%. Tanjung Puting in Kalimantan experienced the greatest increase (77.3%), while Ujung Kulon in Jawa Bali bioregion had the greatest decrease (10.5%). An increase in human population density and improved access to parks from roads, rivers and coastlines are the main drivers of increasing impacts on national parks.
净初级生产力的人类占用: 一种衡量区域可持续发展的新方法
Human appropriation of net primary production: An approach for ecological assessment of regional sustainable development
DOI:10.11849/zrzyxb.2007.01.018
[本文引用: 1]
Ecological assessment of sustainable development is one of the superiority fields of international ecological economy and researches on sustainable development.The approach of human appropriation of net primary production(HANPP)can assess the ecological sustainability of human ecological-economic systems through measuring how much the net primary production is appropriated by human beings,which is a newly while important research area.In this paper,we briefly introduced the basic concept,theories of human appropriation of net primary production and its approaches to measure sustainable development.Then to sum up all the latest researches on human appropriation of net primary production,the following four prime issues can be summarized for applying HANPP on ecological assessment of regional sustainable development,that is,the uncertainty of key factors,the threshold of sustainability,the restriction in data collection,and the imports and exports of biological production.
基于地表覆盖分类的生态环境人为干扰度分析: 以北京市为例
Dynamic changes of hemeroby degree based on the land cover classification: A case study in Beijing
Landscape development intensity index
The condition of landscapes and the ecological communities within them is strongly related to levels of human activity. Human-dominated land uses and especially the intensity of the uses can affect adjacent ecological communities through direct, secondary, and cumulative impacts. Using land use data and a development-intensity measure derived from energy use per unit area, an index of Landscape Development Intensity (LDI) can be calculated for watersheds of varying sizes to estimate the potential impacts from human-dominated activities that are experienced by ecological systems within those watersheds. The intended use of the LDI is as an index of the human disturbance gradient (the level of human induced impacts on the biological, chemical, and physical processes of surrounding lands or waters). The LDI can be used at the scale of river, stream, or lake watersheds or at the smaller scale of individual isolated wetland watersheds. Based on land uses and land cover, the LDI can be applied using available GIS land use/land cover data, aerial photographs, or field surveys. A description of data needs and methods for calculating an LDI index and several applications of the index as a land use based ranking scheme of the human disturbance gradient for watersheds are given.
The value of the world's ecosystem services and natural capital
DOI:10.1038/387253a0 [本文引用: 1]
生态系统服务供需关系研究进展与趋势展望
DOI:10.31497/zrzyxb.20210801
[本文引用: 1]
厘清生态系统服务供需关系,对于实现自然资本永续利用与生态系统服务供需协调具有重要意义。结合国内外生态系统服务研究情况,提出了生态系统服务供需关系研究框架,阐释了生态系统服务供需关系形成机制与表现形式,概括了生态系统服务供需关系基本特征,总结了生态系统服务供需关系研究方法,并梳理了未来可能研究方向,以期能够为生态系统服务研究与管理提供参考。总体来看,生态系统服务供需关系产生于两种非排他性机制,主要有簇、权衡、协同与兼容四种表现形式,并具有空间异质性、时间变异性与尺度效应特征;生态系统服务供需关系主要有指数构建与评估、指标统计与分析、情景制定与模拟及空间制图与分析四种研究方法。
Research progress and prospect for the relationships between ecosystem services supplies and demands
DOI:10.31497/zrzyxb.20210801 URL [本文引用: 1]
Spatial and temporal variations and significance identification of ecosystem services in the Sanjiangyuan National Park, China
The establishment of the Sanjiangyuan National Park (SNP) favours implementation of strictest ecological protection on the Tibetan Plateau, thus firmly ensuring national ecological security. To understand ecological background in the SNP, spatial and temporal variations of ecosystem, and its services during the period 2000-2015 and significance identification were analysed by using the methods of remote sensing, GIS and model simulation. The results showed that: (1) Area with extremely important ecosystem services accounted for approximately 51.4% of the SNP's total area, of which extreme importance water regulation, soil conservation and sand fixation regions contributed 15.3%, 13.7% and 22.4%, respectively. (2) The SNP had formed a spatial pattern of ecosystem services with water regulation as core in the eastern part, soil conservation as core in the central part and sand fixation as core in the western part. (3) For the period 2000-2015, water regulation service generally improved in the SNP. Soil conservation service also improved overall; and sand fixation service exhibited a decreasing trend due to reduction in wind speed and vegetation coverage. (4) Climate warming and humidification, combined with the implementation of ecological protection project in the SNP were the primary reasons for ecosystem services improvement. However, grassland degradation had not yet been fundamentally suppressed, and vegetation coverage was still declining in regional areas. For strict protection and sustainable use of the SNP and its natural resources, overall planning and scientific layout should be paid more attention, and classification and subarea protection should be implemented based on natural ecosystem laws.
黄土高原生态系统服务供需关系的时空变化
DOI:10.11821/dlxb202111013
[本文引用: 2]
明晰生态系统服务供需匹配关系,对实现区域生态安全与社会经济可持续发展具有重要推动作用。本文以黄土高原为案例区,应用InVEST模型、ArcGIS、GeoDA等分析工具,分析黄土高原粮食供应、水源涵养、碳固存、土壤保持等服务的供需量及其匹配关系的时空变化,旨在为黄土高原国土空间格局优化提供决策依据。结果表明:1990—2018年,① 黄土高原除水源涵养服务供给量外,其他生态系统服务供需量均呈上升趋势,且各生态系统服务供给量及土壤保持服务需求量均呈“东南高、西北低”的分布特征,而粮食供应、水源涵养、碳固存服务需求量呈“四周高、中间低”的分布特征;② 各类生态系统服务供需比均呈下降趋势。空间分布上,粮食供应、碳固存服务在黄土高原四周人口密集区供不应求,而其他区域供大于求;水源涵养服务在该区西北部供不应求,但东南部供大于求;土壤保持服务供不应求区集中于鄂尔多斯高原及海北州北部;③ 各类生态系统服务供需均以低低空间匹配为主;④ 粮食供应、水源涵养、碳固存服务供需比的空间分布均以高高集聚为主,而土壤保持服务以低低集聚和高高集聚为主。除土壤保持服务供需比的空间集聚性有所增强外,其他生态系统服务均呈减弱趋势。
Spatiotemporal changes of supply and demand relationships of ecosystem services in the Loess Plateau
DOI:10.11821/dlxb202111013
[本文引用: 2]
Clarifying the match of the supply and demand of ecosystem services is crucial for promoting regional ecological security and sustainable socio-economic development. This paper takes the Loess Plateau as an example, and applies InVEST model, ArcGIS, GeoDA to analyze the spatiotemporal changes of the supply, demand and their match, which involves crop supply, water conservation, carbon sequestration and soil conservation, aiming to provide a decision-making basis for optimizing the territorial spatial pattern in the Loess Plateau. The results show that: (1) except the supply of water conservation, the supply and demands in other fields are on the rise. The supply of ecosystem services and the demand of soil conservation present the distribution pattern of "high in the southeast, but low in the northwest", while the demands of crop supply, water conservation and carbon sequestration have the distribution pattern of "high in the surroundings, while low in the middle". (2) The supply-demand ratio of various ecosystem services shows a general downward trend. In terms of spatial distribution, the demands of crop supply and carbon sequestration outstrips the supply in densely populated areas, and the supply exceeds the demands in other areas; in the northwest of the study area, the demand of water conservation outstrips the supply, while the supply exceeds the demand in the southeast; the soil conservation service in short supply areas are mainly found in the Ordos Plateau and Haibei prefecture. (3) The supply and demands of various ecosystem services are mainly low-low spatial matching. (4) The spatial distribution of the supply-demand ratio of crop supply, water conservation and carbon sequestration is mainly high-high agglomeration, while the soil conservation is mainly low-low and high-high agglomeration. Except for the enhancement of the spatial agglomeration of the supply-demand ratio of soil conservation service, the others tend to weaken.
Spatial correlation between the changes of ecosystem service supply and demand: An ecological zoning approach
Assessing the distribution of forest ecosystem services in a highly populated Mediterranean region
DOI:10.1016/j.ecolind.2018.05.076 URL [本文引用: 2]
基于生产可能性边界的黄河三角洲湿地生态系统服务权衡强度
DOI:10.31497/zrzyxb.20191203
[本文引用: 1]
提出了一种基于生产可能性边界(PPF)的湿地生态系统服务权衡强度计算方法,包括湿地生态系统服务定量评估、权衡关系判定、PPF曲线绘制和权衡强度计算四个步骤。以黄河三角洲湿地为研究对象,对保护情景、现状发展情景及开发情景三种土地利用发展模式下的主导生态系统服务进行了定量化权衡分析。结果表明:各生态系统服务间呈现显著相关关系(R<sup>2</sup>≥0.9,P<0.01),各发展情景下,栖息地质量与碳储量之间均为协同关系;物质生产与栖息地质量间均为权衡关系,排序为保护情景<基期<现状发展情景<开发情景;而对于物质生产与碳储量之间,在保护及现状发展情景下存在协同关系;而开发情景下转变为权衡关系。该模型通过灵活比较不同生态服务间权衡关系分析进行系列管理规划的方案优选,为实现区域可持续发展提供科学依据。
Determining the intensity of the trade-offs among ecosystem services based on production-possibility frontiers: Model development and a case study
DOI:10.31497/zrzyxb.20191203
[本文引用: 1]
We developed a four-step method to quantify trade-offs among ecosystem services: evaluate the targeted services at different spatial-temporal scales; identify whether a trade-off exists between pairs of ecosystem services; graph the production-possibility frontier curve; and use that curve to calculate the trade-off intensity between services. Using China's Yellow River Delta wetlands as a case study, we examined the potential trade-offs between material production, carbon storage, and habitat quality under three land-use scenarios (business-as-usual, protection, and exploitation). We found significant correlations between all pairs of the three ecosystem services. Trade-offs existed between material production and habitat quality in all scenarios, with the following order of intensity: protection (6.4) < 2015 status quo (21.8) < business as usual (22.5) < exploitation (24.3). Synergies always existed between habitat quality and carbon storage. The material production and carbon storage services were synergistic in the protection and business as usual scenarios, but they exhibited a trade-off in the exploitation scenario, with a trade-off intensity (59.9) comparable to that (60.3) in the 2015 status quo. The methodology can be flexibly used to analyze trade-offs and compare alternative management plans, thereby revealing the optimal management, which provides a scientific basis for achieving sustainable regional development and resource management.
人类活动对生态系统服务功能的影响
The impact of human activities on ecosystem services
DOI:10.11849/zrzyxb.2003.01.018
[本文引用: 1]
Ecosystem services are the foundation of man's sustainable development.But when human take advantages of many kinds of ecosystem services in providing natural resources and living environment,they also affected ecosystem services intensively.Although a part of human activities are helpful to stabilize and improve ecosystem services,more of them result in a series of eco-environmental crises and disasters that endanger man's survival and development.The damage of ecosystem services due to anthropogenic effects and its consequence are increasingly becoming outstanding problems in the world.The impact of human activities on ecosystem ser-vices has received much attention of human society at present.It is urgent to make clear the de-gree and ecological mechanism that human activities impact ecosystem services.The patterns and mechanisms and changing trend of ecosystem services affected by human activities were ex-plored in this paper.The impacts of human activities on ecosystem services include negative effects and positive effects.The former weaken ecosystem services through changing habitat and changing ecosystem structure and changing biogeochemical cycle.The main patterns include land reclamation,ur-banization,industrialization,grazing,hunting,international trade,agriculture and so on.The lat-ter play a significant role in improving eco-environment condition.The study of these passive factors,such as ecosystem management,ecological engineering,ecological restoration and reha-bilitation,ecological planning and evaluation,is also undertaking in a more and more deep-going way and has become the hot spot of ecological research.Although many researchers have carried out substantial studies on the impact of human ac-tivities on ecosystem services,much work still need to be conducted in the formation mechanism of ecosystem services,the threshold of ecosystems in bearing the human interference and the simulation and predication of human impacting ecosystem services.These problems were posed in this paper.
人类活动影响下的青海湖流域生态系统服务空间格局
DOI:10.7522/j.issn.1000-0240.2019.0531
[本文引用: 1]
人类活动改变生态格局和变化,进而影响生态系统服务。因此,探讨人类活动影响下的生态系统服务空间格局,对于区域生态安全、可持续发展和人类福祉等至关重要。以青海湖流域为研究区,基于InVEST模型计算了流域2018年产水量、水质净化、生境质量、土壤保持和碳储量五种生态系统服务,并分析了不同生态系统服务的空间自相关性、相互关系以及人类活动影响下的空间格局。结果表明:流域生境质量整体较好,土壤流失整体较小。碳储量受植被覆盖的影响存在明显空间差异。农业生态系统和城镇生态系统氮、磷负荷较高。产水量环湖区和山区差异明显;产水量、碳储量和生境质量的Moran's I分别为0.786、0.742和0.705,空间聚集性最强,氮负荷最弱;协同关系主要表现在氮负荷与磷负荷、碳储量与生境质量、产水量与土壤流失之间。权衡关系主要是生境质量与产水量和氮负荷,碳储量与产水量和土壤流失之间;碳储量、生境质量和土壤流失随人类活动的增强呈现递减趋势。氮、磷负荷随人类活动的增强呈现递增趋势。人类活动通过改变不透水表面进而影响产水量。通过高分辨率遥感影像精细化定量描述人类活动以及详细探讨人类活动影响下各生态系统服务空间格局、聚集程度,可为流域科学评价生态系统服务、生态环境保护及可持续发展提供依据。
Spatial pattern of ecosystem services under the influence of human activities in Qinghai Lake watershed
DOI:10.7522/j.issn.1000-0240.2019.0531
[本文引用: 1]
Human activities change ecological patterns and changes, which in turn affect ecosystem services. Therefore, exploring the spatial pattern of ecosystem services under the influence of human activities is crucial for regional ecological security, sustainable development and human well-being. In this paper, the Qinghai Lake watershed is used as the research area. Based on the InVEST model, five ecosystem services such as water yield, water purification, habitat quality, soil conservation and carbon storage were calculated. The spatial autocorrelation, Interrelationships and spatial patterns under the influence of human activities were analyzed. The results show that:(1) The habitat quality was generally good, and the soil loss was small. There were significant spatial differences in carbon storage, which affected by vegetation cover. The load of nitrogen and phosphorus was high in agricultural ecosystem and urban ecosystem. The difference of water yield between lake area and mountain area was obvious; (2) Moran's <i>I</i> of water yield, carbon storage and habitat quality were 0.786, 0.742 and 0.705, respectively. Their spatial aggregation was the strongest, and the nitrogen load was the weakest; (3) The synergies were mainly between nitrogen load and phosphorus load, carbon storage and habitat quality, water yield and soil loss. The trade-offs were mainly between habitat quality and water yield and nitrogen load, carbon storage and water yield and soil loss. (4) Carbon storage, habitat quality and soil loss showed a decreasing trend with the enhancement of human activities. The load of nitrogen and phosphorus increased with the increase of human activities. Human activities affect water yield by altering impermeable surfaces. This study described the human activities by high-resolution remote sensing images, and the spatial pattern and aggregation degree of ecosystem services under the influence of human activities were discussed. The purpose of this paper is to provide a basis for scientific assessment of ecosystem service, ecological environment protection and sustainable development of watershed.
Dynamic mechanism between human activities and ecosystem services: A case study of Qinghai Lake Watershed, China
人类活动对中国国家级自然保护区生态系统的影响
Effects of human activities on the ecosystems of China's National Nature Reserves
甘肃白龙江流域水源涵养服务时空格局及其影响因素
DOI:10.31497/zrzyxb.20200716
[本文引用: 1]
白龙江流域是长江上游的主要生态屏障和水源涵养区,对维系流域生态和可持续发展至关重要。以甘肃白龙江流域为例,基于参数本地化的InVEST模型对1990—2016年水源涵养时空变化及其影响因素进行分析。结果表明:流域多年平均水源涵养深度为47.50 mm,呈现先减少后回升的趋势。空间上,其高值区主要集中于迭部、文县和舟曲的中高山阴陡坡林区(平均涵养深度在该三县2500~3500 m海拔段、阴坡和半阴坡、25°以上坡段和林地高于流域的平均涵养深度);低值区主要位于宕昌和武都的中低山阳缓坡农牧区(平均涵养深度在该两县 2500 m以下海拔段、阳坡和半阳坡、25°以下坡段和耕、草地低于流域的平均涵养深度)。气候背景下,人类活动驱动的土地利用/覆被格局空间差异是影响水源涵养时空变化的重要因素,退耕还林对减缓气候变暖背景下水源涵养深度的下降具有重要意义。
Spatio-temporal pattern of water conservation and its influencing factors in Bailongjiang Watershed of Gansu
DOI:10.31497/zrzyxb.20200716 URL [本文引用: 1]
The inclusion of stakeholders and cultural ecosystem services in land management trade-off decisions using an ecosystem services approach
DOI:10.1007/s10980-015-0260-y URL [本文引用: 1]
祁连山国家公园青海片区山水林田湖草的时空分异
DOI:10.13287/j.1001-9332.202108.015
[本文引用: 2]
祁连山国家公园被确定为我国国家公园体制试点之后,对其生态环境保护、管制、修复提出了更高、更精准的要求。基于1980—2018年遥感影像数据,构建山水林田湖草空间信息格局图谱,分析祁连山国家公园青海片区一般控制区和核心保护区山水林田湖草的时空分异特征。结果表明: 研究期间,草地是公园主体景观,面积为8174.93 km<sup>2</sup>,其中,核心保护区草地面积是一般控制区的1.2倍;裸岩石质地是未利用土地的主要类型,分别占核心保护区和一般控制区未利用土地面积的86.7%和79.4%;一般控制区的林地面积大于核心保护区;核心保护区的水域面积是一般控制区的4.9倍,核心保护区90.4%的水域面积为永久性冰川雪地;旱地主要集中在一般控制区。1980—2018年间,水域面积呈降低趋势,减少186.75 km<sup>2</sup>,其中,永久性冰川雪地下降最明显,一般控制区和核心保护区分别下降12.05和175.88 km<sup>2</sup>;林地、草地整体呈增加趋势,核心保护区高、中、低覆盖度草地的变化趋势均大于一般控制区,1990—2000年变化最明显,1980—2018年一般控制区高、中覆盖度草地和核心保护区高、低覆盖度草地存在退化现象;裸岩石质地呈上升趋势,而永久性冰川雪地呈下降趋势。永久性冰川雪地和裸岩石质地是公园内变化最明显的地类,核心保护区冰川退缩速度比一般控制区退缩速度明显,其转为裸岩石质地主要发生在1980—1990和2000—2010年。
Spatial-temporal differentiation of mountain-water-forest-farmland-lake-grass system in Qinghai area of the Qilian Mountain National Park, China
祁连山国家公园生境质量时空演变
Spatial-temporal variations of habitat quality in Qilian Mountain National Park
陆地表层人类活动强度: 概念、方法及应用
DOI:10.11821/dlxb201507004
[本文引用: 3]
人类活动强度是表征人类对陆地表层影响和作用程度的综合指标。在定义陆地表层人类活动强度、建设用地当量等概念的基础上,建立了人类活动强度算法模型和土地利用/覆被类型的建设用地当量系数折算方法,并利用1984-2008年期间6个年份的土地利用数据,对中国进行了实证应用研究。结果表明:中国的人类活动强度变化大致以2000年为界,前期增长相对缓慢,后期增长明显加快,1984年全国的人类活动强度为7.63%,到2008年上升为8.54%。2008年县级单元的人类活动强度按大于27%、16%~27%、10%~16%、6%~10%和小于6%划分为高、较高、中等、较低和低5个等级,其空间分布格局大致以贺兰山—龙门山—景洪线为界分为东、西两个部分。东部是高、较高和中等类型的集中分布区,低和较低类型呈条带状分布于山地、丘陵区;西部以低和较低类型为主体,在甘肃河西走廊、青海东部及新疆天山南北坡有零散的中等和较高类型分布。
Human activity intensity of land surface: Concept, method and application in China
DOI:10.11821/dlxb201507004
[本文引用: 3]
Human activity intensity is a synthesis index for describing the effect and influence of land surface. This paper presents the concepts of human activity intensity and construction land equivalent, builds an algorithm model for human activity intensity, and establishes a method for converting different land use/land cover types into construction land equivalent as well. An application in China based on the land use data from 1984 to 2008 is also included. The results are shown as follows: (1) Human activity intensity is defined as the degree of land use, transformation and exploitation by human beings. It is an effective way to determine the construction land equivalent coefficient of different land use/land cover types by taking construction land equivalent as a basic unit and identifying the alteration of land surface natural properties caused by human activities. The application in China and correlation analysis with population density indicated that it is feasible to take the ratio of the construction land equivalent area to the total area as an indicator of human activity intensity. (2) We adopted a two-level method of eight attribute labels to construct general standard of converting different land use types into construction land equivalent, and establish a method for calculating the coefficient of construction land equivalent. We also built a coefficient table for constructing land equivalent of 49 land use types based on the latest land use classification system. (3) The human activity intensity in China increased from 7.63% in 1984 to 8.54% in 2008. It could be generally divided into five levels: very high, high, medium, low and very low, according to the human activity intensity at county level in 2008, which is rated by over 27%, 16%-27%, 10%-16%, 6%-10% and below 6%. The human activity intensity in China was spatially split into eastern and western parts by the line of Helan Mountain-Longmen Mountain-Jinghong; the eastern part was characterized by the levels of very high, high and medium, while the western part was featured by the low and very low levels.
中国2015年陆地生态系统生产总值核算研究
Measuring gross ecosystem product (GEP) of 2015 for terrestrial ecosystems in China
Climate-dependence of ecosystem services in a nature reserve in Northern China
基于生态红线划定的祁连山生态保护性开发研究
Research on the development of the ecological protection of the Qilian Mountains based on ecological redline
Incorporating climate change into ecosystem service assessments and decisions: A review
DOI:10.1111/gcb.2017.23.issue-1 URL [本文引用: 1]
Natural and human impacts on ecosystem services in Guanzhong-Tianshui Economic Region of China
