
JOURNAL OF NATURAL RESOURCES >
The contribution of ecosystem water supply services in the Qinghai section of the Yellow River Basin to hydropower-based carbon reduction in the Entire Basin
Received date: 2025-05-19
Revised date: 2025-10-21
Online published: 2026-01-14
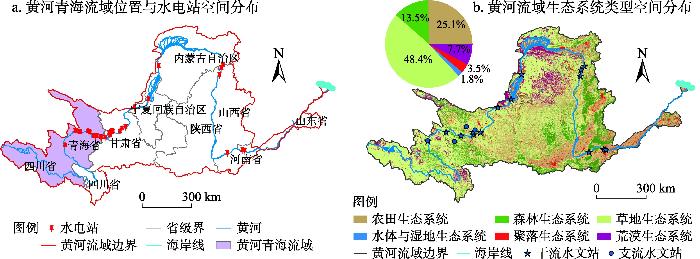
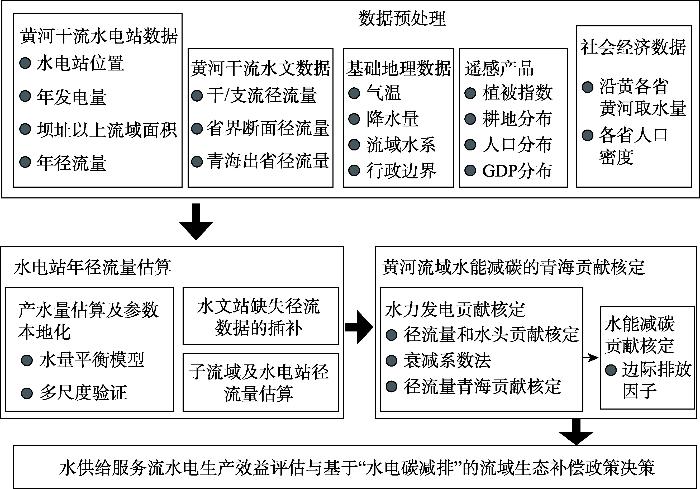
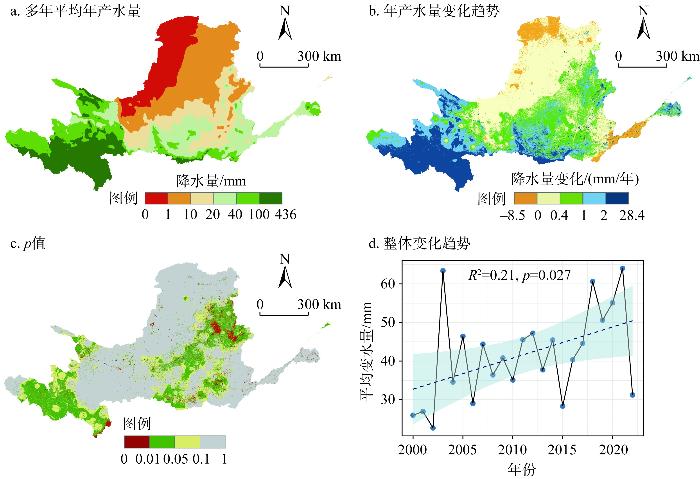
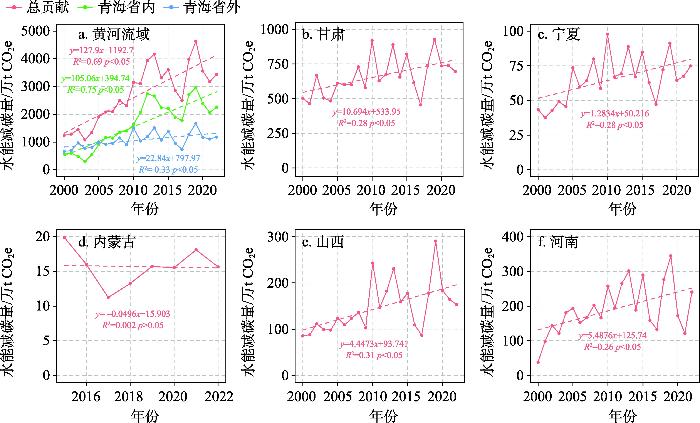
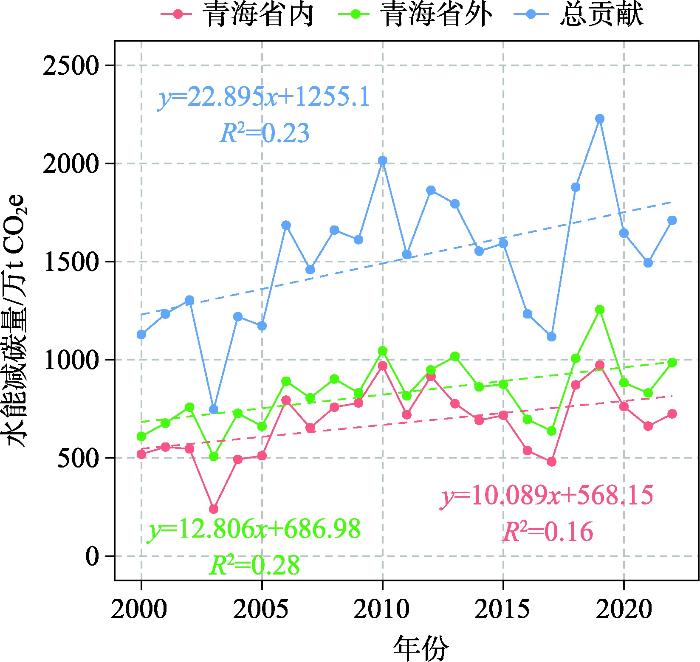
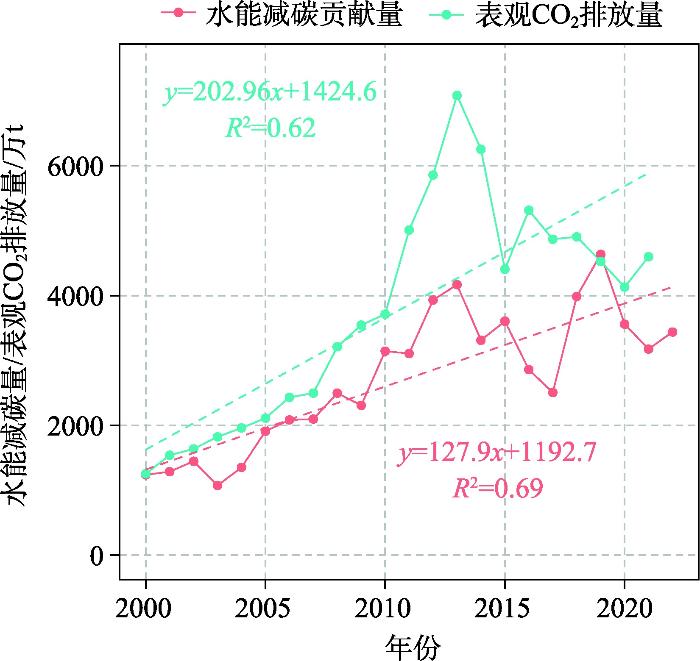
Quantifying the transregional contribution of water supply services to hydropower production and carbon mitigation is of great practical significance. This study integrated runoff observations, statistical data, and model simulations to develop an assessment framework for the contribution of the Qinghai section's water supply services to hydropower carbon reduction. Then, we analyzed the contribution of water supply to downstream hydropower carbon reduction from 2000 to 2022. The results indicated that: (1) The long-term average water supply of the Qinghai section was approximately 98.9 mm. From 2000 to 2022, the water supply showed a significant increasing trend at a rate of 2.31 mm/a. (2) The average annual amount of hydropower carbon reduction in the Qinghai Basin was 32.88 million tons of CO2e, with Qinghai's contribution reaching 25.77 million tons of CO2e/a, accounting for approximately 78.4%. (3) In the main stem of the Yellow River outside Qinghai province, the long-term average hydropower carbon reduction was 24.43 million tons of CO2e/a, of which Qinghai's contribution amounts to 9.09 million tons CO2e/a, accounting for about 37.2%. From 2000 to 2022, this contribution exhibited a slight upward trend, increasing at a rate of 0.23 million tons CO2e/a. (4) The total carbon reduction from all the hydropower stations along the Yellow River mainstream was 57.31 million tons of CO2e/a, with Qinghai contributing 34.85 million tons of CO2e/a, representing 60.8%. From 2000 to 2022, Qinghai's contribution to hydropower carbon mitigation in the Yellow River Basin increased at a rate of 1.28 million tons CO2e/a. This study provided a theoretical reference for a better understanding of the comprehensive benefits of water supply service flows. It further suggested incorporating the indicator of "hydropower's contribution to carbon emission reduction" into the accounting indicator system for watershed ecological compensation, aiming to facilitate a win-win scenario between ecological protection and economic development.
ZHANG Ting-jing , SHAO Quan-qin , DENG Li , HE Tian , GE Jin-song , YANG Fan . The contribution of ecosystem water supply services in the Qinghai section of the Yellow River Basin to hydropower-based carbon reduction in the Entire Basin[J]. JOURNAL OF NATURAL RESOURCES, 2026 , 41(2) : 516 -531 . DOI: 10.31497/zrzyxb.20260212
表1 黄河干流水电站基本信息表Table 1 Basic information of 30 hydropower stations of the Yellow River |
| 序号 | 水电站名称 | 年均发电量/亿kW·h | 开始运营时间/年 | 坝高/m | 省(自治区) |
|---|---|---|---|---|---|
| 1 | 班多水电站 | 14 | 2011 | 76 | 青海 |
| 2 | 龙羊峡水电站 | 60 | 1987 | 178 | 青海 |
| 3 | 拉西瓦水电站 | 102.23 | 2010 | 250 | 青海 |
| 4 | 尼那水电站 | 7.63 | 2003 | 43 | 青海 |
| 5 | 李家峡水电站 | 59 | 1997 | 155 | 青海 |
| 6 | 直岗拉卡水电站 | 7.62 | 2006 | 42.5 | 青海 |
| 7 | 康扬水电站 | 9.92 | 2007 | 128 | 青海 |
| 8 | 公伯峡水电站 | 51.4 | 2004 | 132 | 青海 |
| 9 | 苏只水电站 | 8.79 | 2006 | 51 | 青海 |
| 10 | 黄丰水电站 | 8.654 | 2013 | 16 | 青海 |
| 11 | 积石峡水电站 | 33.63 | 2010 | 101 | 青海 |
| 12 | 大河家水电站 | 5.591 | 2010 | 24 | 青海 |
| 13 | 寺沟峡水电站 | 9.74 | 2004 | 61 | 甘肃 |
| 14 | 刘家峡水电站 | 57 | 1974 | 147 | 甘肃 |
| 15 | 盐锅峡水电站 | 20.8 | 1961 | 57 | 甘肃 |
| 16 | 八盘峡水电站 | 11.2 | 1975 | 33 | 甘肃 |
| 17 | 河口水电站 | 3.85 | 2011 | 37 | 甘肃 |
| 18 | 柴家峡水电站 | 4.91 | 2007 | 33 | 甘肃 |
| 19 | 小峡水电站 | 9.56 | 2004 | 47 | 甘肃 |
| 20 | 大峡水电站 | 14.65 | 1996 | 72 | 甘肃 |
| 21 | 乌金峡水电站 | 6.83 | 2008 | 55 | 甘肃 |
| 22 | 沙坡头水利枢纽 | 6 | 2004 | 37 | 宁夏 |
| 23 | 青铜峡水电站 | 12.85 | 1967 | 42 | 宁夏 |
| 24 | 海勃湾水利枢纽 | 3.817 | 2014 | 16 | 内蒙古 |
| 25 | 万家寨水利枢纽 | 27.5 | 2000 | 90 | 山西 |
| 26 | 龙口水电站 | 13.02 | 2009 | 51 | 山西 |
| 27 | 天桥水电站 | 0.015 | 1977 | 23 | 山西 |
| 28 | 三门峡水利枢纽 | 17.1 | 1960 | 106 | 河南 |
| 29 | 小浪底水利枢纽 | 51 | 2002 | 154 | 河南 |
| 30 | 西霞院水利枢纽 | 5.83 | 2008 | 20 | 河南 |
表2 黄河干流各水电站与对应水文站信息表Table 2 Information of hydropower stations and corresponding hydrological stations on the mainstream of the Yellow River |
| 序号 | 水电站名称 | 对应水文站 | 汇入支流 |
|---|---|---|---|
| 1 | 班多水电站 | 唐乃亥+上村 | 大河坝河 |
| 2 | 龙羊峡水电站 | 唐乃亥 | — |
| 3 | 拉西瓦水电站 | 贵德 | — |
| 4 | 尼那水电站 | 贵德 | — |
| 5 | 李家峡水电站 | 贵德 | — |
| 6 | 直岗拉卡水电站 | 贵德 | — |
| 7 | 康扬水电站 | 贵德 | — |
| 8 | 公伯峡水电站 | 贵德+同仁 | 隆务河 |
| 9 | 苏只水电站 | 循化三 | — |
| 10 | 黄丰水电站 | 循化三 | — |
| 11 | 积石峡水电站 | 循化三 | — |
| 12 | 大河家水电站 | 循化三 | — |
| 13 | 寺沟峡水电站 | 循化三 | — |
| 14 | 刘家峡水电站 | 小川 | — |
| 15 | 盐锅峡水电站 | 上诠 | — |
| 16 | 八盘峡水电站 | 上诠+民和+享堂 | 湟水、大通河 |
| 17 | 河口水电站 | 上诠+民和+享堂+红崖子 | 庄浪河 |
| 18 | 柴家峡水电站 | 兰州 | — |
| 19 | 小峡水电站 | 兰州 | — |
| 20 | 大峡水电站 | 兰州 | — |
| 21 | 乌金峡水电站 | 兰州 | — |
| 22 | 沙坡头水利枢纽 | 下河沿 | — |
| 23 | 青铜峡水电站 | 青铜峡黄三 | — |
| 24 | 海勃湾水利枢纽 | 石嘴山 | — |
| 25 | 万家寨水利枢纽 | 万家寨四 | — |
| 26 | 龙口水电站 | 河曲二 | — |
| 27 | 天桥水电站 | 府谷 | — |
| 28 | 三门峡水利枢纽 | 三门峡七 | — |
| 29 | 小浪底水利枢纽 | 小浪底二 | — |
| 30 | 西霞院水利枢纽 | 西霞院 | — |
表3 青海省对省内水电站发电量和水能减碳量的贡献率表Table 3 Contribution rates of Qinghai to the provincial hydropower generation and hydropower-based carbon reduction |
| 序号 | 水电站 名称 | 与黄河甘肃入境断面 距离/km | 多年平均年发电量/亿kW·h | 坝高对各水电站发电的贡献/% | 径流量对各水电站发电量的贡献/% | 青海贡献 | ||||
|---|---|---|---|---|---|---|---|---|---|---|
| 青海 | 甘肃和四川 | 总和 | 发电量 /亿kW·h | 水能减碳量/万t | ||||||
| 1 | 班多 | 194.7 | 14.1 | 22.0 | 54.9 | 23.1 | 76.9 | 10.8 | 96.8 | |
| 2 | 龙羊峡 | 315.1 | 60.0 | 24.7 | 53.4 | 21.9 | 78.1 | 46.9 | 418.6 | |
| 3 | 拉西瓦 | 342.9 | 102.2 | 25.5 | 52.2 | 22.3 | 77.7 | 79.4 | 714.1 | |
| 4 | 尼那 | 359.9 | 7.6 | 19.3 | 57.9 | 22.8 | 77.2 | 5.9 | 52.6 | |
| 5 | 李家峡 | 414.3 | 59.0 | 24.3 | 54.5 | 21.2 | 78.8 | 46.5 | 400.1 | |
| 6 | 直岗拉卡 | 430.5 | 7.6 | 18.8 | 58.7 | 22.5 | 77.5 | 5.9 | 52.8 | |
| 7 | 康扬 | 445.9 | 9.9 | 24.1 | 54.8 | 21.1 | 78.9 | 7.8 | 70.0 | |
| 8 | 公伯峡 | 479.4 | 51.4 | 23.6 | 55.1 | 21.4 | 78.7 | 40.5 | 363.7 | |
| 9 | 苏只 | 493.2 | 8.8 | 20.1 | 60.5 | 19.5 | 80.6 | 7.1 | 62.5 | |
| 10 | 黄丰 | 512.2 | 8.7 | 15.3 | 61.5 | 23.2 | 76.8 | 6.7 | 59.5 | |
| 11 | 积石峡 | 524.4 | 33.6 | 23.3 | 56.9 | 19.8 | 80.2 | 26.9 | 238.8 | |
| 12 | 大河家 | 533.1 | 5.6 | 16.9 | 60.9 | 22.2 | 77.8 | 4.4 | 38.9 | |
表4 青海省对省外水电站发电量和水能减碳量的贡献率表Table 4 Qinghai province's contribution rates to out-of-province hydropower generation and hydropower-based carbon reduction |
| 序号 | 水电站名称 | 与黄河青海省出境断面 距离/km | 多年平均年发电量 /亿kW·h | 坝高对各水电站发电的 贡献/% | 径流量对各水电站发电量的贡献/% | 青海贡献 | |||
|---|---|---|---|---|---|---|---|---|---|
| 青海 | 其他省 (自治区) | 发电量 /亿kW·h | 水能减 碳量/万t | ||||||
| 1 | 寺沟峡 | 1.3 | 9.7 | 20.7 | 59.4 | 19.9 | 5.8 | 51.4 | |
| 2 | 刘家峡 | 44.3 | 55.8 | 23.8 | 50.4 | 25.8 | 28.1 | 248.4 | |
| 3 | 盐锅峡 | 76.3 | 16.7 | 20.3 | 49.4 | 30.3 | 8.2 | 73.3 | |
| 4 | 八盘峡 | 91.8 | 11.0 | 18.1 | 45.3 | 36.6 | 5.0 | 44.2 | |
| 5 | 河口 | 103.4 | 3.9 | 18.1 | 40.9 | 41.1 | 1.6 | 14.0 | |
| 6 | 柴家峡 | 128.6 | 4.9 | 17.5 | 39.1 | 43.4 | 1.9 | 17.0 | |
| 7 | 小峡 | 179.6 | 9.6 | 18.9 | 37.6 | 43.5 | 3.6 | 32.5 | |
| 8 | 大峡 | 199.2 | 14.7 | 21.4 | 38.1 | 40.5 | 5.6 | 50.1 | |
| 9 | 乌金峡 | 229.0 | 6.8 | 19.7 | 36.5 | 43.8 | 2.5 | 22.7 | |
| 10 | 沙坡头 | 445.5 | 6.0 | 18.1 | 39.5 | 42.4 | 2.4 | 20.6 | |
| 11 | 青铜峡 | 579.5 | 10.4 | 19.2 | 39.4 | 41.4 | 4.1 | 36.0 | |
| 12 | 海勃湾 | 807.8 | 3.8 | 15.1 | 34.7 | 50.3 | 1.3 | 12.3 | |
| 13 | 万家寨 | 1496.1 | 27.5 | 22.5 | 35.4 | 42.1 | 9.7 | 91.2 | |
| 14 | 龙口 | 1519.4 | 13.0 | 19.9 | 35.2 | 44.9 | 4.6 | 42.5 | |
| 15 | 天桥 | 1571.8 | 6.1 | 15.6 | 33.5 | 50.9 | 2.0 | 18.9 | |
| 16 | 三门峡 | 2305.6 | 17.1 | 23.2 | 22.6 | 54.2 | 3.9 | 34.2 | |
| 17 | 小浪底 | 2451.6 | 51.0 | 23.9 | 21.6 | 54.5 | 11.0 | 95.9 | |
| 18 | 西霞院 | 2477.5 | 5.8 | 15.9 | 23.3 | 60.8 | 1.4 | 11.7 | |
| [1] |
|
| [2] |
|
| [3] |
李双成, 张才玉, 刘金龙, 等. 生态系统服务权衡与协同研究进展及地理学研究议题. 地理研究, 2013, 32(8): 1379-1390.
[
|
| [4] |
彭建, 胡晓旭, 赵明月, 等. 生态系统服务权衡研究进展:从认知到决策. 地理学报, 2017, 72(6): 960-973.
[
|
| [5] |
|
| [6] |
|
| [7] |
王丹妮, 郭青云, 王志浩, 等. 生态系统水供给服务空间流动研究进展. 水土保持学报, 2022, 36(3): 1-8.
[
|
| [8] |
|
| [9] |
|
| [10] |
夏沛, 彭建, 徐子涵, 等. 生态系统服务流概念内涵与量化方法. 地理学报, 2024, 79(3): 584-599.
[
|
| [11] |
|
| [12] |
陈龙, 徐丽, 于名召, 等. 水生态系统服务流研究进展. 生态学报, 2025, 45(2): 1000-1012.
[
|
| [13] |
|
| [14] |
|
| [15] |
|
| [16] |
|
| [17] |
胡鞍钢. 中国实现2030年前碳达峰目标及主要途径. 北京工业大学学报: 社会科学版, 2021, 21(3): 1-15.
[
|
| [18] |
赵荣钦, 黄贤金, 郧文聚, 等. 碳达峰碳中和目标下自然资源管理领域的关键问题. 自然资源学报, 2022, 37(5): 1123-1136.
[
|
| [19] |
IRENA. Renewable capacity statistics 2024. International Renewable Energy Agency, Abu Dhabi, 2024.
|
| [20] |
|
| [21] |
|
| [22] |
王健, 曹巍, 黄麟. 基于水供需服务流及外溢价值核算的太湖流域横向生态补偿机制. 生态学报, 2024, 44(3): 955-965.
[
|
| [23] |
隋欣, 齐晔. 黄河流域青海片生态承载力动态评价. 生态学杂志, 2007, 26(3): 406-412.
[
|
| [24] |
|
| [25] |
《中国水力发电工程》编审委员会. 中国水力发电工程:工程地质卷. 北京: 中国电力出版社, 2000.
[ Editorial Committee of China Hydropower Engineering. Hydropower Engineering in China:Engineering Geology Volume. Beijing, China Electric Power Press, 2000.]
|
| [26] |
|
| [27] |
|
| [28] |
|
| [29] |
丁磊. 黄河内蒙古段河道变迁和干流水量损失研究. 呼和浩特: 内蒙古农业大学, 2012.
[
|
| [30] |
|
| [31] |
刘文琨, 罗增良, 周鹏程, 等. 气候变化下澜沧江流域径流及水电站发电能力预测. 人民长江, 2024, 55(8): 103-113.
[
|
| [32] |
鲁帆, 杨姗姗, 严登华, 等. 气候—水文变化对水力发电的影响预估综述. 中国水利水电科学研究院学报(中英文), 2023, 21(4): 331-340.
[
|
| [33] |
王艳芬, 陈怡平, 王厚杰, 等. 黄河流域生态系统变化及其生态水文效应. 中国科学基金, 2021, 35(4): 520-528.
[
|
| [34] |
矫勇. “双碳”目标下大力推进水风光储一体化发展的现状与对策建议. 中国水利, 2025, (4): 1-6.
[
|
| [35] |
邓铭江, 明波, 李研, 等. “双碳”目标下新疆能源系统绿色转型路径. 自然资源学报, 2022, 37(5): 1107-1122.
[
|
/
| 〈 |
|
〉 |
