
JOURNAL OF NATURAL RESOURCES >
The impact of key ecological function areas on county-level ecological efficiency: An empirical analysis based on multi-period difference-in-differences model
Received date: 2025-05-06
Revised date: 2025-08-15
Online published: 2026-01-14
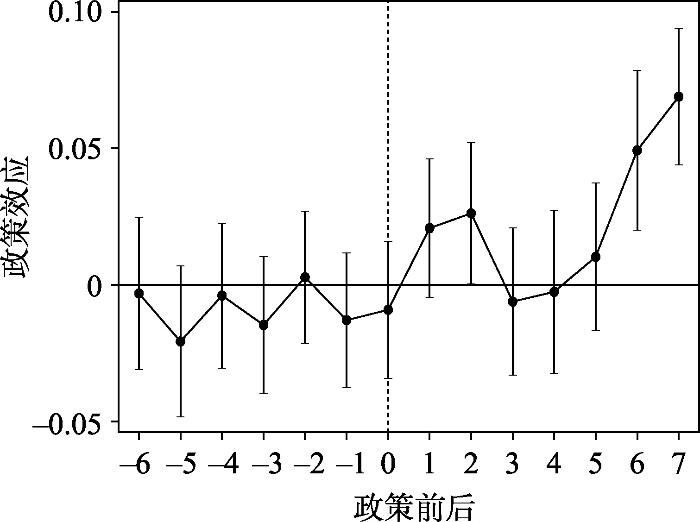
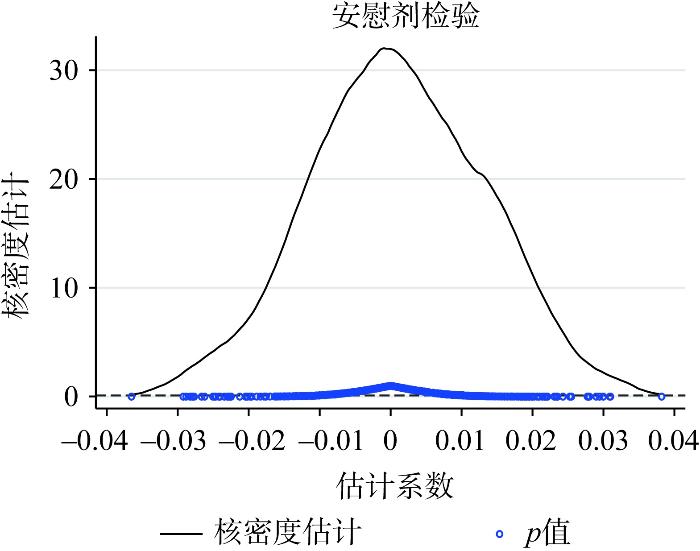
National key ecological function areas are crucial for ensuring national ecological security. A deep understanding of their influence on county-level ecological efficiency is crucial for informing policy assessment, advancing the high-quality development of national key ecological function zones, and reinforcing national ecological security barriers. Employing Chinese county-level panel data from 2005 to 2022, this study constructs a measurement system for ecological efficiency and applies a multi-period difference-in-differences method to examine how the designation of national key ecological function areas affects county-level ecological efficiency. This helps reveal the internal implementation paths of ecological function areas and ensures national ecological security. Key findings of this study are as follows: (1) Following a series of robustness checks, including parallel trend tests, placebo tests, PSM-DID, sample truncation, and controls for policy interference, the results confirmed that the implementation of the national key ecological function areas policy significantly improved ecological efficiency in the designated regions. Under fixed time and individual effects, the policy increased the ecological efficiency of the treatment group by an average of 3% compared to the control group. Industrial structure upgrading and fiscal structure adjustment are two effective paths for enhancing county-level ecological efficiency. Mediation effect analysis shows they partially mediate between national key ecological function areas and ecological efficiency. (2) Heterogeneity analysis by geographical location shows that national key ecological function areas in the eastern and central regions have a significant positive impact on local ecological efficiency, while those in the western region have a significant negative effect. Analysis by ecological function area type indicates that the establishment of areas for biodiversity maintenance, water conservation, and soil and water conservation significantly improve county-level ecological efficiency. In contrast, windbreak and sand-fixation areas exert no significant negative impact. (3) The spatial spillover effects are examined by employing a geographical distance matrix and a spatial Durbin model with both spatial and temporal fixed effects. The analysis reveals that the national key ecological function areas policy generates positive spatial spillover effects, significantly enhancing ecological efficiency in both local and neighboring counties. These effects remain robust after employing economic geography nested matrices and economic distance matrices.
DENG Guang-yao , HAN Fu-xiao . The impact of key ecological function areas on county-level ecological efficiency: An empirical analysis based on multi-period difference-in-differences model[J]. JOURNAL OF NATURAL RESOURCES, 2026 , 41(2) : 407 -424 . DOI: 10.31497/zrzyxb.20260206
表1 生态效率评价指标体系Table 1 Eco-efficiency evaluation indicator system |
| 指标类型 | 一级指标 | 二级指标 |
|---|---|---|
| 投入 | 能源投入 | 能源消费总量/百万tce |
| 资本投入 | 资本存量/万元 | |
| 劳动投入 | 年末单位从业人员人数/人 | |
| 三大产业从业人员人数/万人 | ||
| 产出 | 期望产出 | 地区生产总值/万元 |
| 归一化植被指数 | ||
| 非期望产出 | PM2.5/(μg/m3) | |
| CO2排放量/百万t | ||
| 污水排放量/万m3 |
表2 描述性统计Table 2 Results of descriptive statistics |
| 变量类型 | 变量名称 | 样本量/个 | 平均值 | 标准差 | 最小值 | 最大值 | VIF |
|---|---|---|---|---|---|---|---|
| 被解释变量 | EE | 25398 | -0.899 | 0.383 | -1.684 | 0.074 | |
| 核心解释变量 | did | 25398 | 0.147 | 0.354 | 0 | 1 | 1.28 |
| 控制变量 | PD | 25398 | 0.034 | 0.028 | 0.001 | 0.129 | 1.32 |
| UR | 25398 | 2.518 | 0.767 | 1.411 | 5.348 | 1.24 | |
| IS | 25398 | 0.424 | 0.149 | 0.095 | 0.790 | 1.40 | |
| GOV | 25398 | 0.213 | 0.143 | 0.049 | 0.828 | 2.35 | |
| IN | 25398 | 0.791 | 0.361 | 0.163 | 2.045 | 1.40 |
表3 PSM-DID回归结果Table 3 Regression results of PSM-DID |
| 变量 | 截面PSM | 逐年PSM |
|---|---|---|
| EE | EE | |
| did | 0.021*** | 0.015** |
| (0.006) | (0.006) | |
| 常数项 | -0.744*** | -0.769*** |
| (0.021) | (0.021) | |
| 控制变量 | YES | YES |
| 个体效应 | YES | YES |
| 时间效应 | YES | YES |
| 样本量/个 | 23795 | 22828 |
| R2 | 0.765 | 0.764 |
注:括号内为稳健标准误,***P<0.01、**P<0.05,下同。 |
表4 剔除部分样本Table 4 Excludes some samples |
| 变量 | (1) | (2) |
|---|---|---|
| EE | EE | |
| did | 0.034*** | 0.028*** |
| (0.006) | (0.006) | |
| 常数项 | -0.883*** | -0.711*** |
| (0.002) | (0.021) | |
| 控制变量 | NO | YES |
| 个体效应 | YES | YES |
| 时间效应 | YES | YES |
| 样本量/个 | 23472 | 23472 |
| R2 | 0.725 | 0.764 |
表5 排除其他政策干扰Table 5 Excludes other policy interferences |
| 变量 | 低碳城市 | 创新型城市 |
|---|---|---|
| EE | EE | |
| did | 0.030*** | 0.028*** |
| (0.006) | (0.006) | |
| 低碳城市 | 0.001 | |
| (0.005) | ||
| 创新型城市 | -0.046*** | |
| (0.006) | ||
| 常数项 | -0.740*** | -0.735*** |
| (0.019) | (0.019) | |
| 控制变量 | YES | YES |
| 个体效应 | YES | YES |
| 时间效应 | YES | YES |
| 样本量/个 | 25398 | 25398 |
| R2 | 0.769 | 0.770 |
表6 基准回归结果Table 6 Benchmark regression results |
| 变量 | (1) | (2) | (3) | (4) |
|---|---|---|---|---|
| EE | EE | EE | EE | |
| did | 0.137*** | 0.132*** | 0.036*** | 0.030*** |
| (0.007) | (0.008) | (0.006) | (0.006) | |
| PD | -1.100*** | -0.838*** | ||
| (0.106) | (0.320) | |||
| UR | -0.040*** | -0.021*** | ||
| (0.004) | (0.004) | |||
| IS | 0.331*** | 0.400*** | ||
| (0.020) | (0.022) | |||
| GOV | 0.520*** | -0.083*** | ||
| (0.029) | (0.028) | |||
| IN | -0.347*** | -0.294*** | ||
| (0.009) | (0.006) | |||
| 常数项 | -0.919*** | -0.757*** | -0.904*** | -0.740*** |
| (0.003) | (0.015) | (0.002) | (0.019) | |
| 个体效应 | NO | NO | YES | YES |
| 时间效应 | NO | NO | YES | YES |
| 样本量/个 | 25398 | 25398 | 25398 | 25398 |
| R2 | 0.016 | 0.100 | 0.730 | 0.769 |
表7 中介效应检验Table 7 Test of mediating effect |
| 变量 | 产业结构升级 | 财政结构调整 | |||||
|---|---|---|---|---|---|---|---|
| EE | ISU | EE | EE | FSA | EE | ||
| did | 0.030*** | 0.129*** | 0.028*** | 0.030*** | 0.012*** | 0.027*** | |
| (0.006) | (0.027) | (0.006) | (0.006) | (0.002) | (0.006) | ||
| ISU | 0.018*** | ||||||
| (0.003) | |||||||
| FSA | 0.279*** | ||||||
| (0.041) | |||||||
| 常数项 | -0.740*** | 3.023*** | -0.794*** | -0.740*** | -0.010 | -0.737*** | |
| (0.019) | (0.092) | (0.021) | (0.019) | (0.007) | (0.019) | ||
| 控制变量 | YES | YES | YES | YES | YES | YES | |
| 个体效应 | YES | YES | YES | YES | YES | YES | |
| 时间效应 | YES | YES | YES | YES | YES | YES | |
| 样本量/个 | 25398 | 25398 | 25398 | 25398 | 25398 | 25398 | |
| R2 | 0.769 | 0.653 | 0.770 | 0.769 | 0.927 | 0.770 | |
表8 基于地理空间区位的异质性分析Table 8 Heterogeneity analysis based on geographical spatial location |
| 变量 | 东部地区 | 中部地区 | 西部地区 |
|---|---|---|---|
| EE | EE | EE | |
| did | 0.084*** | 0.034*** | -0.038*** |
| (0.012) | (0.009) | (0.010) | |
| 常数项 | -0.901*** | -0.646*** | -0.772*** |
| (0.036) | (0.031) | (0.034) | |
| 控制变量 | YES | YES | YES |
| 个体效应 | YES | YES | YES |
| 时间效应 | YES | YES | YES |
| 样本量/个 | 8208 | 9378 | 7812 |
| R2 | 0.789 | 0.697 | 0.811 |
表9 基于生态功能区类型的异质性分析Table 9 Heterogeneity analysis based on the types of ecological function zones |
| 变量 | 水土保持型 | 水源涵养型 | 生物多样性维护型 | 防风固沙型 |
|---|---|---|---|---|
| EE | EE | EE | EE | |
| did | 0.040*** | 0.033*** | 0.028** | -0.019 |
| (0.012) | (0.008) | (0.013) | (0.019) | |
| 常数项 | -0.800*** | -0.767*** | -0.787*** | -0.798*** |
| (0.022) | (0.021) | (0.022) | (0.022) | |
| 控制变量 | YES | YES | YES | YES |
| 个体效应 | YES | YES | YES | YES |
| 时间效应 | YES | YES | YES | YES |
| 样本量/个 | 20412 | 21978 | 19944 | 19224 |
| R2 | 0.757 | 0.758 | 0.756 | 0.746 |
表10 县域生态效率的Moran's ITable 10 Moran's I of ecological efficiency in county-level areas |
| 年份 | 莫兰指数 | Z | P | 年份 | 莫兰指数 | Z | P |
|---|---|---|---|---|---|---|---|
| 2005 | 0.449 | 19.825 | 0.000 | 2014 | 0.545 | 24.082 | 0.000 |
| 2006 | 0.498 | 21.993 | 0.000 | 2015 | 0.525 | 23.198 | 0.000 |
| 2007 | 0.451 | 19.928 | 0.000 | 2016 | 0.534 | 23.574 | 0.000 |
| 2008 | 0.454 | 20.056 | 0.000 | 2017 | 0.534 | 23.615 | 0.000 |
| 2009 | 0.481 | 21.269 | 0.000 | 2018 | 0.535 | 23.621 | 0.000 |
| 2010 | 0.474 | 20.966 | 0.000 | 2019 | 0.565 | 24.959 | 0.000 |
| 2011 | 0.482 | 21.308 | 0.000 | 2020 | 0.502 | 22.164 | 0.000 |
| 2012 | 0.474 | 20.937 | 0.000 | 2021 | 0.501 | 22.141 | 0.000 |
| 2013 | 0.510 | 22.516 | 0.000 | 2022 | 0.478 | 21.120 | 0.000 |
表11 空间模型检验Table 11 Spatial model inspection |
| 检验方法 | 检验名称 | 统计值 | P值 |
|---|---|---|---|
| Wald检验 | Wald-SDM/SAR | 461.250 | 0.000 |
| Wald-SDM/SEM | 213.150 | 0.000 | |
| LR检验 | LR-SDM/SAR | 454.100 | 0.000 |
| LR-SDM/SEM | 213.350 | 0.000 | |
| Hausman | Hausman test | 1178.910 | 0.000 |
| 固定效应检验 | LR-both/ind | 805.970 | 0.000 |
| LR-both/time | 29159.170 | 0.000 |
表12 空间杜宾模型估计结果Table 12 Estimation results of the spatial Durbin model |
| 变量 | 地理距离矩阵 | 经济地理嵌套矩阵 | 经济距离矩阵 |
|---|---|---|---|
| did | 0.0056 | 0.0042 | 0.0241*** |
| (0.006) | (0.006) | (0.005) | |
| W×did | 0.0246*** | 0.194*** | 0.0204 |
| (0.008) | (0.075) | (0.018) | |
| rho | 0.385*** | 0.964*** | 0.0880*** |
| (0.006) | (0.008) | (0.015) | |
| 0.0276*** | 0.0312*** | 0.0335*** | |
| (0.000) | (0.000) | (0.000) | |
| 个体效应 | YES | YES | YES |
| 时间效应 | YES | YES | YES |
| 样本量/个 | 25398 | 25398 | 25398 |
| R2 | 0.056 | 0.001 | 0.032 |
表13 空间效应分解结果Table 13 Decomposition results of spatial effects |
| 变量 | 直接效应 | 间接效应 | 总效应 |
|---|---|---|---|
| did | 0.0099* | 0.0394*** | 0.0493*** |
| (0.006) | (0.011) | (0.012) | |
| PD | -0.0206 | -2.116*** | -2.136*** |
| (0.276) | (0.512) | (0.563) | |
| UR | -0.0086*** | -0.0179*** | -0.0265*** |
| (0.003) | (0.006) | (0.006) | |
| IS | 0.238*** | 0.389*** | 0.627*** |
| (0.019) | (0.035) | (0.038) | |
| GOV | -0.0806*** | -0.0155 | -0.096** |
| (0.023) | (0.041) | (0.044) | |
| IN | -0.301*** | 0.0247** | -0.276*** |
| (0.005) | (0.010) | (0.012) |
注:*P<0.1。 |
| [1] |
涂涛, 朱庆莹, 梅昀, 等. 中国省域生态效率时空格局变化及优化策略研究. 水土保持研究, 2022, 29(2): 380-388.
[
|
| [2] |
张秋凤, 肖义, 唐晓, 等. 中国五大城市群生态效率的演变及其影响因素. 经济地理, 2022, 42(11): 54-63.
[
|
| [3] |
邱兆林. 长江经济带与黄河流域生态效率差异及影响因素分析. 当代经济管理, 2022, 44(6): 39-49.
[
|
| [4] |
孙华平, 陈婷婷, 胡诗宇. 绿色生态效率时空分异特征及其影响因素研究: 基于长三角城市群的实证分析. 生态经济, 2024, 40(11): 155-165.
[
|
| [5] |
杨家辉, 刘强, 徐生霞. 创新型城市的设立是否提升了绿色生态效率. 经济体制改革, 2023, (4): 184-192.
[
|
| [6] |
郭炳南, 唐利, 张浩. 城市低碳治理对生态效率的影响: 基于低碳城市试点政策的准自然实验. 华东经济管理, 2023, 37(8): 82-90.
[
|
| [7] |
|
| [8] |
王圣云, 林玉娟. 中国区域农业生态效率空间演化及其驱动因素: 水足迹与灰水足迹视角. 地理科学, 2021, 41(2): 290-301.
[
|
| [9] |
侯孟阳, 席增雷, 张晓, 等. 国家重点生态功能区的环境质量与经济增长效应评估. 中国人口·资源与环境, 2023, 33(1): 24-37.
[
|
| [10] |
杨喆, 李晴晴, 薛文晧. 国家重点生态功能区设立对农村居民收入的影响: 基于PSM-DID的实证分析. 资源科学, 2023, 45(1): 144-157.
[
|
| [11] |
谢婷婷. 国家重点生态功能区如何实现环境保护与经济发展的平衡. 世界经济, 2024, 47(5): 34-63.
[
|
| [12] |
杨秋月, 刘萧萧, 李佐军. 生态转移支付的碳减排效应研究: 基于国家重点生态功能区转移支付的经验研究. 财经研究, 2024, 50(4): 34-48.
[
|
| [13] |
曹鸿杰, 卢洪友, 祁毓. 分权对国家重点生态功能区转移支付政策效果的影响研究. 财经论丛, 2020, (5): 21-31.
[
|
| [14] |
陈帅, 王智鹏, 侯孟阳, 等. 国家重点生态功能区转移支付的效应评估: 基于经济发展、公共服务供给与生态环境治理视角. 中国人口·资源与环境, 2024, 34(10): 125-136.
[
|
| [15] |
范庆泉, 刘惠, 刘祎男, 等. 京津冀生态补偿是否具有“增绿”效应: 来自国家重点生态功能区转移支付重点补助的证据. 经济学报, 2024, 11(1): 416-444.
[
|
| [16] |
谭洁. 广西重点生态功能区产业准入负面清单制度赋能乡村产业振兴: 机理、挑战与对策: 民族事务治理法治化系列研究之一. 广西民族研究, 2022, (5): 180-189.
[
|
| [17] |
李国平, 马艺鸣, 曾先峰. 国家重点生态功能区绿色发展水平评价: 以陕西省为例. 统计与决策, 2024, 40(4): 129-133.
[
|
| [18] |
林诗贤, 祁毓. 区位导向型生态环境政策的激励效应及策略选择. 财政研究, 2021, (6): 85-103.
[
|
| [19] |
鲁玮骏, 张超. 生态保护补偿有助于缩小城乡收入差距吗? 基于国家重点生态功能区转移支付的经验证据. 财政研究, 2023, (7): 82-98.
[
|
| [20] |
杨颜嘉, 管睿, 田明. 国家重点生态功能区的设立能否推动区域高质量发展. 宏观经济研究, 2024, (6): 114-127.
[
|
| [21] |
|
| [22] |
朱靖宇, 崔冉. 绿色金融推动区域生态效率提升的机制与实践效果研究. 宏观经济研究, 2024, (10): 27-38.
[
|
| [23] |
张军, 吴桂英, 张吉鹏. 中国省际物质资本存量估算: 1952—2000. 经济研究, 2004, 39(10): 35-44.
[
|
| [24] |
金声甜, 李小花. 国家重点生态功能区设立对县域碳排放强度的影响: 以长江经济带为例. 经济地理, 2023, 43(9): 139-147.
[
|
| [25] |
刘蒙罢, 张安录, 文高辉. 长江中下游粮食主产区耕地利用生态效率区域差异与空间收敛. 自然资源学报, 2022, 37(2): 477-493.
[
|
| [26] |
|
| [27] |
丁斐, 庄贵阳. 国家重点生态功能区设立是否促进了经济发展: 基于双重差分法的政策效果评估. 中国人口·资源与环境, 2021, 31(10): 19-28.
[
|
| [28] |
白俊红, 张艺璇, 卞元超. 创新驱动政策是否提升城市创业活跃度: 来自国家创新型城市试点政策的经验证据. 中国工业经济, 2022, (6): 61-78.
[
|
| [29] |
鲍丙飞, 曾子洋, 肖文海, 等. 重点生态功能区转移支付对生态产业发展的空间效应: 以江西省80个县为例. 自然资源学报, 2022, 37(10): 2720-2735.
[
|
/
| 〈 |
|
〉 |