
JOURNAL OF NATURAL RESOURCES >
Identification of the evolutionary relationship between green transformation of arable land use and the intensity of arable land carbon emissions in China's major grain-producing areas
Received date: 2024-09-09
Revised date: 2025-01-08
Online published: 2025-09-28
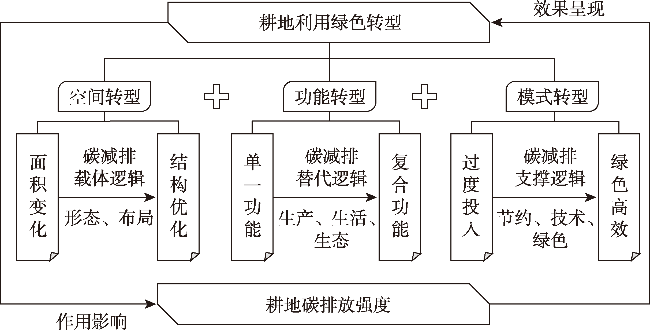
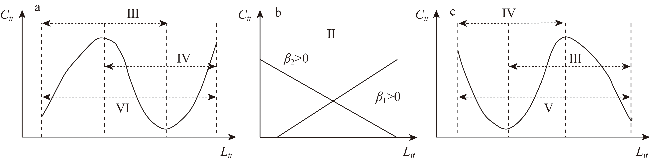
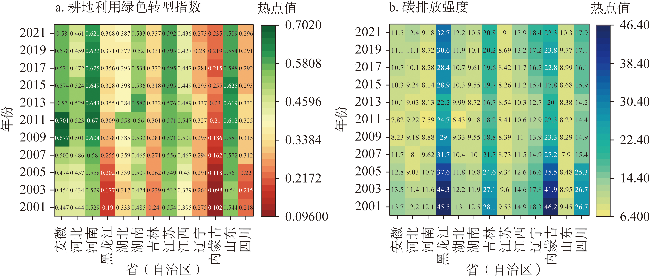
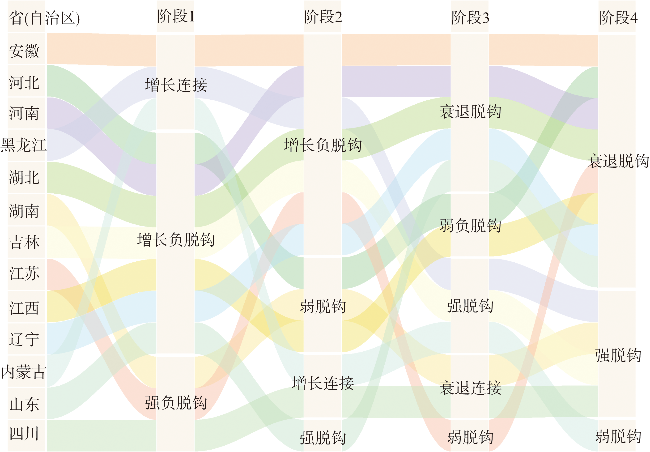
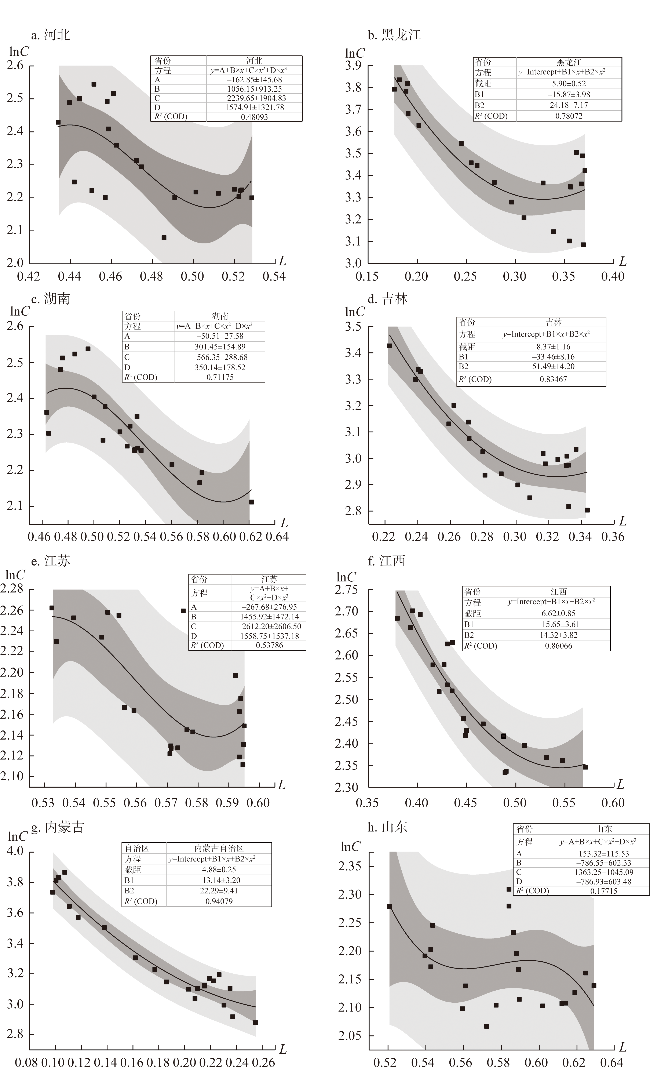
In the context of green and low-carbon agricultural development, the green transformation of arable land use is crucial to the reduction of arable land carbon emissions. The dynamic evolution relationship between the green transformation of arable land use and the carbon emission intensity of arable land in China's major grain-producing areas from 2001 to 2021 was identified by vertical and horizontal grading method, Tapio decoupling model and EKC test method. The study found that: (1) From 2001 to 2021, the overall fluctuation of green transformation level of arable land use in major grain-producing areas increased, and the carbon emission intensity of arable land showed a "U"-shaped trend. (2) There were significant differences in the decoupling state between the green transformation level of arable land use and carbon emission intensity at each stage. A few provincial-level regions showed a gradual transition from negative decoupling to an ideal state. (3) There was a nonlinear relationship between green transformation of arable land use and carbon emission intensity. During the study period, the EKC fitting curves of green transformation of arable land use and carbon emissions in eight provincial-level regions exhibited three characteristics: "positive U", "positive N" and "inverted N". Research shows that, it is essential to focus on the carbon emission reduction effect of green transformation of arable land use in the future, stabilize the decoupling trend of green transformation of arable land use and carbon emission intensity, and promote the green transformation of agriculture in major grain-producing areas.
YANG Yu , GAO Jia . Identification of the evolutionary relationship between green transformation of arable land use and the intensity of arable land carbon emissions in China's major grain-producing areas[J]. JOURNAL OF NATURAL RESOURCES, 2025 , 40(10) : 2718 -2734 . DOI: 10.31497/zrzyxb.20251009
表1 脱钩类型判定标准Table 1 Criteria for decoupling types |
| 脱钩类型 | 判定标准 |
|---|---|
| 强脱钩 | ΔCt<0, , Ut<0 |
| 弱脱钩 | , , 0< Ut≤0.8 |
| 增长连接 | , , 0.8< Ut≤1.2 |
| 增长负脱钩 | , , |
| 强负脱钩 | , ΔLt<0, Ut<0 |
| 弱负脱钩 | ΔCt<0, ΔLt<0, 0< Ut≤0.8 |
| 衰退连接 | ΔCt<0, ΔLt<0, 0.8< Ut≤1.2 |
| 衰退脱钩 | ΔCt<0, ΔLt<0, |
表2 耕地利用绿色转型评价指标体系Table 2 The evaluation indicators of green transformation of arable land use |
| 目标层及权重 | 因素层 | 指标层 | 指标解释 | 属性 | 参考文献 |
|---|---|---|---|---|---|
| 空间转型(0.3244) | 数量形态(0.2872) | 人均耕地面积/(hm2/人) | 耕地面积/地区总人口 | + | [7,19] |
| 人均农作物播种面积/(hm2/人) | 农作物播种面积/地区总人口 | + | [17,24] | ||
| 空间结构(0.7128) | 复种指数/% | 农作物播种面积/耕地总面积 | + | [17,30] | |
| 土地垦殖率/% | 耕地面积/土地总面积 | + | [7,30] | ||
| 功能转型(0.3236) | 生产功能(0.5043) | 粮食作物播种比/% | 粮食作物播种面积/耕地总面积 | + | [23,30] |
| 地均粮食产量/(t/hm2) | 粮食总产量/耕地总面积 | + | [17,30] | ||
| 生活功能(0.2411) | 地均乡村人口/(人/hm2) | 乡村人口/耕地总面积 | + | [23,31] | |
| 粮食保障率/% | 粮食总产量/(常住人口×400 kg) | + | [18,30] | ||
| 生态功能(0.2546) | 地均化肥污染/(t/hm2) | 化肥施用总量/耕地面积 | - | [17,19] | |
| 人均耕地生态承载力 | 人均耕地×耕地均衡因子×耕地产量因子 ② | + | [18] | ||
| 模式转型(0.3520) | 资源节约(0.3795) | 有效灌溉率/% | 有效灌溉面积/耕地总面积 | + | [7,30] |
| 技术进步(0.3945) | 耕种收综合机械化水平 /(kW/hm2) | 农业机械总动力/耕地总面积 | + | [17,30] | |
| 绿色生产(0.2260) | 地均农药使用/(t/hm2) | 农药投入量/耕地总面积 | - | [19] | |
| 地均塑料薄膜使用量/(t/hm2) | 塑料薄膜使用量/耕地总面积 | - | [17] |
注:括号内数据为目标层、因素层权重。 |
表3 评价测度结果比较Table 3 Comparison of evaluation measure results |
| 省(自治区) | 2001年 | 2011年 | 2021年 | |||||
|---|---|---|---|---|---|---|---|---|
| 替换前 | 替换后 | 替换前 | 替换后 | 替换前 | 替换后 | |||
| 安徽 | 0.4471 | 0.4426 | 0.7010 | 0.6989 | 0.5801 | 0.5812 | ||
| 河北 | 0.4445 | 0.4312 | 0.5229 | 0.5311 | 0.4610 | 0.4701 | ||
| 河南 | 0.5292 | 0.5228 | 0.6703 | 0.6652 | 0.6210 | 0.6179 | ||
| 黑龙江 | 0.1900 | 0.1913 | 0.3086 | 0.3157 | 0.3682 | 0.3427 | ||
| 湖北 | 0.3326 | 0.3288 | 0.5582 | 0.5613 | 0.3869 | 0.3904 | ||
| 湖南 | 0.4853 | 0.4646 | 0.5605 | 0.5596 | 0.5334 | 0.5211 | ||
| 吉林 | 0.2403 | 0.2417 | 0.3011 | 0.3103 | 0.3366 | 0.3207 | ||
| 江苏 | 0.5542 | 0.5375 | 0.5711 | 0.5704 | 0.5922 | 0.5795 | ||
| 江西 | 0.3949 | 0.3915 | 0.5475 | 0.5413 | 0.4355 | 0.4380 | ||
| 辽宁 | 0.2753 | 0.2814 | 0.3269 | 0.3319 | 0.2732 | 0.2714 | ||
| 内蒙古 | 0.1025 | 0.1163 | 0.2101 | 0.2285 | 0.2351 | 0.2314 | ||
| 山东 | 0.5437 | 0.5322 | 0.6120 | 0.5987 | 0.5888 | 0.5902 | ||
| 四川 | 0.2183 | 0.2235 | 0.3247 | 0.3195 | 0.2957 | 0.3021 | ||
| 显著性(双尾) | 0.944 | 0.983 | 0.941 | |||||
表5 粮食主产区耕地利用绿色转型与耕地碳排放强度脱钩系数Table 5 Decoupling coefficient of green transformation of arable land use and arable land carbon emission intensity in major grain-producing areas |
| 省(自治区) | 2001—2006年 | 2006—2011年 | 2011—2016年 | 2016—2021年 | |||||||||||
|---|---|---|---|---|---|---|---|---|---|---|---|---|---|---|---|
| ΔC | ΔL | U | ΔC | ΔL | U | ΔC | ΔL | U | ΔC | ΔL | U | ||||
| 安徽 | 0.092 | 0.077 | 1.196 | 0.604 | 0.455 | 1.327 | -0.255 | -0.170 | 1.497 | -0.083 | -0.003 | 29.081 | |||
| 河北 | 0.322 | 0.014 | 23.793 | 0.001 | 0.161 | 0.007 | -0.070 | -0.092 | 0.760 | -0.200 | -0.029 | 6.916 | |||
| 河南 | 0.174 | 0.064 | 2.742 | 0.357 | 0.191 | 1.867 | -0.070 | -0.058 | 1.211 | -0.112 | -0.017 | 6.587 | |||
| 黑龙江 | 0.316 | 0.289 | 1.093 | 0.400 | 0.260 | 1.535 | -0.131 | 0.153 | -0.859 | -0.131 | 0.035 | -3.762 | |||
| 湖北 | 0.144 | 0.032 | 4.447 | 0.764 | 0.626 | 1.221 | -0.383 | -0.298 | 1.285 | -0.146 | -0.013 | 11.217 | |||
| 湖南 | 0.176 | -0.045 | -3.931 | 0.156 | 0.209 | 0.748 | -0.041 | -0.051 | 0.803 | -0.087 | 0.003 | -28.279 | |||
| 吉林 | 0.220 | 0.128 | 1.723 | 0.269 | 0.111 | 2.422 | -0.071 | 0.098 | -0.722 | -0.060 | 0.018 | -3.320 | |||
| 江苏 | 0.026 | -0.037 | -0.694 | 0.105 | 0.070 | 1.509 | 0.011 | 0.039 | 0.272 | -0.075 | -0.002 | 35.022 | |||
| 江西 | 0.202 | 0.069 | 2.952 | 0.169 | 0.297 | 0.569 | -0.066 | -0.178 | 0.371 | -0.181 | -0.032 | 5.707 | |||
| 辽宁 | 0.133 | 0.035 | 3.792 | 0.248 | 0.147 | 1.684 | -0.180 | -0.130 | 1.385 | -0.144 | -0.040 | 3.623 | |||
| 内蒙古 | 0.390 | 0.345 | 1.131 | 0.492 | 0.524 | 0.939 | -0.015 | 0.025 | -0.590 | 0.015 | 0.092 | 0.166 | |||
| 山东 | 0.159 | 0.029 | 5.503 | -0.009 | 0.094 | -0.099 | -0.058 | -0.037 | 1.559 | -0.009 | -0.00029 | 311.741 | |||
| 四川 | 0.090 | -0.104 | -0.863 | 0.702 | 0.660 | 1.063 | -0.092 | -0.106 | 0.869 | -0.114 | 0.018 | -6.263 | |||
表6 面板单位根分省检验结果Table 6 Test results of panel unit root provinces |
| 省份 | 变量 | 一阶差分序列 | 变量 | 一阶差分序列 | 省份 | 变量 | 一阶差分序列 | 变量 | 一阶差分序列 | |
|---|---|---|---|---|---|---|---|---|---|---|
| 安徽 | lnC | -4.079(0.0068) | L | -4.413(0.0021) | 黑龙江 | lnC | -4.180(0.0048) | L | -4.756(0.0006) | |
| 江苏 | lnC | -4.109(0.0061) | L | -5.435(0.0000) | 内蒙古 自治区 | lnC | -3.730(0.0204) | L | -4.140(0.0055) | |
| 河北 | lnC | -5.618(0.0000) | L | -4.424(0.0020) | ||||||
| 江西 | lnC | -4.802(0.0005) | L | -4.457(0.0018) | 湖北 | lnC | -4.025(0.0081) | L | -3.993(0.0090) | |
| 河南 | lnC | -3.693(0.0228) | L | -4.136(0.0056) | 山东 | lnC | -3.772(0.0180) | L | -3.923(0.0113) | |
| 辽宁 | lnC | -4.110(0.0061) | L | -5.517(0.0000) | 湖南 | lnC | -6.311(0.0000) | L | -5.069(0.0002) | |
| 吉林 | lnC | -5.61(0.0000) | L | -5.773(0.0000) | 四川 | lnC | -4.711(0.0007) | L | -5.962(0.0000) | |
注:括号内为p值。 |
| [1] |
符海月, 吴树东, 姜朋辉. 中国粮食主产区耕地绿色低碳利用转型指数构建及分区. 农业工程学报, 2023, 39(23): 238-246.
[
|
| [2] |
徐清华, 张广胜. 农业机械化对农业碳排放强度影响的空间溢出效应: 基于282个城市面板数据的实证. 中国人口·资源与环境, 2022, 32(4): 23-33.
[
|
| [3] |
游和远, 张津榕, 夏舒怡. 面向碳排放效率的多目标土地利用结构与布局优化研究: 以杭州市萧山区为例. 中国土地科学, 2023, 37(6): 74-83.
[
|
| [4] |
|
| [5] |
柯楠, 卢新海, 匡兵, 等. 碳中和目标下中国耕地绿色低碳利用的区域差异与影响因素. 中国土地科学, 2021, 35(8): 67-76.
[
|
| [6] |
柯新利. 耕地利用转型研究的创新探索: 《耕地利用的可持续集约化: 理论探索与多尺度实证》评介. 中国土地科学, 2023, 37(3): 126-128.
[
|
| [7] |
高佳, 杨宇. 东北粮食主产区耕地利用绿色转型的时空格局及驱动因素. 中国土地科学, 2023, 37(10): 114-123, 134.
[
|
| [8] |
金书秦, 张哲晰, 胡钰, 等. 中国农业绿色转型的历史逻辑、理论阐释与实践探索. 农业经济问题, 2024, (3): 4-19.
[
|
| [9] |
陈胜涛, 张开华, 张岳武. 农业碳排放绩效的测量与脱钩效应. 统计与决策, 2021, 37(22): 85-88.
[
|
| [10] |
陈德静, 王晓青, 濮励杰, 等. 城市土地利用效率时空演化及其与经济增长脱钩关系研究: 以长三角城市群为例. 长江流域资源与环境, 2023, 32(10): 2018-2031.
[
|
| [11] |
张勇, 高羽洁. 淮河生态经济带城市用地扩张与经济增长的脱钩关系研究. 长江流域资源与环境, 2023, 32(8): 1573-1582.
[
|
| [12] |
陈银娥, 陈薇. 农业机械化、产业升级与农业碳排放关系研究: 基于动态面板数据模型的经验分析. 农业技术经济, 2018, (5): 122-133.
[
|
| [13] |
于卓卉, 毛世平. 中国农业净碳排放与经济增长的脱钩分析. 中国人口·资源与环境, 2022, 32(11): 30-42.
[
|
| [14] |
蒋黎, 王晓君. 环境质量与农业经济增长的内在关系探讨: 基于我国31个省区面板数据的EKC分析. 农业经济问题, 2019, 40(12): 43-51.
[
|
| [15] |
吴金凤, 王秀红. 不同农业经济发展水平下的碳排放对比分析: 以盐池县和平度市为例. 资源科学, 2017, 39(10): 1909-1917.
[
|
| [16] |
邓荣荣, 肖湘涛, 刘凡璠. 公平和效率双重视角下中国粮食主产区农业碳排放研究. 调研世界, 2023, (6): 14-25.
[
|
| [17] |
柯善淦, 崔海莹, 卢新海, 等. 耕地利用绿色转型的时空格局及其驱动机制研究: 以湖北省为例. 中国土地科学, 2021, 35(12): 64-74.
[
|
| [18] |
王梦成, 董又铭, 林娜娜, 等. 双碳背景下耕地利用转型对耕地利用碳排放的影响及其空间溢出效应: 以黄淮海平原为例. 自然资源学报, 2024, 39(2): 352-371.
[
|
| [19] |
潘子纯, 田蓬鹏, 马林燕, 等. 城乡融合对耕地利用转型的影响研究. 地理科学进展, 2024, 43(2): 231-245.
[
|
| [20] |
代亚强, 张玥, 柯新利, 等. 耕地利用转型与县域城镇化的耦合作用及其影响因素分析: 以河南省为例. 自然资源学报, 2024, 39(1): 206-227.
[
|
| [21] |
卢新海, 王慧, 唐一峰, 等. 湖北省耕地利用转型对农民增收的空间溢出效应研究. 长江流域资源与环境, 2021, 30(7): 1757-1767.
[
|
| [22] |
|
| [23] |
卢新海, 崔海莹, 柯善淦, 等. 湖北省耕地利用绿色转型与粮食全要素生产率的耦合协调及其驱动机制研究. 中国土地科学, 2022, 36(8): 75-84.
[
|
| [24] |
柯新利, 邓洁, 宋钰. 长江经济带耕地利用绿色转型与城乡融合耦合协调发展的时空格局研究. 生态学报, 2024, 44(13): 5773-5785.
[
|
| [25] |
邓宗兵, 肖沁霖, 王炬, 等. 中国数字经济与绿色发展耦合协调的时空特征及驱动机制. 地理学报, 2024, 79(4): 971-990.
[
|
| [26] |
|
| [27] |
|
| [28] |
|
| [29] |
|
| [30] |
牛善栋, 方斌, 崔翠, 等. 乡村振兴视角下耕地利用转型的时空格局及路径分析: 以淮海经济区为例. 自然资源学报, 2020, 35(8): 1908-1925.
[
|
| [31] |
高佳, 赵荣荣, 王盼盼. 耕地多功能对粮食生产能力变化的敏感度研究. 自然资源学报, 2024, 39(6): 1434-1449.
[
|
| [32] |
丁宝根, 杨树旺, 赵玉, 等. 中国耕地资源利用的碳排放时空特征及脱钩效应研究. 中国土地科学, 2019, 33(12): 45-54.
[
|
| [33] |
李波, 张俊飚. 基于投入视角的我国农业碳排放与经济发展脱钩研究. 经济经纬, 2012, 29(4): 27-31.
[
|
| [34] |
宁静, 王震, 杜国明, 等. 东北地区农业碳排放特征与农业经济的脱钩状态分析. 经济地理, 2023, 43(11): 173-180.
[
|
| [35] |
李璐, 张斌, 夏秋月, 等. 土地资源错配对碳排放效率的空间效应与影响路径: 来自长江经济带108个城市的经验证据. 资源科学, 2023, 45(5): 1059-1073.
[
|
| [36] |
Climate Change 2013: The Physicle Science Basis Technical Summary. IPCC, 2013.
|
| [37] |
马涛. 上海农业碳源碳汇现状评估及增加碳汇潜力分析. 可持续发展, 2011, 28(5): 38-41.
[
|
| [38] |
王宝义, 张卫国. 中国农业生态效率测度及时空差异研究. 中国人口·资源与环境, 2016, 26(6): 11-19.
[
|
| [39] |
段华平, 张悦, 赵建波, 等. 中国农田生态系统的碳足迹分析. 水土保持学报, 2011, 25(5): 203-208.
[
|
/
| 〈 |
|
〉 |