
JOURNAL OF NATURAL RESOURCES >
Study on the water environment effect of industrial transfer in China's new development pattern
Received date: 2024-06-24
Revised date: 2025-01-20
Online published: 2025-04-16
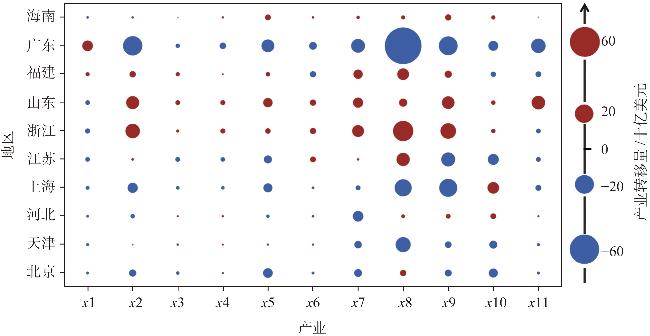
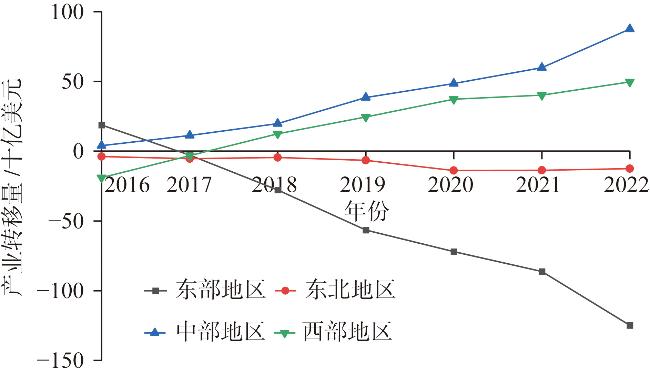
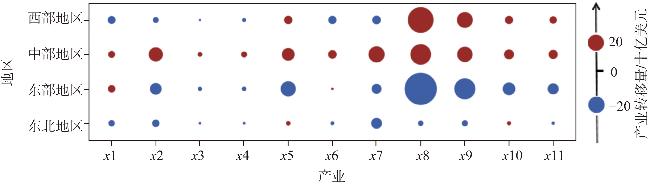
How to judge the water environment effect of industrial transfer in the context of industrial development is the urgent need to realize high-quality development and build a beautiful China in the new development pattern. Using the data of 31 provincial-level regions in China from 2016 to 2022, we apply the dynamic deviation-share method to measure the scale and trend of industrial transfer, and adopt the industrial gray water footprint to calculate the amount of industrial water pollution, and use the Spatial Durbin Model to analyze the ''pollution paradise'' or ''pollution halo'' effect of the water environment of the current industrial transfer. The Spatial Durbin Model is used to analyze the ''pollution paradise'' or ''pollution halo'' effect of the current industrial transfer. The following conclusions are drawn: The industrial transfer shows the compound water environment effect of ''pollution paradise'' and ''pollution halo''. The water pollution in the receiving place shows the effect of ''pollution paradise'' due to the deepening of industrial transfer. Industrial transfer reduces the total amount of industrial water pollution in China, but this ''pollution halo'' effect has not been fully confirmed. The water environment effect of industrial transfer varies according to the type of industry and region. The results show that there is a ''pollution paradise'' crisis and a ''pollution halo'' transformation opportunity for industrial transfer in the new development pattern. Therefore, China should seize the time window of industrial transfer and promote industrial upgrading to better adapt to the water resource constraints and environmental protection needs in the new development pattern.
NING Jing , ZHOU Shen-bei , HOU Jia-ping , HE Hai . Study on the water environment effect of industrial transfer in China's new development pattern[J]. JOURNAL OF NATURAL RESOURCES, 2025 , 40(5) : 1330 -1343 . DOI: 10.31497/zrzyxb.20250512
表1 行业部门分类Table 1 Classification of industrial sectors |
| 部门编号 | 最终行业部门分类 | 行业类型 |
|---|---|---|
| 1 | 食品、饮料及烟草业 | 劳动密集型 |
| 2 | 纺织、皮革及鞋业 | |
| 3 | 软木、木材及其制品业 | |
| 4 | 造纸及印刷业 | |
| 5 | 化学工业 | 资本密集型 |
| 6 | 非金属矿物制品业 | |
| 7 | 基本金属和金属制品业 | |
| 8 | 电气机械和光学机械设备制造业 | 技术密集型 |
| 9 | 其他机械设备制造业 | |
| 10 | 交通运输设备制造业 | |
| 11 | 其他制造业及回收业 |
表2 各变量描述性统计Table 2 Descriptive statistics for each variable |
| 变量 | 定义 | 观测数/个 | 均值 | 标准差 | 最小值 | 最大值 | |
|---|---|---|---|---|---|---|---|
| 被解释变量 | GWF | 工业灰水足迹/万m3 | 217 | 38914 | 40502 | 216.7 | 284447 |
| 解释变量 | QIT | 产业转移规模/亿元 | 217 | 0 | 425.5 | -1965 | 1326 |
| 控制变量 | lnGDPPC | 人均GDP/元 | 217 | 10.97 | 0.390 | 10.22 | 12.02 |
| lnFDI | 外资直接投资占比 | 217 | -0.886 | 0.986 | -2.708 | 4.024 | |
| lnFC | 劳动力成本/元 | 217 | 11.35 | 0.270 | 10.81 | 12.27 | |
| EPS | 环境规制 | 217 | 0.180 | 0.209 | 0.000132 | 2.052 | |
| IS | 产业结构 | 217 | 3.616 | 0.231 | 2.765 | 3.989 |
表3 2016—2022年中国工业灰水足迹的全局Moran's I指数Table 3 Global Moran's I index for industrial graywater footprint in China from 2016 to 2022 |
| 年份 | 2016 | 2017 | 2018 | 2019 | 2020 | 2021 | 2022 |
|---|---|---|---|---|---|---|---|
| Moran's I | 0.018** | 0.012* | 0.020** | 0.026** | 0.036** | 0.057*** | 0.057*** |
注:***、**、*分别表示通过1%、5%、10%水平上的显著性检验,下同。 |
表4 LM检验、Hausman检验、Wald检验与LR检验结果Table 4 Results of LM test, Hausman test, Wald test and LR test |
| 检验方法 | 统计值 | p值 |
|---|---|---|
| LM-err | 128.141*** | 0.000 |
| Robust-LM-err | 52.304*** | 0.000 |
| LM-lag | 80.015*** | 0.000 |
| Robust-LM-lag | 4.178** | 0.041 |
| Hausman | 37.12*** | 0.0000 |
| LR-Spatial-error | 55.61*** | 0.000 |
| LR-Spatial-lag | 65.11*** | 0.000 |
| Wald-Spatial-error | 11.69* | 0.0692 |
| Wald-Spatial-lag | 7.27 | 0.2966 |
表5 全样本回归结果Table 5 Full-sample regression results |
| 变量 | (1) | (2) | (3) |
|---|---|---|---|
| 直接效应 | 间接效应 | 总效应 | |
| QIT | 10.550*** | -17.429 | -6.879 |
| (0.00) | (0.11) | (0.49) | |
| lnGDPPC | -165045.705*** | -202118.382 | -367164.087** |
| (0.00) | (0.27) | (0.02) | |
| lnFDI | 2259.509 | -2764.790 | -505.281 |
| (0.38) | (0.81) | (0.96) | |
| lnFC | -87009.379** | -315077.149* | -402086.529** |
| (0.04) | (0.08) | (0.03) | |
| EPS | -14174.177** | 21812.798 | 7638.621 |
| (0.03) | (0.49) | (0.81) | |
| IS | -66997.683** | 427540.333*** | 360542.650*** |
| (0.03) | (0.00) | (0.01) | |
| 样本量/个 | 217 | 217 | 217 |
注:括号内为p值,下同。 |
表6 行业异质性回归结果Table 6 Regression results of industry heterogeneity |
| 变量 | 直接效应 | 间接效应 | 总效应 | ||||||||
|---|---|---|---|---|---|---|---|---|---|---|---|
| 劳动 密集型 | 资本 密集型 | 技术 密集型 | 劳动 密集型 | 资本 密集型 | 技术 密集型 | 劳动 密集型 | 资本 密集型 | 技术 密集型 | |||
| QIT | 17.726** | 13.000* | 11.120** | 13.810 | -45.712** | 0.944 | 31.536 | -32.712** | 12.064 | ||
| (0.05) | (0.05) | (0.02) | (0.66) | (0.01) | (0.95) | (0.27) | (0.04) | (0.40) | |||
| 样本量 /个 | 217 | 217 | 217 | 217 | 217 | 217 | 217 | 217 | 217 |
表7 区域主效应异质性结果Table 7 Heterogeneity results of regional main effects |
| 变量 | 东部地区 | 东北地区 | 中部地区 | 西部地区 |
|---|---|---|---|---|
| QIT | 14.879*** | -526.873*** | 16.324** | 2.055 |
| 样本量/个 | 70 | 21 | 42 | 84 |
表8 2017年区域各省市加总的工业灰水足迹净输出量Table 8 Net output of industrial graywater footprint in the four regions and their total value in 2017 (亿m3) |
| 加总 | 东部地区 | 东北部地区 | 中部地区 | 西部地区 |
|---|---|---|---|---|
| 灰水足迹净输出量 | -4.004 | 1.074 | 2.523 | 0.407 |
表9 稳健性检验结果Table 9 Robustness test results |
| 变量 | (1) | (2) | |||
|---|---|---|---|---|---|
| Main | Wx | Main | Wx | ||
| QIT | 0.001*** | -0.002 | 0.001*** | -0.002 | |
| (0.00) | (0.28) | (0.00) | (0.24) | ||
| lnGDPPC | -21.490*** | -88.411** | -17.035*** | -8.248 | |
| (0.00) | (0.05) | (0.00) | (0.87) | ||
| lnFDI | 0.071 | -0.465 | 0.290 | -0.207 | |
| (0.75) | (0.83) | (0.21) | (0.92) | ||
| lnFC | -10.965*** | -87.042*** | -9.317** | -67.104** | |
| (0.01) | (0.01) | (0.02) | (0.03) | ||
| EPS | -1.242* | 0.969 | -1.254* | 2.705 | |
| (0.06) | (0.86) | (0.06) | (0.63) | ||
| IS | -4.190 | 74.335*** | -3.655 | 78.733*** | |
| (0.12) | (0.00) | (0.20) | (0.00) | ||
| POP | -0.001 | 0.024** | |||
| (0.53) | (0.05) | ||||
| lnRD | 0.396 | -8.071 | |||
| (0.60) | (0.22) | ||||
| 样本量/个 | 217 | 217 | 217 | 217 | |
| [1] |
乔治, 曲维玺, 杜国臣. 双循环新发展格局与全球化重振: 国际分工中的资源依赖视角. 国际贸易, 2023, (7): 3-11.
[
|
| [2] |
郭克莎, 田潇潇. 加快构建新发展格局与制造业转型升级路径. 中国工业经济, 2021, (11): 44-58.
[
|
| [3] |
|
| [4] |
白雪洁. 中国新一轮产业转移: 动因、特征与举措. 国家治理, 2022, (15): 27-31.
[
|
| [5] |
李雯轩, 李晓华. 新发展格局下区域间产业转移与升级的路径研究: 对““雁阵模式” 的再探讨. 经济学家, 2021, (6): 81-90.
[
|
| [6] |
陈晓红, 蔡思佳, 汪阳洁. 我国生态环境监管体系的制度变迁逻辑与启示. 管理世界, 2020, 36(11): 160-172.
[
|
| [7] |
余丽丽, 彭水军. 新发展格局下产业升级、国内贸易与绿色增长. 系统工程理论与实践, 2024, 44(7): 2075-2094.
[
|
| [8] |
李博, 秦欢, 孙威. 产业转型升级与绿色全要素生产率提升的互动关系: 基于中国116个地级资源型城市的实证研究. 自然资源学报, 2022, 37(1): 186-199.
[
|
| [9] |
孙浩, 郭劲光. 环境规制和产业集聚对能源效率的影响与作用机制: 基于空间效应的视角. 自然资源学报, 2022, 37(12): 3234-3251.
[
|
| [10] |
呙小明, 黄森. “美丽中国” 背景下中国区域产业转移对工业绿色效率的影响研究: 基于SBM-undesirable模型和空间计量模型. 重庆大学学报: 社会科学版, 2018, 24(4): 1-11.
[
|
| [11] |
陈宏阳, 余建辉, 张文忠. 中国重污染产业空间集聚及其环境效应: 特征与启示. 中国科学院院刊, 2023, 38(12): 1939-1949.
[
|
| [12] |
任亚运, 李婉婷, 张锟澎. 承接产业转移示范区的政策效应评估: 基于环境与经济二维视角的考察. 产业经济研究, 2023, (6): 16-28.
[
|
| [13] |
张虹, 胡金, 胡明骏, 等. 国家级承接产业转移示范区设立能促进绿色发展吗?. 科技进步与对策, 2023, 40(20): 65-75.
[
|
| [14] |
|
| [15] |
豆建民, 沈艳兵. 产业转移对中国中部地区的环境影响研究. 中国人口·资源与环境, 2014, 24(11): 96-102.
[
|
| [16] |
|
| [17] |
张建伟, 王艳华, 翟蕴芝, 等. 豫赣湘皖承接产业转移与创新产出的空间变系数计量分析. 湖南师范大学自然科学学报, 2023, 46(5): 100-107.
[
|
| [18] |
|
| [19] |
|
| [20] |
|
| [21] |
刘照德, 聂普焱. 经济集聚、产业结构升级与绿色经济效率协调发展: 基于京津冀与粤港澳大湾区的比较分析. 北京社会科学, 2023, (12): 29-43.
[
|
| [22] |
|
| [23] |
|
| [24] |
|
| [25] |
朱兆良. 农田中氮肥的损失与对策. 土壤与环境, 2000, 9(1): 1-6.
[
|
| [26] |
姚志毅. 污染产业转移对我国环境与经济的影响分析. 生态经济, 2009, 25(4): 155-158.
[
|
| [27] |
成艾华, 赵凡. 基于偏离份额分析的中国区域间产业转移与污染转移的定量测度. 中国人口·资源与环境, 2018, 28(5): 49-57.
[
|
| [28] |
黄永明, 陈小飞. 中国贸易隐含污染转移研究. 中国人口·资源与环境, 2018, 28(10): 112-120.
[
|
| [29] |
李林子, 傅泽强, 王艳华, 等. 京津冀制造业转移与环境影响实证研究. 环境科学研究, 2017, 30(12): 1813-1821.
[
|
| [30] |
秦炳涛, 葛力铭. 中国高污染产业转移与整体环境污染: 基于区域间相对环境规制门槛模型的实证. 中国环境科学, 2019, 39(8): 3572-3584.
[
|
| [31] |
蔡宏波, 韩金镕, 钟腾龙. 企业迁移的减排效应: 兼论“污染天堂假说” 与“波特假说”. 经济学动态, 2022, (11): 90-106.
[
|
| [32] |
|
| [33] |
胡新明. 论Wald、LR和LM检验不一致时的选择依据. 数量经济技术经济研究, 2010, 27(5): 153-161.
[
|
| [34] |
谢荣辉, 原毅军. 产业集聚动态演化的污染减排效应研究: 基于中国地级市面板数据的实证检验. 经济评论, 2016, (2): 18-28.
[
|
| [35] |
陈浩, 罗力菲. 环境规制对经济高质量发展的影响及空间效应: 基于产业结构转型中介视角. 北京理工大学学报: 社会科学版, 2021, 23(6): 27-40.
[
|
/
| 〈 |
|
〉 |