
JOURNAL OF NATURAL RESOURCES >
Water resources asset accounting and driver analysis in the Yangtze River Economic Belt based on the "quantity-value" framework
Received date: 2023-12-04
Revised date: 2024-07-17
Online published: 2025-01-23
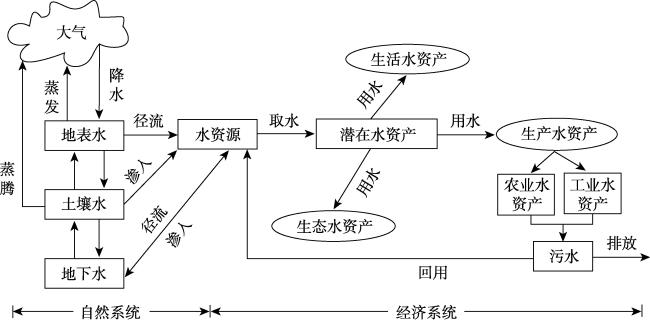
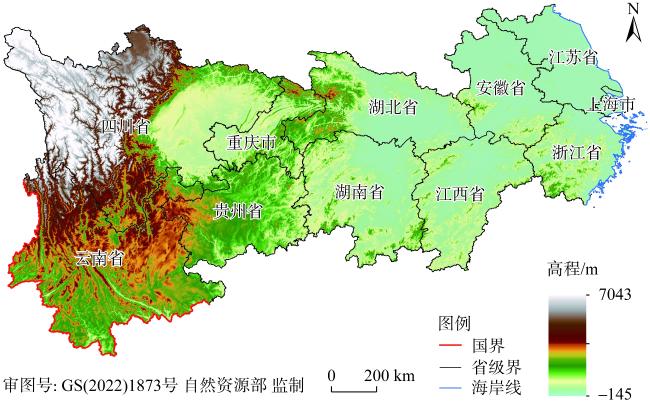
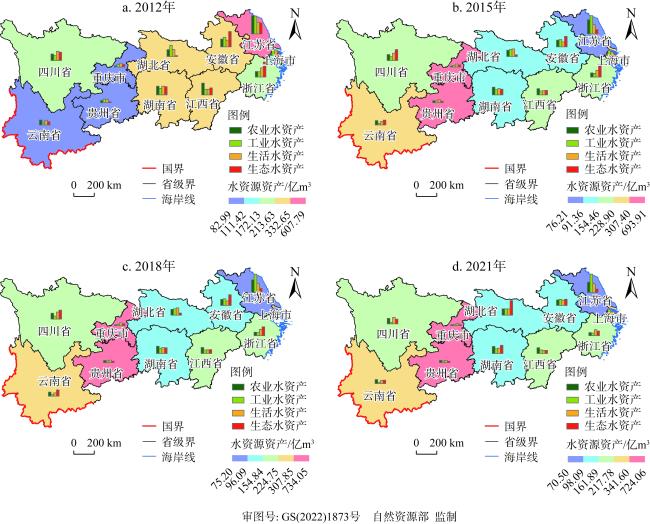
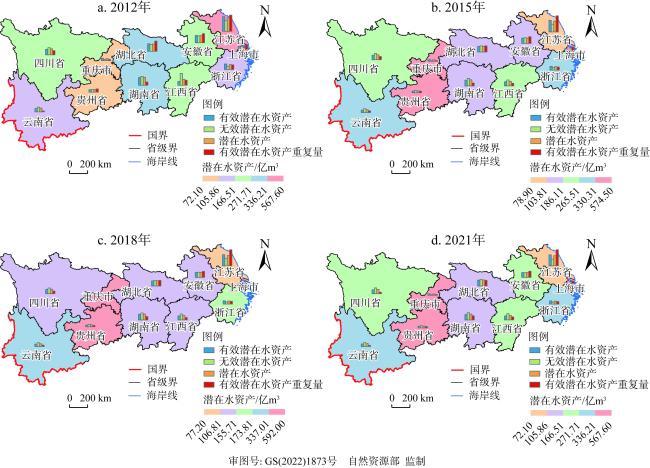
Accounting for water resources assets is an important part of the inventory of nationally owned natural resources assets, and is a basic prerequisite for the preparation of natural resources balance sheets. This study examines the macroeconomic data of the 11 provincial-level regions in the Yangtze River Economic Belt (YREB) from 2012 to 2021. It begins by elucidating the natural system of water resources formation and the economic system of water resources asset formation. The concept of potential water resources assets is introduced, and the cyclical patterns of water resources asset evolution are investigated. Then, based on the "quantity-value" framework, the adjusted coefficient method and energy value analysis method are adopted to construct models for the physical quantity and value accounting of regional water resources assets. Finally, an indicator system is designed from economic, social, environmental, and ecological dimensions. The geographic detector model is selected to explore the influencing factors of spatial differentiation of water resources assets. The research findings reveal that: (1) The physical volume of water resources assets in the YREB demonstrates fluctuating changes, reaching a peak of 2734.27 billion m3 in 2019 and a low value of 2548.70 billion m3 in 2020. Specifically, Shanghai, Jiangsu, Hunan, and Yunnan display "N"-shaped trends, while Jiangxi, Hubei, and Guizhou demonstrate "W"-shaped trends. The remaining regions exhibit more moderate trends. (2) The overall value of water resources assets fluctuates, showing an upward trend with an average annual increase of 13.14%. The spatial distribution of water resources asset value exhibits a pattern of "downstream>midstream>upstream" differentiation. (3) Population density is identified as the primary driver of spatial differentiation in water resources assets within the YREB. The cumulative explanatory power of the social subsystem is the highest, indicating that social factors have the greatest influence on the spatial pattern of water resources assets. The research findings contribute to elucidating the cyclic evolution process of water resources, latent water assets, and water resources assets, improving the macroeconomic accounting system, and providing valuable insights for the sustainable utilization of water resources.
LI Shu-qin , SHEN Ju-qin , HUANG Xin , ZHANG Kai-ze . Water resources asset accounting and driver analysis in the Yangtze River Economic Belt based on the "quantity-value" framework[J]. JOURNAL OF NATURAL RESOURCES, 2025 , 40(2) : 550 -568 . DOI: 10.31497/zrzyxb.20250216
表1 判断因子间交互作用的依据Table 1 Basis for judging the interaction between factors |
| 判断基础 | 交互作用类型 |
|---|---|
| q(X1∩X2)<Min[q(X1), q(X2)] | 非线性减弱 |
| min[q(X1), q(X2)]<q(X1∩X2)<max[q(X1), q(X2)] | 单因子非线性减弱 |
| q(X1∩X2)>Max[q(X1), q(X2)] | 双因子增强 |
| q(X1∩X2)=q(X1)+q(X2) | 独立 |
| q(X1∩X2)>q(X1)+q(X2) | 非线性增强 |
表2 水资源资产的影响因素指标体系Table 2 Indicator system of factors affecting water resources assets |
| 目标层 | 准则层 | 内容层 | 符号 | 单位 | 属性 |
|---|---|---|---|---|---|
| 水资源资产 | 经济 | 万元工业增加值用水量 | X1 | 亿m3/万元 | 负向 |
| 环境污染投资占比 | X2 | % | 正向 | ||
| 第三产业占比 | X3 | % | 正向 | ||
| 社会 | 人口密度 | X4 | 人/km2 | 正向 | |
| 城市化率 | X5 | % | 正向 | ||
| 人均生活用水量 | X6 | m3 | 负向 | ||
| 环境 | 水资源开发利用率 | X7 | % | 正向 | |
| 产水模数 | X8 | m3/km2 | 正向 | ||
| 人均水资源量 | X9 | m3 | 正向 | ||
| 生态 | 万元GDP COD排放量 | X10 | t/万元 | 负向 | |
| 污水处理率 | X11 | % | 正向 | ||
| 水质达标率 | X12 | % | 正向 |
表3 2012—2021年长江经济带水资源资产价值量核算结果Table 3 Accounting results of the value of water resources assets in the Yangtze River Economic Belt, 2012-2021(亿元) |
| 省(直辖市) | 2012年 | 2013年 | 2014年 | 2015年 | 2016年 | 2017年 | 2018年 | 2019年 | 2020年 | 2021年 |
|---|---|---|---|---|---|---|---|---|---|---|
| 上海 | 94.23 | 99.46 | 83.53 | 40.33 | 45.11 | 68.05 | 69.21 | 61.72 | 54.90 | 70.20 |
| 江苏 | 259.38 | 329.79 | 489.82 | 436.30 | 417.07 | 623.91 | 759.90 | 963.99 | 667.65 | 731.44 |
| 浙江 | 143.19 | 183.69 | 180.49 | 183.59 | 201.39 | 262.88 | 317.06 | 256.33 | 312.43 | 319.79 |
| 安徽 | 119.14 | 139.55 | 143.56 | 137.92 | 132.22 | 184.07 | 207.53 | 247.75 | 192.07 | 241.46 |
| 江西 | 39.48 | 45.52 | 74.39 | 80.81 | 76.76 | 94.06 | 136.56 | 95.47 | 131.61 | 154.86 |
| 湖北 | 149.99 | 114.76 | 120.39 | 121.22 | 109.24 | 201.72 | 181.21 | 341.97 | 208.14 | 276.47 |
| 湖南 | 70.88 | 79.15 | 127.37 | 94.02 | 138.10 | 156.25 | 217.38 | 167.84 | 199.47 | 224.09 |
| 重庆 | 60.22 | 66.95 | 66.24 | 84.47 | 84.46 | 89.39 | 107.11 | 120.21 | 107.43 | 120.36 |
| 四川 | 115.09 | 150.33 | 140.89 | 164.65 | 175.66 | 194.80 | 205.86 | 216.53 | 212.89 | 251.14 |
| 云南 | 76.30 | 95.33 | 99.12 | 105.60 | 108.23 | 120.89 | 134.89 | 162.68 | 168.35 | 201.37 |
| 贵州 | 38.06 | 50.52 | 47.17 | 37.49 | 65.78 | 74.51 | 89.39 | 91.65 | 93.35 | 107.21 |
表4 2012—2021年长江经济带单位水资源资产价值量核算结果Table 4 Accounting results of the value of water resources assets per unit in the Yangtze River Economic Belt, 2012-2021 (元/m3) |
| 省(直辖市) | 2012年 | 2013年 | 2014年 | 2015年 | 2016年 | 2017年 | 2018年 | 2019年 | 2020年 | 2021年 |
|---|---|---|---|---|---|---|---|---|---|---|
| 上海 | 0.55 | 0.53 | 0.53 | 0.26 | 0.28 | 0.43 | 0.45 | 0.41 | 0.38 | 0.43 |
| 江苏 | 0.43 | 0.50 | 0.70 | 0.63 | 0.59 | 0.86 | 1.04 | 1.28 | 0.95 | 1.01 |
| 浙江 | 0.67 | 0.86 | 0.87 | 0.93 | 1.04 | 1.37 | 1.70 | 1.44 | 1.81 | 1.78 |
| 安徽 | 0.38 | 0.44 | 0.49 | 0.45 | 0.43 | 0.59 | 0.68 | 0.84 | 0.66 | 0.79 |
| 江西 | 0.15 | 0.22 | 0.35 | 0.39 | 0.37 | 0.44 | 0.65 | 0.44 | 0.61 | 0.71 |
| 湖北 | 0.45 | 0.39 | 0.41 | 0.39 | 0.36 | 0.67 | 0.59 | 1.07 | 0.71 | 0.81 |
| 湖南 | 0.27 | 0.29 | 0.47 | 0.34 | 0.51 | 0.57 | 0.73 | 0.55 | 0.75 | 0.76 |
| 重庆 | 0.73 | 0.79 | 0.83 | 1.11 | 1.13 | 1.17 | 1.42 | 1.58 | 1.49 | 1.71 |
| 四川 | 0.54 | 0.68 | 0.73 | 0.72 | 0.76 | 0.84 | 0.92 | 1.03 | 1.15 | 1.29 |
| 云南 | 0.68 | 0.82 | 0.78 | 0.85 | 0.91 | 0.91 | 1.06 | 1.28 | 1.36 | 1.57 |
| 贵州 | 0.34 | 0.56 | 0.51 | 0.41 | 0.72 | 0.83 | 0.93 | 0.92 | 1.12 | 1.09 |
表5 长江经济带水资源资产驱动因子探测结果Table 5 Detection results of water resources asset drivers in the Yangtze River Economic Belt |
| Y | X1 | X2 | X3 | X4 | X5 | X6 | X7 | X8 | X9 | X10 | X11 | X12 | |
|---|---|---|---|---|---|---|---|---|---|---|---|---|---|
| 水资源资 产实物量 | q值 | 0.3247 | 0.0055 | 0.1581 | 0.8190 | 0.1812 | 0.1204 | 0.1285 | 0.1396 | 0.2567 | 0.0520 | 0.0104 | 0.2503 |
| p值 | 0.000 | 0.9869 | 0.0149 | 0.000 | 0.000 | 0.0191 | 0.2568 | 0.0111 | 0.000 | 0.2906 | 0.9213 | 0.0060 | |
| 排序 | 2 | 12 | 6 | 1 | 5 | 9 | 8 | 7 | 3 | 10 | 11 | 4 | |
| 水资源资 产价值量 | q值 | 0.3765 | 0.0561 | 0.1890 | 0.6879 | 0.3493 | 0.1487 | 0.0832 | 0.1433 | 0.1870 | 0.0812 | 0.0553 | 0.0703 |
| p值 | 0.000 | 0.2506 | 0.0027 | 0.000 | 0.000 | 0.0044 | 0.5028 | 0.0080 | 0.000 | 0.0736 | 0.2000 | 0.3058 | |
| 排序 | 2 | 11 | 4 | 1 | 3 | 6 | 8 | 7 | 5 | 9 | 12 | 10 |
表6 影响因子交互探测结果Table 6 Influence factor interaction detection results |
| X1 | X2 | X3 | X4 | X5 | X6 | X7 | X8 | X9 | X10 | X11 | X12 | |
|---|---|---|---|---|---|---|---|---|---|---|---|---|
| X1 | 0.5218* | 0.7281* | 0.7302# | 0.5822* | 0.7486# | 0.4885# | 0.6643# | 0.4565* | 0.4110* | 0.4322# | 0.4854# | |
| X2 | 0.4670# | 0.3575# | 0.8709# | 0.4194# | 0.2930# | 0.1816# | 0.3303# | 0.2499# | 0.2525# | 0.1572* | 0.2986# | |
| X3 | 0.6222* | 0.2376# | 0.7996* | 0.5132* | 0.4162# | 0.3738# | 0.3452# | 0.5955# | 0.4543# | 0.4269# | 0.3984# | |
| X4 | 0.8588* | 0.8475# | 0.8458* | 0.7128* | 0.7306* | 0.7885# | 0.7131* | 0.7059* | 0.7717# | 0.7882# | 0.8166# | |
| X5 | 0.4871* | 0.2889# | 0.3801# | 0.8723* | 0.4372# | 0.5936* | 0.6737# | 0.7084# | 0.4123* | 0.4350# | 0.4221# | |
| X6 | 0.8723# | 0.1808# | 0.3224# | 0.8700* | 0.3862# | 0.2780# | 0.4461# | 0.7308# | 0.2842# | 0.2600# | 0.2502# | |
| X7 | 0.4240* | 0.1883# | 0.3532# | 0.8847* | 0.3661# | 0.2887# | 0.4232# | 0.3242# | 0.2580# | 0.1736# | 0.2609# | |
| X8 | 0.7854# | 0.2099* | 0.3124# | 0.8498* | 0.7169# | 0.4218# | 0.5723# | 0.4946# | 0.4145# | 0.2769# | 0.2457# | |
| X9 | 0.5136* | 0.3719# | 0.6371# | 0.8289* | 0.7493# | 0.7742# | 0.5334# | 0.5435# | 0.2857# | 0.2835# | 0.5149# | |
| X10 | 0.4204# | 0.1580# | 0.4130# | 0.8609* | 0.2893# | 0.2348* | 0.2301# | 0.3737# | 0.3976# | 0.2135# | 0.3650# | |
| X11 | 0.3907# | 0.0767* | 0.4093# | 0.8384# | 0.2983# | 0.2189* | 0.2311# | 0.1859# | 0.3330# | 0.1675# | 0.2203# | |
| X12 | 0.4741* | 0.3877# | 0.5543# | 0.8529* | 0.4660# | 0.4371* | 0.4525# | 0.4121# | 0.5498# | 0.5205# | 0.3796# |
注:#表示非线性增强,*表示双因子增强。 |
| [1] |
杨世忠, 谭振华, 王世杰. 论我国自然资源资产负债核算的方法逻辑及系统框架构建. 管理世界, 2020, 36(11): 132-144.
[
|
| [2] |
贾亦真, 沈菊琴, 王晗. 区域水资源资产确认、计量及报表编制. 自然资源学报, 2022, 37(12): 3297-3312.
[
|
| [3] |
|
| [4] |
|
| [5] |
|
| [6] |
曹升乐, 刘春彤, 李福臻, 等. 基于社会经济发展水平的济南市水资源资产与负债研究. 中国人口·资源与环境, 2019, 29(5): 88-97.
[
|
| [7] |
徐素波, 张山, 陈丽芬. 自然资源资产负债表编制探析. 财会月刊, 2019, (1): 79-85.
[
|
| [8] |
沈菊琴, 郭孟卓, 万隆, 等. 水资源资产价值评估的替代法研究. 河海大学学报: 自然科学版, 2000, 28(3): 51-54.
[
|
| [9] |
王浩, 甘泓, 武博庆. 水资源资产与现代水利. 中国水利, 2002, (10): 151-153.
[
|
| [10] |
张婕, 刘玉洁, 潘韬, 等. 自然资源资产负债表编制中生态损益核算. 自然资源学报, 2020, 35(4): 755-766.
[
|
| [11] |
邓淇中, 张玲. 长江经济带水资源绿色效率时空演变特征及其影响因素. 资源科学, 2022, 44(2): 247-260.
[
|
| [12] |
郑德凤, 王佳媛, 李钰, 等. 基于节水视角的中国水资源压力时空演变及影响因素分析. 地理科学, 2021, 41(1): 157-166.
[
|
| [13] |
陈祖军, 李广鹏, 谭显英. 华东沿海城市水资源安全概念及未来战略示范研究. 水资源保护, 2017, 33(6): 38-46.
[
|
| [14] |
沈菊琴, 聂勇, 孙付华, 等. 河道水资源资产确认及计量模型研究. 会计研究, 2019, (8): 12-17.
[
|
| [15] |
左其亭, 吴青松, 金君良, 等. 区域水平衡基本原理及理论体系. 水科学进展, 2022, 33(2): 165-173.
[
|
| [16] |
张建云. 气候变化对国家水安全的影响及减缓适应策略. 中国水利, 2022, (15): 3-5, 14.
[
|
| [17] |
|
| [18] |
张丹丹, 沈菊琴. 基于循环耦合视角的区域水资源资产核算. 自然资源学报, 2024, 39(1): 153-169.
[
|
| [19] |
李芳, 吴凤平, 陈柳鑫, 等. 基于加权破产博弈模型的跨境流域水资源分配研究. 地理科学, 2021, 41(4): 728-736.
[
|
| [20] |
|
| [21] |
|
| [22] |
|
| [23] |
|
| [24] |
王兴民, 吴静, 白冰, 等. 中国CO2排放的空间分异与驱动因素: 基于198个地级及以上城市数据的分析. 经济地理, 2020, 40(11): 29-38.
[
|
| [25] |
|
| [26] |
蓝盛芳, 钦佩, 陆宏芳. 生态经济系统能值分析. 北京: 化学工业出版社, 2002.
[
|
| [27] |
黄晓荣, 秦长海, 郭碧莹, 等. 基于能值分析的价值型水资源资产负债表编制. 长江流域资源与环境, 2020, 29(4): 869-878.
[
|
| [28] |
潘楚元, 苏时鹏. 国有自然资源资产管理: 功能定位、特征事实与国别比较借鉴. 自然资源学报, 2023, 38(7): 1682-1697.
[
|
| [29] |
王劲峰, 徐成东. 地理探测器: 原理与展望. 地理学报, 2017, 72(1): 116-134.
[
|
/
| 〈 |
|
〉 |