
JOURNAL OF NATURAL RESOURCES >
Spatial correlation network, regional differentiation and convergence of inclusive green development in China
Received date: 2024-02-26
Revised date: 2024-07-11
Online published: 2025-01-23
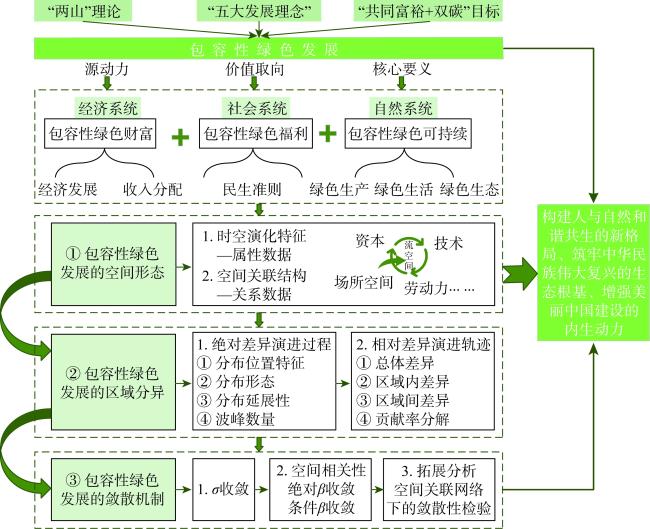
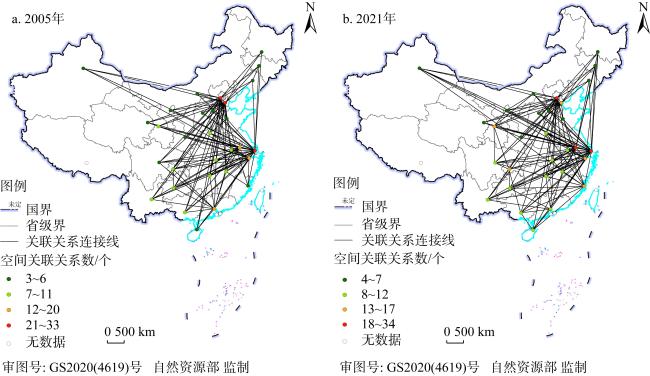
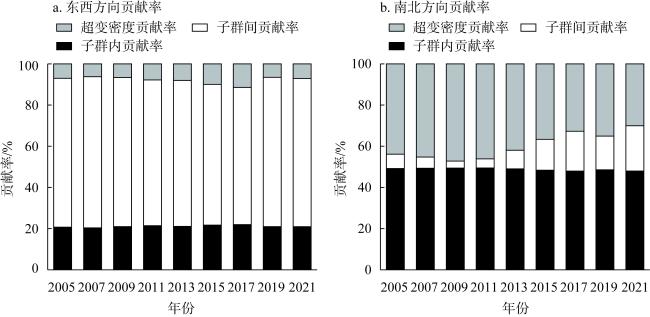
Inclusive, green and sustainable development is the key to building a beautiful China. Based on the connotation of inclusive green development in the New Era, this paper constructs a multidimensional index system covering inclusive green wealth, inclusive green welfare and inclusive green sustainability, measures the level of inclusive green development in China from 2005 to 2021, and explores its spatio-temporal evolution characteristics, spatial correlation network, regional differentiation and dynamic convergence mechanism. The results show that: (1) The level of inclusive green development in China continues to improve, showing a hierarchical spatial distribution pattern of "East>West>Central>Northeast" in the east-west direction, and the north-south direction is consistent with the economic development pattern of "stronger in the south and weaker in the north". (2) The spatial correlation network of China's inclusive green development has the characteristics of multi-node, multi-thread interweaving, and the coexistence of spatial adjacent correlation and cross-regional correlation. At the same time, it presents a "spider web" structure, and the spatial correlation between provinces needs to be further enhanced. (3) The regional differences in China's inclusive green development level tend to converge, and the polarization phenomenon is weakened. The inter-regional differences are the main source of the spatial differences in the inclusive green development level in the east-west direction. The combination of super-variable density and intra-regional differences significantly affects the spatial differences in the inclusive green development level in the north-south direction. (4) The level of inclusive green development in China has remarkable characteristics of σ convergence, spatial absolute β convergence, and spatial conditional β convergence. Economic and social factors such as the level of economic development, the level of government intervention, the upgrading and rationalization of industrial structure have regional heterogeneity on the impact of inclusive green development. The research conclusions are of great significance for narrowing regional disparities, building a balanced spatial pattern of green and inclusive development, and promoting high-quality development and the realization of "dual carbon" goals.
WU Yu-yang , CAO Yu-ling , ZHU Yue , ZHANG Jun-tao . Spatial correlation network, regional differentiation and convergence of inclusive green development in China[J]. JOURNAL OF NATURAL RESOURCES, 2025 , 40(2) : 436 -458 . DOI: 10.31497/zrzyxb.20250210
表1 中国包容性绿色发展水平评价指标体系Table 1 Index system for evaluating the level of inclusive green development in China |
| 一级指标 | 二级指标 | 三级指标/ | 指标属性 | 权重 |
|---|---|---|---|---|
| 包容性绿色财富 | 经济发展 | X1地区生产总值/亿元 | 正向 | 0.0510 |
| X2财政收入占GDP比例/% | 正向 | 0.0481 | ||
| 收入分配 | X3城镇居民人均可支配收入/元 | 正向 | 0.1049 | |
| X4农村居民人均可支配收入/元 | 正向 | 0.0545 | ||
| 包容性绿色福利 | 社会保障公平 | X5基本养老保险基金支出占GDP比例/% | 正向 | 0.0361 |
| X6基本医疗保险基金支出占GDP比例/% | 正向 | 0.0585 | ||
| X7失业保险参保人数/万人 | 正向 | 0.0106 | ||
| 教育机会公平 | X8科教经费投入强度/% | 正向 | 0.0471 | |
| X9每万人拥有普通高等学校数/所 | 正向 | 0.0584 | ||
| 医疗卫生机会公平 | X10单位人口拥有卫生技术人员数/人 | 正向 | 0.0342 | |
| X11单位人口医疗卫生机构床位数/张 | 正向 | 0.0374 | ||
| 基础设施公平 | X12每万人运输线路长度/km | 正向 | 0.0403 | |
| X13人均道路面积/m2 | 正向 | 0.0325 | ||
| X14电话普及率/% | 正向 | 0.0454 | ||
| 就业机会公平 | X15二三产业就业率/% | 正向 | 0.0196 | |
| X16城镇登记失业率/% | 负向 | 0.0121 | ||
| 消费机会公平 | X17人均社会消费品零售额/元 | 正向 | 0.0556 | |
| X18人均能源消耗/t | 负向 | 0.0263 | ||
| X19人均水资源量/m3 | 正向 | 0.0057 | ||
| 包容性绿色可持续 | 绿色生产消费 | X20单位产值能耗/(t/万元) | 负向 | 0.0118 |
| X21单位产值废水排放量/(t/万元) | 负向 | 0.0098 | ||
| X22单位产值废气排放量/(t/万元) | 负向 | 0.0099 | ||
| X23单位产值二氧化碳排放量/(t/万元) | 负向 | 0.0071 | ||
| 绿色生活质量 | X24人均废水排放量/(t/人) | 负向 | 0.0306 | |
| X25人均废气排放量/(t/人) | 负向 | 0.0110 | ||
| X26人均二氧化碳排放量/(t/人) | 负向 | 0.0088 | ||
| 绿色生态宜居 | X27森林覆盖率/% | 正向 | 0.0364 | |
| X28人均公共绿地面积/m2 | 正向 | 0.0421 | ||
| X29固体废物综合利用率/% | 正向 | 0.0299 | ||
| X30生活垃圾无害化处理率/% | 正向 | 0.0241 |
表2 2005—2021年中国包容性绿色发展水平Table 2 China's inclusive green development level from 2005 to 2021 |
| 年份 | 2005 | 2007 | 2009 | 2011 | 2013 | 2015 | 2017 | 2019 | 2021 |
|---|---|---|---|---|---|---|---|---|---|
| 北京 | 0.7148 | 0.8228 | 0.9603 | 1.1280 | 1.2895 | 1.5894 | 1.6948 | 1.8844 | 1.8822 |
| 天津 | 0.5008 | 0.5647 | 0.6643 | 0.7711 | 0.8686 | 1.0010 | 1.0950 | 1.2832 | 1.3213 |
| 河北 | 0.2578 | 0.3530 | 0.4484 | 0.5565 | 0.6445 | 0.7623 | 0.9022 | 1.0774 | 1.1161 |
| 山西 | 0.2560 | 0.3778 | 0.4674 | 0.5891 | 0.7013 | 0.7971 | 0.9013 | 1.0123 | 1.0600 |
| 内蒙古 | 0.2707 | 0.3716 | 0.4639 | 0.6032 | 0.6996 | 0.8206 | 0.9669 | 1.0987 | 1.1566 |
| 辽宁 | 0.3374 | 0.4424 | 0.5721 | 0.6889 | 0.7998 | 0.8896 | 1.0202 | 1.1602 | 1.2252 |
| 吉林 | 0.2882 | 0.3836 | 0.4671 | 0.5787 | 0.6875 | 0.7677 | 0.8391 | 1.0612 | 1.1280 |
| 黑龙江 | 0.3095 | 0.3940 | 0.5124 | 0.6139 | 0.7404 | 0.8361 | 0.9333 | 1.1398 | 1.2299 |
| 上海 | 0.6305 | 0.7140 | 0.8216 | 1.0123 | 1.1342 | 1.4380 | 1.5902 | 1.7888 | 1.9090 |
| 江苏 | 0.3921 | 0.5218 | 0.6247 | 0.7780 | 0.9187 | 1.1234 | 1.2778 | 1.4814 | 1.6136 |
| 浙江 | 0.4871 | 0.5972 | 0.7011 | 0.8518 | 1.0085 | 1.2441 | 1.3900 | 1.6057 | 1.7019 |
| 安徽 | 0.2599 | 0.3728 | 0.4669 | 0.5848 | 0.6840 | 0.8097 | 0.9285 | 1.0811 | 1.1885 |
| 福建 | 0.3610 | 0.4405 | 0.5380 | 0.6451 | 0.7736 | 0.9424 | 1.0663 | 1.2130 | 1.2805 |
| 江西 | 0.2703 | 0.3837 | 0.4718 | 0.5881 | 0.6876 | 0.8042 | 0.9492 | 1.0833 | 1.1710 |
| 山东 | 0.3408 | 0.4653 | 0.5662 | 0.7046 | 0.8271 | 0.9811 | 1.0965 | 1.2424 | 1.3435 |
| 河南 | 0.2425 | 0.3515 | 0.4309 | 0.5440 | 0.6530 | 0.7669 | 0.9146 | 1.0412 | 1.1107 |
| 湖北 | 0.2921 | 0.3846 | 0.4743 | 0.5910 | 0.7200 | 0.8917 | 1.0443 | 1.1717 | 1.1968 |
| 湖南 | 0.3063 | 0.3950 | 0.4759 | 0.5774 | 0.6853 | 0.8146 | 0.9580 | 1.0992 | 1.1836 |
| 广东 | 0.4203 | 0.5281 | 0.6291 | 0.7676 | 0.8925 | 1.0787 | 1.2153 | 1.4329 | 1.5212 |
| 广西 | 0.2555 | 0.3470 | 0.4476 | 0.5534 | 0.6426 | 0.7391 | 0.8859 | 1.0023 | 1.0573 |
| 海南 | 0.3487 | 0.4163 | 0.5116 | 0.6804 | 0.7550 | 0.8517 | 0.9277 | 1.0455 | 1.1000 |
| 重庆 | 0.2561 | 0.3913 | 0.5126 | 0.6552 | 0.7842 | 0.9390 | 1.0623 | 1.1445 | 1.2343 |
| 四川 | 0.2756 | 0.3709 | 0.4966 | 0.6044 | 0.7311 | 0.8756 | 0.9830 | 1.1260 | 1.2219 |
| 贵州 | 0.2324 | 0.3424 | 0.4355 | 0.5601 | 0.6599 | 0.7666 | 0.8983 | 1.0120 | 1.0748 |
| 云南 | 0.3352 | 0.3975 | 0.4947 | 0.6010 | 0.6900 | 0.7848 | 0.9744 | 1.0070 | 1.0685 |
| 陕西 | 0.2603 | 0.3786 | 0.4996 | 0.6313 | 0.7082 | 0.8220 | 0.9109 | 1.0445 | 1.1122 |
| 甘肃 | 0.2483 | 0.3489 | 0.4583 | 0.5545 | 0.6506 | 0.7509 | 0.9078 | 0.9898 | 1.0453 |
| 青海 | 0.3123 | 0.4056 | 0.4995 | 0.6694 | 0.7019 | 0.8125 | 0.9635 | 1.1364 | 1.1600 |
| 宁夏 | 0.2269 | 0.3555 | 0.4397 | 0.5600 | 0.6645 | 0.7963 | 0.9084 | 0.9857 | 1.0091 |
| 新疆 | 0.3287 | 0.4197 | 0.5390 | 0.6856 | 0.7487 | 0.8692 | 1.0000 | 1.0716 | 1.1078 |
| 均值 | 0.3339 | 0.4346 | 0.5364 | 0.6643 | 0.7718 | 0.9122 | 1.0402 | 1.1841 | 1.2510 |
图3 中国包容性绿色发展水平绝对差异演进过程Fig. 3 Evolution of absolute differences in China's inclusive green development level |
表3 2005—2021年中国包容性绿色发展水平的Dagum基尼系数Table 3 Dagum Gini coefficient of inclusive green development in China from 2005 to 2021 |
| 年份 | 总体 基尼系数 | 各子群Dagum基尼系数 | |||||
|---|---|---|---|---|---|---|---|
| 东部 | 中部 | 西部 | 东北 | 北方 | 南方 | ||
| 2005 | 0.1637 | 0.1641 | 0.0351 | 0.0711 | 0.0448 | 0.1558 | 0.1664 |
| 2007 | 0.1186 | 0.1364 | 0.0321 | 0.0190 | 0.0372 | 0.1156 | 0.1185 |
| 2009 | 0.1038 | 0.1221 | 0.0451 | 0.0371 | 0.0150 | 0.0975 | 0.1077 |
| 2011 | 0.0968 | 0.1114 | 0.0390 | 0.0422 | 0.0131 | 0.0948 | 0.0965 |
| 2013 | 0.0913 | 0.1090 | 0.0336 | 0.0334 | 0.0157 | 0.0910 | 0.0879 |
| 2015 | 0.1027 | 0.1231 | 0.0326 | 0.0386 | 0.0233 | 0.1062 | 0.0921 |
| 2017 | 0.0910 | 0.1147 | 0.0296 | 0.0253 | 0.0432 | 0.0942 | 0.0798 |
| 2019 | 0.0917 | 0.1093 | 0.0196 | 0.0250 | 0.0312 | 0.0992 | 0.0785 |
| 2021 | 0.0918 | 0.1069 | 0.0189 | 0.0224 | 0.0349 | 0.0997 | 0.0753 |
| 均值 | 0.1043 | 0.1210 | 0.0331 | 0.0333 | 0.0287 | 0.1047 | 0.0991 |
| 年份 | 子群间Dagum基尼系数 | ||||||
| 东部—中部 | 东部—西部 | 东部—东北 | 中部—西部 | 中部—东北 | 西部—东北 | 北方—南方 | |
| 2005 | 0.1909 | 0.2461 | 0.2476 | 0.0828 | 0.0736 | 0.0614 | 0.1664 |
| 2007 | 0.1563 | 0.1846 | 0.1873 | 0.0390 | 0.0494 | 0.0312 | 0.1202 |
| 2009 | 0.1287 | 0.1537 | 0.1672 | 0.0528 | 0.0560 | 0.0349 | 0.1051 |
| 2011 | 0.1271 | 0.1390 | 0.1574 | 0.0450 | 0.0434 | 0.0385 | 0.0979 |
| 2013 | 0.1167 | 0.1395 | 0.1447 | 0.0435 | 0.0414 | 0.0274 | 0.0930 |
| 2015 | 0.1482 | 0.1559 | 0.1560 | 0.0387 | 0.0331 | 0.0329 | 0.1060 |
| 2017 | 0.1340 | 0.1340 | 0.1443 | 0.0291 | 0.0416 | 0.0397 | 0.0947 |
| 2019 | 0.1226 | 0.1354 | 0.1459 | 0.0295 | 0.0372 | 0.0315 | 0.0944 |
| 2021 | 0.1194 | 0.1323 | 0.1459 | 0.0289 | 0.0423 | 0.0347 | 0.0955 |
| 均值 | 0.1382 | 0.1578 | 0.1663 | 0.0433 | 0.0464 | 0.0369 | 0.1081 |
表4 中国包容性绿色发展σ收敛系数Table 4 The σ convergence coefficient of China's inclusive green development |
| 年份 | 全国 | 东部地区 | 中部地区 | 西部地区 | 东北地区 | 北方地区 | 南方地区 |
|---|---|---|---|---|---|---|---|
| 2005 | 0.3454 | 0.3155 | 0.0881 | 0.1355 | 0.0792 | 0.3873 | 0.3133 |
| 2007 | 0.2587 | 0.2609 | 0.0391 | 0.0687 | 0.0772 | 0.2861 | 0.2388 |
| 2009 | 0.2229 | 0.2356 | 0.0363 | 0.0696 | 0.1018 | 0.2511 | 0.2002 |
| 2011 | 0.2044 | 0.2166 | 0.0308 | 0.0791 | 0.0897 | 0.2215 | 0.1937 |
| 2013 | 0.1943 | 0.2089 | 0.0322 | 0.0627 | 0.0757 | 0.2122 | 0.1816 |
| 2015 | 0.2219 | 0.2345 | 0.0511 | 0.0730 | 0.0735 | 0.2363 | 0.2114 |
| 2017 | 0.1964 | 0.2168 | 0.0538 | 0.0567 | 0.0973 | 0.2038 | 0.1898 |
| 2019 | 0.1948 | 0.2038 | 0.0504 | 0.0583 | 0.0467 | 0.1922 | 0.1987 |
| 2021 | 0.1904 | 0.1984 | 0.0474 | 0.0652 | 0.0481 | 0.1756 | 0.1998 |
表5 中国包容性绿色发展全局Moran's I指数Table 5 Global Moran's I index of inclusive green development in China |
| 年份 | Moran's I | Z值 | P值 |
|---|---|---|---|
| 2005 | 0.3470 | 4.3010 | 0.0000*** |
| 2007 | 0.3220 | 4.0780 | 0.0000*** |
| 2009 | 0.2910 | 3.7490 | 0.0000*** |
| 2011 | 0.2410 | 3.1430 | 0.0020*** |
| 2013 | 0.2450 | 3.1860 | 0.0010*** |
| 2015 | 0.2380 | 3.1010 | 0.0020*** |
| 2017 | 0.2270 | 2.9420 | 0.0030*** |
| 2019 | 0.2680 | 3.3550 | 0.0010*** |
| 2021 | 0.2890 | 3.5360 | 0.0000*** |
注:***表示1%的显著性水平,下同。 |
表6 中国包容性绿色发展空间绝对β收敛分析结果Table 6 Spatial absolute β convergence analysis results of China's inclusive green development |
| 变量 | 全国 | 东部地区 | 中部地区 | 西部地区 | 东北地区 | 北方地区 | 南方地区 |
|---|---|---|---|---|---|---|---|
| SDM模型 | OLS模型 | SEM模型 | SDM模型 | OLS模型 | SEM模型 | OLS模型 | |
| β(lnIGD) | -0.3423*** | -0.0381*** | -0.3946*** | -0.3483*** | -0.0461 | -0.2953*** | -0.0452*** |
| (0.0249) | (0.0084) | (0.0626) | (0.0533) | (0.0420) | (0.0317) | (0.0090) | |
| θ(w×lnIGD) | 0.1414** | 0.2529*** | |||||
| (0.0681) | (0.0516) | ||||||
| ρ或λ | 0.3432*** | -0.7054*** | 0.5688*** | 0.1803** | |||
| (0.0673) | (0.1570) | (0.0624) | (0.0849) | ||||
| R2 | 0.4156 | 0.3260 | 0.6044 | 0.4872 | 0.8847 | 0.4875 | 0.4277 |
| 敛散性 | 收敛 | 收敛 | 收敛 | 收敛 | 发散 | 收敛 | 收敛 |
| 收敛速度/% | 2.6894 | 0.2430 | 3.1366 | 2.9211 | — | 2.1877 | 0.2888 |
注:**表示5%的显著性水平,括号内的数值为标准误。收敛速度= -ln(1+β)/T,T为本文中研究期的时间跨度,下同。 |
表7 控制变量说明Table 7 Description of control variables |
| 变量 | 测算方法及参考依据 | |
|---|---|---|
| lnpgdp | 区域经济发展水平 | 人均地区生产总值取对数 [14] |
| lnpgdp2 | 区域经济发展水平的平方项 | 人均地区生产总值取对数的平方项 [32] |
| Gov | 政府干预水平 | 地方政府财政支出占地区生产总值比例 [16] |
| Tech | 区域科技创新能力 | 中国区域创新能力指数 [33] |
| TS | 产业结构高级化指数 | 第三产业增加值与第二产业增加值之比 [34] |
| TL | 产业结构合理化指数 | 泰尔指数 [35] |
| Digital | 数字经济发展水平 | 互联网普及率 [10] |
| Edu | 区域人力资本水平 | 平均受教育年限 [7] |
注:区域科技创新能力数据来源于《中国区域创新能力评价报告》,其余控制变量原始数据来源于2006—2022年《中国统计年鉴》。TL= ,其中Y表示生产总值(亿元);L表示产业从业人数(万人);i=1、2、3分别表示第一、二、三产业;n为产业数(个)。 |
表8 中国包容性绿色发展空间条件β收敛分析结果Table 8 Spatial conditional β convergence analysis results of China's inclusive green development |
| 变量 | 全国 | 东部地区 | 中部地区 | 西部地区 | 东北地区 | 北方地区 | 南方地区 |
|---|---|---|---|---|---|---|---|
| SDM模型 | OLS模型 | SAR模型 | SEM模型 | SAR模型 | SEM模型 | OLS模型 | |
| β(lnIGD) | -0.3883*** | -0.0782*** | -0.3267*** | -0.5022*** | -0.7276*** | -0.4161*** | -0.2436*** |
| (0.0271) | (0.0265) | (0.0464) | (0.0484) | (0.0781) | (0.0422) | (0.0318) | |
| lnpgdp | -0.0683 | -0.2259* | -0.2209 | 0.0184 | -0.3642 | 0.0253 | -0.1575** |
| (0.0831) | (0.1312) | (0.2740) | (0.1292) | (0.3130) | (0.1442) | (0.0759) | |
| lnpgdp2 | 0.0020 | 0.0102* | 0.0216 | -0.0021 | 0.0114 | -0.0038 | 0.0098*** |
| (0.0041) | (0.0061) | (0.0139) | (0.0066) | (0.0146) | (0.0069) | (0.0036) | |
| Gov | 0.2321*** | 0.0196 | 0.2252 | 0.0167 | 0.4401*** | 0.2085*** | 0.0382 |
| (0.0519) | (0.0580) | (0.1761) | (0.0740) | (0.1198) | (0.0630) | (0.0427) | |
| Tech | 0.0009* | 0.0008*** | -0.0014 | -0.0001 | -0.0004 | 0.0018** | 0.0009*** |
| (0.0005) | (0.0002) | (0.0011) | (0.0013) | (0.0009) | (0.0008) | (0.0003) | |
| TS | -0.0046 | 0.1357** | 0.4817*** | 0.0326 | -0.0846 | 0.0037 | 0.0998*** |
| (0.0476) | (0.0569) | (0.1010) | (0.0697) | (0.0598) | (0.0573) | (0.0349) | |
| TL | 0.0001 | 0.0001 | 0.0018 | 0.0024 | -0.0014*** | -0.0003 | 0.0005*** |
| (0.0002) | (0.0002) | (0.0020) | (0.0017) | (0.0004) | (0.0004) | (0.0002) | |
| Digital | 0.1110*** | -0.0342 | -0.2480*** | 0.1866** | 0.4675*** | 0.2390*** | 0.0012 |
| (0.0369) | (0.0319) | (0.0903) | (0.0772) | (0.0837) | (0.0609) | (0.0250) | |
| Edu | 0.0061 | -0.0167** | 0.0130 | 0.0109 | -0.0426** | 0.0128 | -0.0059 |
| (0.0075) | (0.0076) | (0.0089) | (0.0117) | (0.0170) | (0.0097) | (0.0037) | |
| θ(w×lnIGD) | 0.2473** | ||||||
| (0.1157) | |||||||
| ρ或λ | 0.3861*** | 0.4563*** | -0.2875** | -0.5016*** | 0.1763** | ||
| (0.0665) | (0.0709) | (0.1289) | (0.1068) | (0.0876) | |||
| R2 | 0.2731 | 0.3699 | 0.6875 | 0.5297 | 0.3713 | 0.4943 | 0.4811 |
| 敛散性 | 收敛 | 收敛 | 收敛 | 收敛 | 收敛 | 收敛 | 收敛 |
| 收敛速度/% | 3.2094 | 0.5088 | 2.2312 | 4.3595 | 6.1983 | 3.3626 | 1.7449 |
注:*表示10%的显著性水平。下同。 |
表9 空间关联网络矩阵下的中国包容性绿色发展空间条件β收敛分析结果Table 9 Spatial conditional β convergence analysis results of inclusive green development in China: Based on spatial correlation network matrix |
| 变量 | 全国 | 东部地区 | 中部地区 | 西部地区 | 东北地区 | 北方地区 | 南方地区 |
|---|---|---|---|---|---|---|---|
| SDM模型 | SAR模型 | SAR模型 | OLS模型 | SAR模型 | SAR模型 | OLS模型 | |
| β(lnIGD) | -0.6804*** | -0.3514*** | -0.3214*** | -0.1746** | -0.2621*** | -0.6487*** | -0.1691*** |
| (0.0575) | (0.0675) | (0.0994) | (0.0776) | (0.0621) | (0.0732) | (0.0579) | |
| lnpgdp | 0.6411** | -0.2878 | 1.3171 | -0.3969 | -11.1037*** | 0.5451 | -0.0539 |
| (0.2920) | (0.4685) | (0.8833) | (0.7797) | (2.5958) | (0.3890) | (0.2693) | |
| lnpgdp2 | -0.0288** | 0.0124 | -0.0587 | 0.0191 | 0.5024*** | -0.0254 | 0.0038 |
| (0.0132) | (0.0206) | (0.0415) | (0.0363) | (0.1198) | (0.0177) | (0.0120) | |
| Gov | 0.6777*** | 0.5949*** | 0.0837 | 0.0020 | 0.2216 | 0.6145*** | -0.0519 |
| (0.0929) | (0.1663) | (0.2925) | (0.0567) | (0.1480) | (0.1163) | (0.0541) | |
| Tech | 0.0008 | 0.0004 | -0.0028 | 0.0003 | 0.0054* | 0.0008 | 0.0006* |
| (0.0008) | (0.0008) | (0.0021) | (0.0013) | (0.0030) | (0.0011) | (0.0003) | |
| TS | -0.0790 | 0.2889 | 0.0216 | 0.0586 | 0.3058*** | -0.0713 | 0.1511** |
| (0.0901) | (0.1843) | (0.1571) | (0.1100) | (0.1050) | (0.1256) | (0.0636) | |
| TL | -0.0001 | -0.0004* | 0.0031 | 0.0006 | 0.0002 | -0.0001 | 0.0003* |
| (0.0002) | (0.0002) | (0.0019) | (0.0018) | (0.0011) | (0.0005) | (0.0002) | |
| Digital | 0.0947** | -0.1294 | -0.0285 | 0.0626 | 0.3812** | 0.1702* | -0.0055 |
| (0.0429) | (0.0891) | (0.0959) | (0.0872) | (0.1583) | (0.0875) | (0.0294) | |
| Edu | 0.0038 | -0.0065 | 0.0143 | -0.0050 | -0.0080 | 0.0204* | -0.0068 |
| (0.0098) | (0.0132) | (0.0174) | (0.0101) | (0.0235) | (0.0121) | (0.0057) | |
| θ(w×lnIGD) | 0.0578 | ||||||
| (0.1684) | |||||||
| ρ或λ | 0.3768*** | -0.0904 | -0.6968*** | 0.4604*** | 0.1259 | ||
| (0.0963) | (0.1392) | (0.1751) | (0.0700) | (0.1431) | |||
| R2 | 0.0542 | 0.0671 | 0.1637 | 0.5459 | 0.9100 | 0.1080 | 0.6579 |
| 敛散性 | 收敛 | 收敛 | 收敛 | 收敛 | 收敛 | 收敛 | 收敛 |
| 收敛速度/% | 14.2600 | 5.4123 | 4.8457 | 2.3981 | 3.8001 | 13.0762 | 2.3154 |
| [1] |
樊杰, 王亚飞, 梁博. 中国区域发展格局演变过程与调控. 地理学报, 2019, 74(12): 2437-2454.
[
|
| [2] |
盛来运, 郑鑫, 周平, 等. 我国经济发展南北差距扩大的原因分析. 管理世界, 2018, 34(9): 16-24.
[
|
| [3] |
周小亮, 吴武林. 中国包容性绿色增长的测度及分析. 数量经济技术经济研究, 2018, 35(8): 3-20.
[
|
| [4] |
|
| [5] |
|
| [6] |
张涛, 李均超. 网络基础设施、包容性绿色增长与地区差距: 基于双重机器学习的因果推断. 数量经济技术经济研究, 2023, 40(4): 113-135.
[
|
| [7] |
徐晓光, 樊华, 苏应生, 等. 中国绿色经济发展水平测度及其影响因素研究. 数量经济技术经济研究, 2021, 38(7): 65-82.
[
|
| [8] |
吴武林, 周小亮. 中国包容性绿色增长绩效评价体系的构建及应用. 中国管理科学, 2019, 27(9): 183-194.
[
|
| [9] |
李治国, 李兆哲, 孔维嘉. 数字基础设施建设赋能包容性绿色增长: 内在机制与经验证据. 浙江社会科学, 2023, (8): 15-24, 156.
[
|
| [10] |
李华, 董艳玲. 中国经济高质量发展水平及差异探源: 基于包容性绿色全要素生产率视角的考察. 财经研究, 2021, 47(8): 4-18.
[
|
| [11] |
徐盈之, 徐菱. 技术进步、能源贫困与我国包容性绿色发展. 大连理工大学学报: 社会科学版, 2020, 41(6): 24-35.
[
|
| [12] |
陈明华, 谢琳霄, 李倩, 等. 黄河流域包容性绿色增长绩效评价及地区差距: 基于减污降碳和共同富裕双重目标的经验考察. 资源科学, 2023, 45(3): 564-578.
[
|
| [13] |
吕延方, 方若楠. 中国制造业高质量发展的包容性与绿色检验. 现代经济探讨, 2021, (7): 83-92.
[
|
| [14] |
赵林, 刘焱序, 曹乃刚, 等. 中国包容性绿色效率时空格局与溢出效应分析. 地理科学进展, 2021, 40(3): 382-396.
[
|
| [15] |
赵伟, 黄兰, 李威, 等. 中国乡村包容性绿色发展水平分异及其驱动因素. 经济地理, 2023, 43(3): 68-77.
[
|
| [16] |
李汝资, 陈巧娟, 高雄愿, 等. 长江经济带城市绿色经济效率梯度转换规律及其影响因素. 自然资源学报, 2024, 39(1): 125-139.
[
|
| [17] |
赵林, 高晓彤, 刘焱序, 等. 中国包容性绿色效率空间关联网络结构演变特征分析. 经济地理, 2021, 41(9): 69-78, 90.
[
|
| [18] |
许宪春, 雷泽坤, 窦园园, 等. 中国南北平衡发展差距研究: 基于“中国平衡发展指数”的综合分析. 中国工业经济, 2021, (2): 5-22.
[
|
| [19] |
|
| [20] |
张晓颖. 经济、环境、社会发展与人: 从可持续发展观到包容性绿色增长. 江淮论坛, 2014, (6): 93-98, 61.
[
|
| [21] |
|
| [22] |
林万龙, 米晶. 县域包容性增长测度及其对乡村振兴的启示. 自然资源学报, 2023, 38(8): 2117-2134.
[
|
| [23] |
吴武林, 周小亮. 中国包容性绿色增长测算评价与影响因素研究. 社会科学研究, 2018, (1): 27-37.
[
|
| [24] |
郭玲玲, 卢小丽, 武春友, 等. 中国绿色增长评价指标体系构建研究. 科研管理, 2016, 37(6): 141-150.
[
|
| [25] |
|
| [26] |
王小华, 杨玉琪, 罗新雨, 等. 中国经济高质量发展的空间关联网络及其作用机制. 地理学报, 2022, 77(8): 1920-1936.
[
|
| [27] |
彭国华. 中国地区收入差距、全要素生产率及其收敛分析. 经济研究, 2005, 40(9): 19-29.
[
|
| [28] |
诸大建. 从“里约+20” 看绿色经济新理念和新趋势. 中国人口·资源与环境, 2012, 22(9): 1-7.
[
|
| [29] |
|
| [30] |
|
| [31] |
|
| [32] |
周亮, 车磊, 周成虎. 中国城市绿色发展效率时空演变特征及影响因素. 地理学报, 2019, 74(10): 2027-2044.
[
|
| [33] |
王淑婧, 李俊峰. 长三角城市群高质量绿色发展的均衡性特征及障碍因素. 自然资源学报, 2022, 37(6): 1540-1554.
[
|
| [34] |
袁航, 朱承亮. 国家高新区推动了中国产业结构转型升级吗?. 中国工业经济, 2018, (8): 60-77.
[
|
| [35] |
干春晖, 郑若谷, 余典范. 中国产业结构变迁对经济增长和波动的影响. 经济研究, 2011, 46(5): 4-16, 31.
[
|
/
| 〈 |
|
〉 |
