
JOURNAL OF NATURAL RESOURCES >
Spatial mismatch measurement and evolutionary characteristics of construction land use under undifferentiated land use comparison
Received date: 2024-01-15
Revised date: 2024-03-21
Online published: 2024-12-16
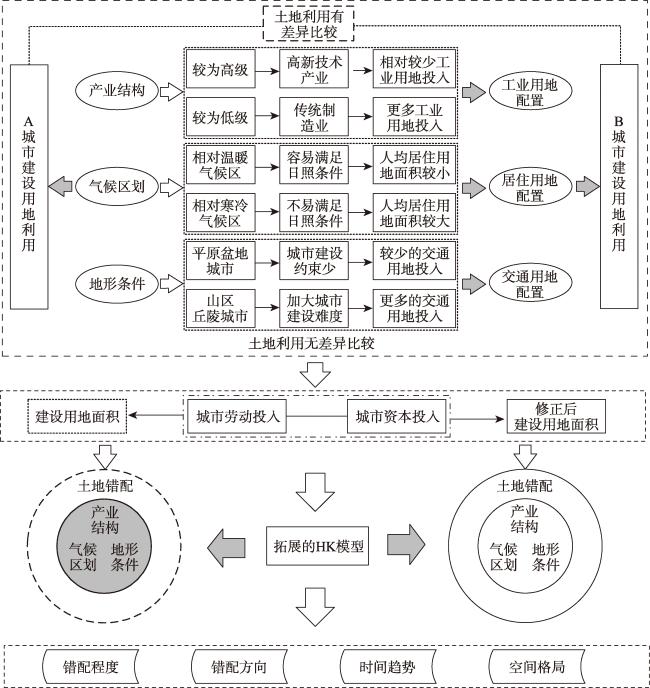
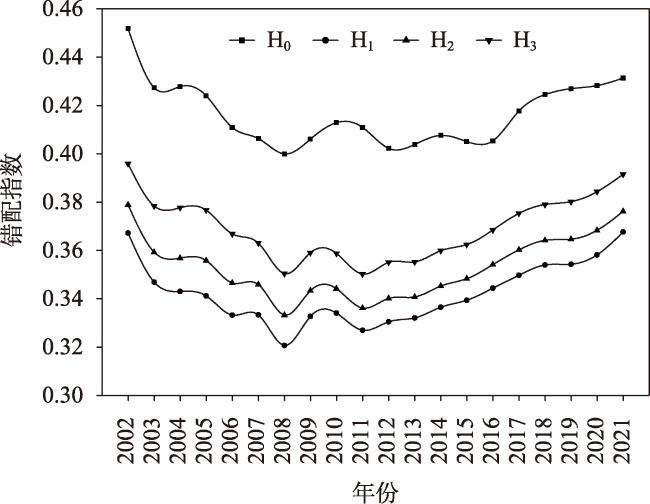
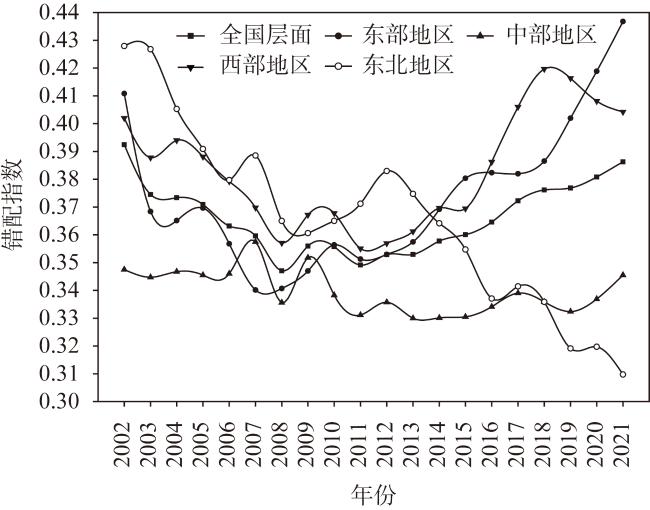
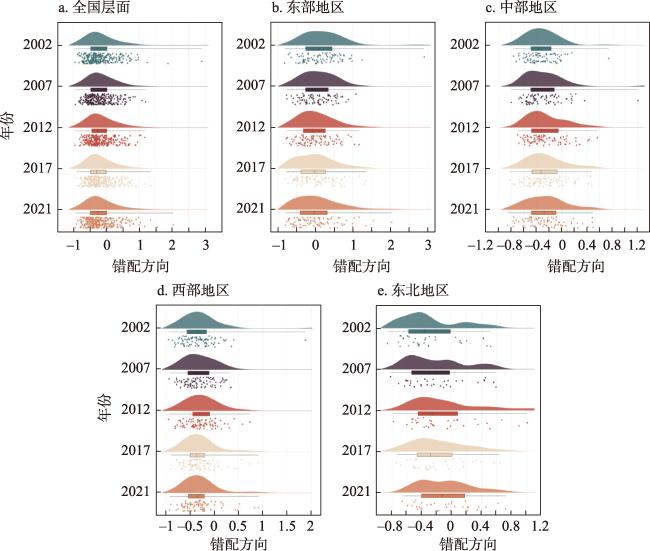
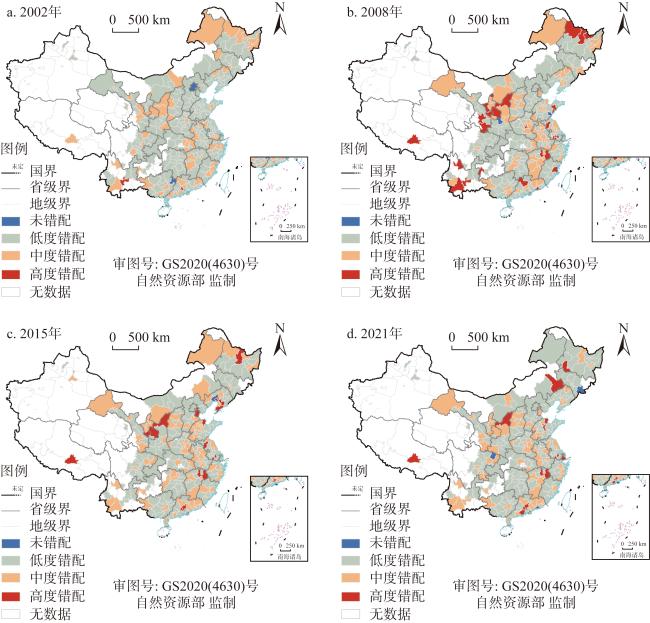
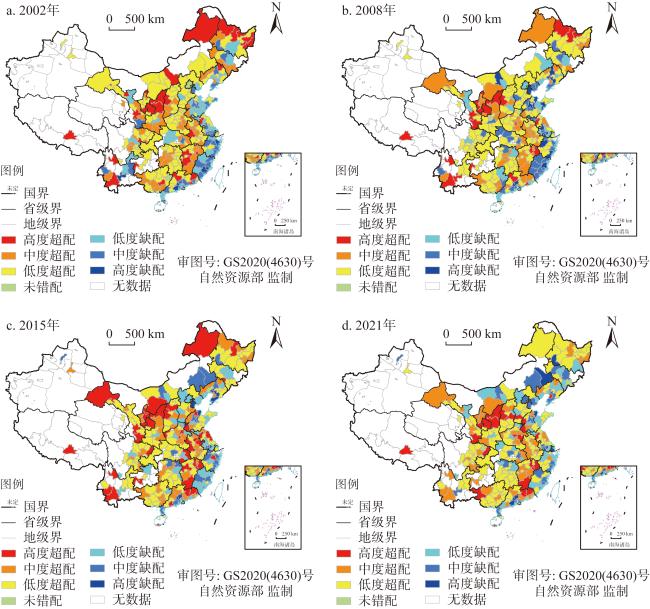
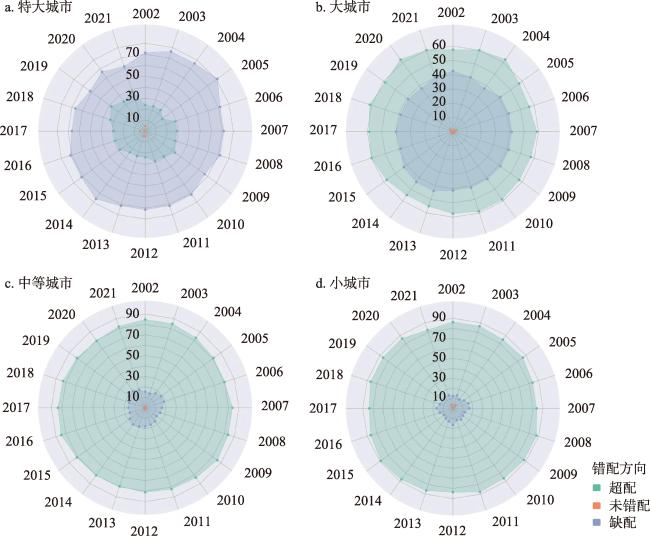
From the perspective of undifferentiated comparison of land use, the spatial and temporal evolution of the spatial mismatch of urban construction land in China is investigated based on the land comparable correction model and the extended HK model, with a view to providing reference for the efficient and scientific allocation of construction land. The results show that: (1) During the study period, the spatial mismatch of construction land generally showed a "W"-shaped fluctuating trend, which was characterized a predominantly over-allocation and a supplementary under-allocation. At the regional level, the degree of mismatch in the east fluctuated greatly and was higher than the national average after 2012, the central region was largely below the national average, the western region was always higher than the national average, and the northeast region showed an inverted "N"-shaped downward trend. (2) During the study period, the spatial under-allocation of construction land evolved from a belt-shaped distribution to a cluster-shaped distribution, and there was a characteristic of spreading from the southeastern coast to the inland areas. The spatial over-allocation always showed a pattern of contiguous distribution, and there was a tendency from peripheral distribution to internal aggregation. (3) From the perspective of different city sizes, small cities had the highest degree of mismatch, followed by megacities, then medium-sized cities, and finally large cities. However, the mismatch in megacities was more dominated by under-allocation, while other city sizes were mainly dominated by over-allocation. The results of the study help to improve the objectivity and scientificity of the identification of spatial mismatch of construction land and promote the optimization and improvement of the efficiency of construction land allocation.
SHI Hai-meng , CHEN Wei , LI Qiao , ZHANG Sun , WANG Ya-nan , ZHANG Heng . Spatial mismatch measurement and evolutionary characteristics of construction land use under undifferentiated land use comparison[J]. JOURNAL OF NATURAL RESOURCES, 2024 , 39(12) : 2962 -2979 . DOI: 10.31497/zrzyxb.20241214
表1 变量描述性统计Table 1 Descriptive statistics of variables |
| 变量 | 指标选择 | 样本数/个 | 均值 | 标准差 | 最小值 | 最大值 |
|---|---|---|---|---|---|---|
| 城市产出 | 地区生产总值/亿元 | 5700 | 729.21 | 1654.30 | 6.10 | 26174.68 |
| 资本投入 | 资本存量/亿元 | 5700 | 2599.01 | 5137.30 | 14.41 | 71502.67 |
| 劳动投入 | 有效劳动投入/(万人·年) | 5700 | 119.71 | 201.42 | 1.37 | 2803.173 |
| 土地投入 | 修正后建设用地面积/km2 | 5700 | 640.21 | 1548.42 | 12.48 | 23149.21 |
表2 不同规模城市的建设用地平均空间错配指数Table 2 Average spatial mismatch index of construction land in cities of different sizes |
| 年份 | 特大城市 | 大城市 | 中等城市 | 小城市 | 年份 | 特大城市 | 大城市 | 中等城市 | 小城市 |
|---|---|---|---|---|---|---|---|---|---|
| 2002 | 0.40 | 0.33 | 0.37 | 0.44 | 2013 | 0.38 | 0.31 | 0.33 | 0.37 |
| 2003 | 0.36 | 0.31 | 0.35 | 0.43 | 2014 | 0.39 | 0.31 | 0.34 | 0.38 |
| 2004 | 0.35 | 0.30 | 0.36 | 0.43 | 2015 | 0.40 | 0.32 | 0.34 | 0.37 |
| 2005 | 0.37 | 0.30 | 0.35 | 0.42 | 2016 | 0.36 | 0.33 | 0.36 | 0.37 |
| 2006 | 0.35 | 0.28 | 0.34 | 0.43 | 2017 | 0.36 | 0.32 | 0.36 | 0.40 |
| 2007 | 0.39 | 0.28 | 0.34 | 0.42 | 2018 | 0.38 | 0.33 | 0.36 | 0.40 |
| 2008 | 0.34 | 0.28 | 0.33 | 0.40 | 2019 | 0.38 | 0.34 | 0.36 | 0.41 |
| 2009 | 0.36 | 0.29 | 0.34 | 0.40 | 2020 | 0.38 | 0.35 | 0.36 | 0.39 |
| 2010 | 0.38 | 0.29 | 0.34 | 0.41 | 2021 | 0.46 | 0.37 | 0.36 | 0.38 |
| 2011 | 0.39 | 0.29 | 0.33 | 0.38 | 平均值 | 0.38 | 0.31 | 0.35 | 0.40 |
| 2012 | 0.40 | 0.30 | 0.34 | 0.37 |
表3 与其他研究结果的比较Table 3 Comparison with other findings |
| 作者 | 区域 | 时间/年 | 测度方法 | 平均错配程度 | 有无做可比性处理 | 错配特征 |
|---|---|---|---|---|---|---|
| 本文 | 285个地级市 | 2002—2021 | 拓展的HK模型 | 0.38 | 是 | 建设用地空间错配总体呈现出“W”型波动变化趋势 |
| 李力行等[5] | 282个地级市 | 2003—2007 | 协议出让面积/出让土地面积 | 0.59 | 否 | — |
| 张俊峰等[36] | 235个地级市 | 2001—2016 | 划拨用地数量/土地供应总量 | 0.52 | 否 | 建设用地错配呈现先下降后上升的发展趋势和西高东低的空间格局 |
| 程开明等[11] | 279 个地级市 | 2003—2018 | 竞争性空间一般均衡模型 | 1.25 | 否 | 土地空间错配先缓解后加剧。东北和西部城市供给过度、东部城市供给不足的特征突出。东北的土地供给过度特征最为明显 |
| 孟宏玮等[19] | 280个地级市 | 2010—2019 | 土地投入与经济产出的欧氏距离 | 0.61 | 否 | 东部的土地错配指数最低,东北和西部的较高。中部的土地错配指数变化较平稳 |
| Wang等[12] | 282个地级市和333个县 级市 | 2008—2017 | 人口和经济密 度变化的四象 限模型 | — | 否 | 与2008—2012年比,2013—2017年错配城市数量有所增加。后金融危机时代,地方政府的财政依赖加速了土地开发的错配,尤其是县级市,错配城市集中在东北和西北地区 |
| 彭山桂等[14] | 105个城市 | 2007—2019 | 拓展的HK模型 | 0.71 | 否 | — |
| 冯雨豪等[15] | 278个地级市 | 2003—2019 | 投入产出的错配模型 | 0.45 | 否 | 城市工业用地空间错配呈现先下降后上升的趋势 |
| [1] |
黄忠华, 杜雪君. 土地资源错配研究综述. 中国土地科学, 2014, 28(8): 80-87.
[
|
| [2] |
陆铭, 李鹏飞, 钟辉勇. 发展与平衡的新时代: 新中国70年的空间政治经济学. 管理世界, 2019, 35(10): 11-23, 63, 219.
[
|
| [3] |
张俊峰, 张安录. 中国土地资源错配效率损失与纠正策略. 华南农业大学学报: 社会科学版, 2020, 19(1): 55-65.
[
|
| [4] |
杨丹辉. 科学配置促进资源节约和高效利用(新论). http://opinion.people.com.cn/n1/2022/1102/c1003-32556841.html, 2022-12-15.
[
|
| [5] |
李力行, 黄佩媛, 马光荣. 土地资源错配与中国工业企业生产率差异. 管理世界, 2016, 32(8): 86-96.
[
|
| [6] |
张俊峰, 张雄, 张安录, 等. 建设用地空间错配理论、机制与效益损失: 基于湖北省的实证. 中国人口·资源与环境, 2020, 30(4): 42-53.
[
|
| [7] |
程开明, 于静涵. 中国城市土地供给错配: 特征事实及对全要素生产率的影响效应. 中国土地科学, 2022, 36(8): 43-54.
[
|
| [8] |
彭山桂, 孙昊, 郭正宁, 等. 土地资源空间错配对城市产业转型升级的影响及作用机制. 资源科学, 2022, 44(5): 871-885.
[
|
| [9] |
邓楚雄, 赵浩, 谢炳庚, 等. 土地资源错配对中国城市工业绿色全要素生产率的影响. 地理学报, 2021, 76(8): 1865-1881.
[
|
| [10] |
|
| [11] |
程开明, 于静涵. 中国城市资源空间错配: 特征测度与时空演进. 地理科学, 2023, 43(4): 617-628.
[
|
| [12] |
|
| [13] |
|
| [14] |
彭山桂, 李敏, 王健, 等. 土地资源错配的全要素生产率损失效应与形成机制. 中国土地科学, 2022, 36(8): 55-65.
[
|
| [15] |
冯雨豪, 王健, 邵子南, 等. 中国城市工业用地空间错配对工业全要素生产率的影响. 资源科学, 2022, 44(12): 2511-2524.
[
|
| [16] |
安勇, 赵丽霞. 土地资源错配、空间策略互动与城市创新能力. 中国土地科学, 2021, 35(4): 17-25.
[
|
| [17] |
毛文峰, 陆军. 土地资源错配、城市蔓延与地方政府债务: 基于新口径城投债数据的经验证据. 经济学家, 2020, (4): 80-88.
[
|
| [18] |
陈恭军. 土地资源错配、产业结构与雾霾污染: 基于空间计量和动态面板门槛模型的实证分析. 中国软科学, 2022, (12): 143-152.
[
|
| [19] |
孟宏玮, 赵华平, 张所地. 土地供给结构错配对城市碳排放效率的影响. 中国人口·资源与环境, 2023, 33(4): 56-69.
[
|
| [20] |
白东北, 张营营, 唐青青. 开发区设立与地区资源错配: 理论机制与经验辨识. 财经研究, 2020, 46(7): 49-63.
[
|
| [21] |
贾生华, 张娟锋. 土地资源配置体制中的灰色土地市场分析. 中国软科学, 2006, (3): 17-24.
[
|
| [22] |
曲福田, 田光明. 城乡统筹与农村集体土地产权制度改革. 管理世界, 2011, 27(6): 34-46, 187.
[
|
| [23] |
陈伟, 彭建超, 吴群. 基于容积率指数和单要素DEA方法的工业用地利用效率区域差异研究. 自然资源学报, 2015, 30(6): 903-916.
[
|
| [24] |
徐勇, 赵燊, 樊杰. 中国城市规划建设用地标准及气候和地形地貌修订. 地理学报, 2020, 75(1): 194-208.
[
|
| [25] |
中华人民共和国住房和城乡建设部. 城市居住区规划设计标准(GB 50180—2018). https://www.mohurd.gov.cn/gongkai/zhengce/zhengcefilelib/201811/20181130_238590.html, 2023-09-08.
[Ministry of Housing and Urban-Rural Development of the People's Republic of China. Urban residential area planning and design standard (GB 50180—2018). https://www.mohurd.gov.cn/gongkai/zhengce/zhengcefilelib/201811/20181130_238590.html, 2023-09-08.]
|
| [26] |
中华人民共和国自然资源部. 工业项目建设用地控制指标(2023年05月11日公告). https://www.gov.cn/zhengce/zhengceku/202306/content_6888447.htm, 2023-09-08.
[Ministry of Natural Resources of the People's Republic of China. Industrial project construction land control indicators. https://www.gov.cn/zhengce/zhengceku/202306/content_6888447.htm, 2023-09-08.]
|
| [27] |
中华人民共和国住房和城乡建设部. 城市用地分类与规划建设用地标准(GB 50137-2011). https://www.mohurd.gov.cn/gongkai/zhengce/zhengcefilelib/201201/20120104_208247.html, 2023-09-10.
[Ministry of Housing and Urban-Rural Development of the People's Republic of China. Urban land classification and planning construction land standard (GB 50137-2011). https://www.mohurd.gov.cn/gongkai/zhengce/zhengcefilelib/201201/20120104_208247.html, 2023-09-10.]
|
| [28] |
中华人民共和国交通运输部. 公路工程项目建设用地指标(建标〔2011〕124 号). https://xxgk.mot.gov.cn/2020/jigou/glj/202006/t20200623_3312366.html, 2023-09-10.
[Ministry of Transport of the People's Republic of China. Highway engineering project construction land index. https://xxgk.mot.gov.cn/2020/jigou/glj/202006/t20200623_3312366.html, 2023-09-10.]
|
| [29] |
|
| [30] |
张军, 吴桂英, 张吉鹏. 中国省际物质资本存量估算: 1952—2000. 经济研究, 2004, (10): 35-44.
[
|
| [31] |
梁建飞, 陈松林. 环境约束下的福建省城市建设用地利用效率及驱动因素. 自然资源学报, 2020, 35(12): 2862-2874.
[
|
| [32] |
赵扶扬, 陈斌开. 土地的区域间配置与新发展格局: 基于量化空间均衡的研究. 中国工业经济, 2021, (8): 94-113.
[
|
| [33] |
中华人民共和国国务院. 国务院关于调整城市规模划分标准的通知(国发〔2014〕51号). https://www.gov.cn/zhengce/content/2014-11/20/content_9225.htm, 2023-09-15.
[State Council of the People's Republic of China. Notification by the standard of state council on adjusting the urban scale. https://www.gov.cn/zhengce/content/2014-11/20/content_9225.htm, 2023-09-15.]
|
| [34] |
|
| [35] |
|
| [36] |
张俊峰, 王聪聪, 徐磊, 等. 中国建设用地错配时空特征、驱动机制及空间效应: 基于235个城市的实证分析. 热带地理, 2021, 41(2): 217-228.
[
|
| [37] |
曹祺文, 顾朝林, 管卫华. 基于土地利用的中国城镇化SD模型与模拟. 自然资源学报, 2021, 36(4): 1062-1084.
[
|
/
| 〈 |
|
〉 |