
JOURNAL OF NATURAL RESOURCES >
Evolution of agricultural green development in the Yangtze River Economic Belt based on the perspective of reducing chemical products input and increasing output
Received date: 2024-01-02
Revised date: 2024-06-11
Online published: 2024-10-16
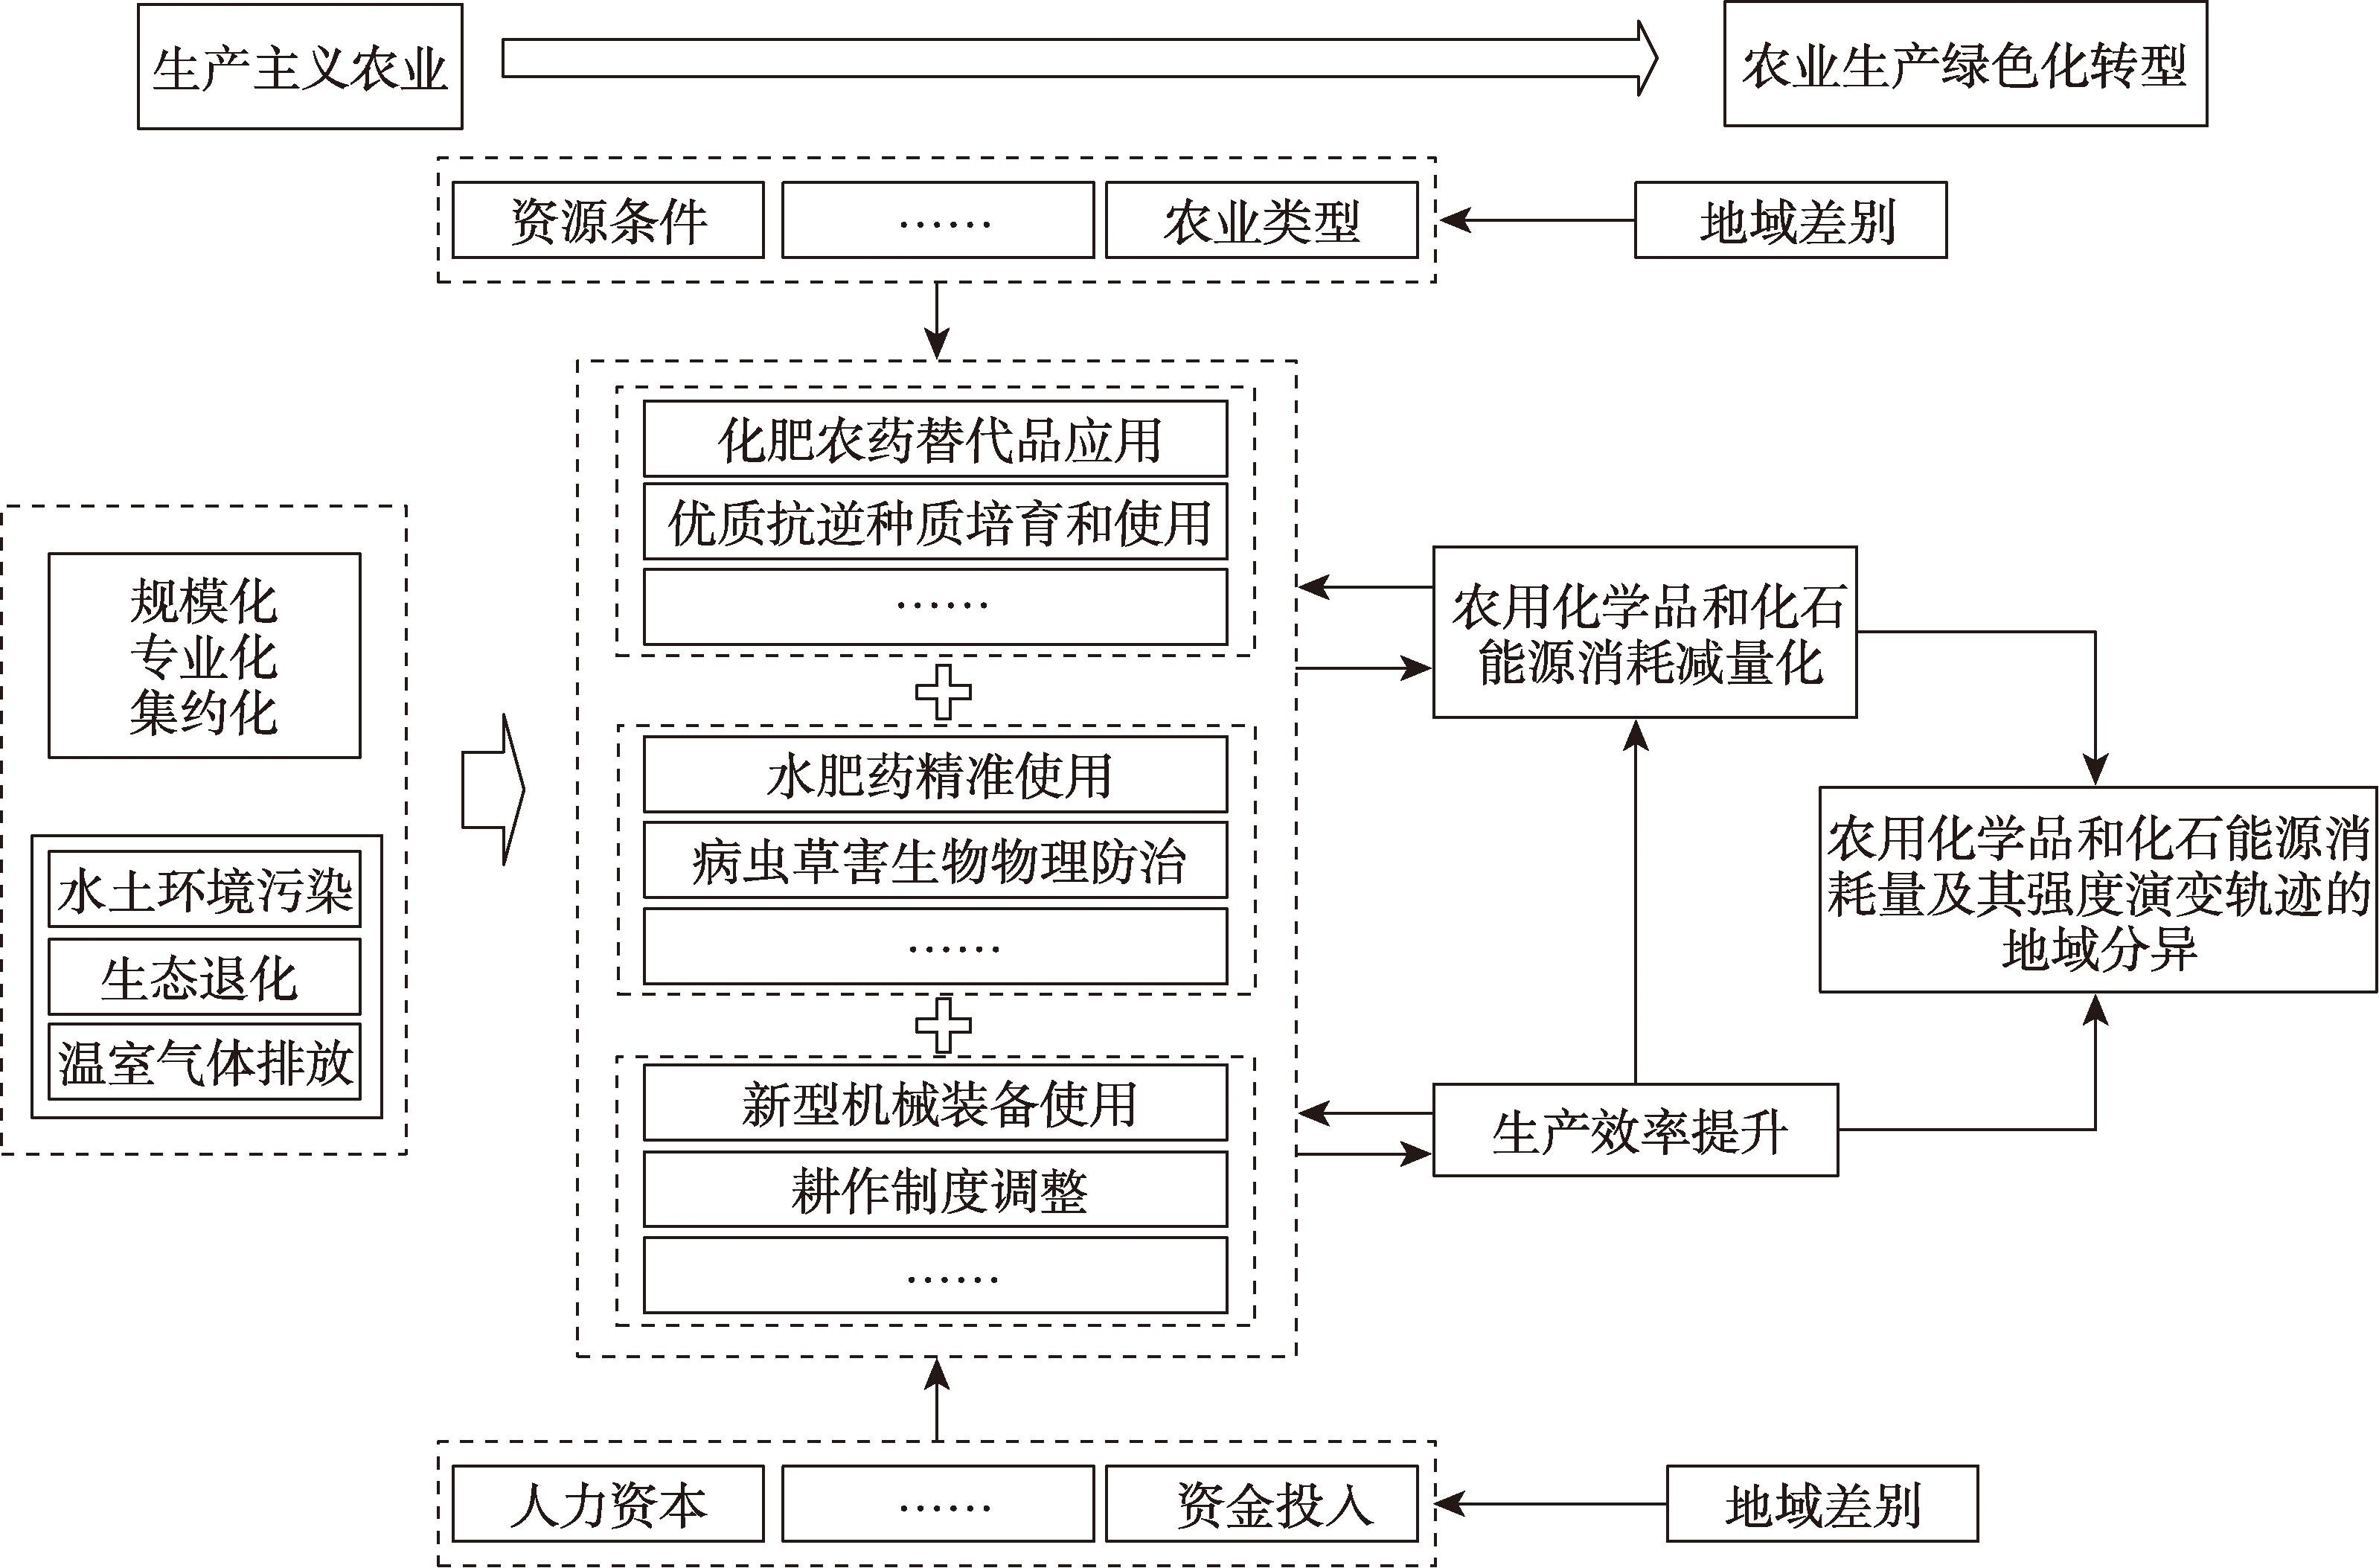
The green transformation in agricultural production is an important research topic in the field of agricultural sustainable development. Based on the concept of agricultural green development and theoretical analysis in terms of the transformation path, this paper aims to examine the major processes of the agricultural green development practices and assess the effects in reducing chemical products input and increasing agricultural output within the Yangtze River Economic Belt (YREB) in the past 20 years in combination of the methods of literature investigation, semi-structural interviews, questionnaire analysis and decoupling analysis. The results show that since 2015 the provincial-level regions within the YREB issued a set of policies related to the agricultural green development actions, which encouraged the farmers to replace the traditional chemical fertilizer with alternative and organic fertilizer, prevent and control the devastations caused by the diseases, insects and herbs with ecological measures, and reuse the agricultural residues in order to reduce the consumption of chemical fertilizer and pesticides and herbicides in agricultural production. Compared to the other regions in China, the YREB has a five-year lead in terms of achieving the great aims of zero growth and reduction of pesticide and chemical fertilizer use in agricultural production. Nevertheless, the current chemical fertilizer and pesticide usage intensity in the YREB is still more than two times the international average level. Although the chemical fertilizer and pesticide usage intensity in the downstream areas of the Yangtze River is much higher than that in the upstream areas due to the differentiation in terms of multiple crop index and agricultural output density, the chemical fertilizer and pesticide usage intensity appears to gradually disconnect with the multiple crop index and agricultural output density because of the wide application of new technologies for agricultural green development. However, the ongoing agricultural green development agenda within the studu area still faces challenges, including the rising costs in upgrading the production technology and agricultural machinery and equipment and the severe difficulty in overcoming ageing issues and introducing or fostering young talents in agricultural sector.
CHEN Cheng , WU Ke , CHEN Jiang-long . Evolution of agricultural green development in the Yangtze River Economic Belt based on the perspective of reducing chemical products input and increasing output[J]. JOURNAL OF NATURAL RESOURCES, 2024 , 39(10) : 2399 -2417 . DOI: 10.31497/zrzyxb.20241009
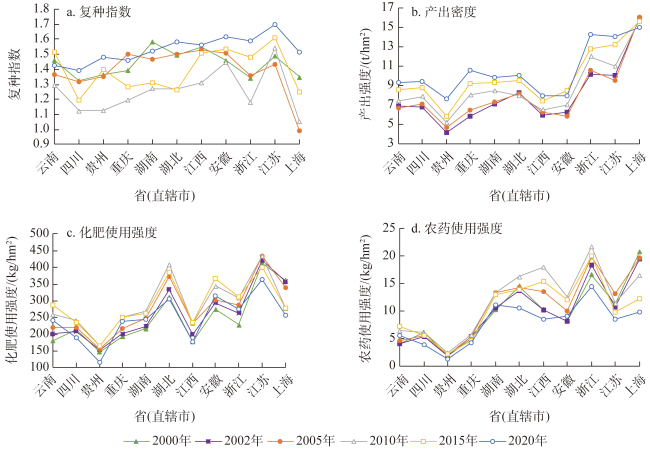
表1 基于指标变化率与弹性值的脱钩程度划分Table 1 The classification of decoupling based on the index change rate and elasticity value |
| 状态 | 程度 | 弹性 | 解释 | ||
|---|---|---|---|---|---|
| 脱钩 | 强脱钩 | <0 | >0 | T<0 | 农用化学品消耗强度下降,复种指数或农业产出密度上升 |
| 弱脱钩 | >0 | >0 | 0<T<0.8 | 农用化学品消耗强度上升,复种指数或农业产出密度上升(更快) | |
| 衰退脱钩 | <0 | <0 | T>1.2 | 农用化学品消耗强度下降(更快),复种指数或农业产出密度下降 | |
| 负脱钩 | 强负脱钩 | >0 | <0 | T<0 | 农用化学品消耗强度上升,复种指数或农业产出密度下降 |
| 弱负脱钩 | <0 | <0 | 0<T<0.8 | 农用化学品消耗强度下降,农业产出密度或复种指数也下降(更快) | |
| 扩张性负脱钩 | >0 | >0 | T>1.2 | 农用化学品消耗强度上升(更快),复种指数或农业产出密度均上升 | |
| 连接 | 扩张性连接 | >0 | >0 | 0.8<T<1.2 | 农用化学品消耗强度、复种指数或农业产出密度均上升,且增速相当 |
| 衰退连接 | <0 | <0 | 0.8<T<1.2 | 农用化学品消耗强度、复种指数或农业产出密度均下降,且降速相当 |
表2 各省(直辖市)化肥使用强度与复种指数的脱钩特征Table 2 Decoupling characteristics of fertilizer utilization intensity and multiple planting index in each province |
| 省(直辖市) | 2002—2010年 | 2010—2015年 | 2015—2020年 | |||||
|---|---|---|---|---|---|---|---|---|
| 脱钩指数 | 脱钩状态 | 脱钩指数 | 脱钩状态 | 脱钩指数 | 脱钩状态 | |||
| 上海 | 1.07 | 衰退连接 | 0.01 | 弱脱钩 | -0.37 | 强脱钩 | ||
| 江苏 | 1.53 | 扩张性负脱钩 | -1.74 | 强脱钩 | -1.59 | 强脱钩 | ||
| 浙江 | -2.95 | 强负脱钩 | 0.04 | 弱脱钩 | -1.65 | 强脱钩 | ||
| 安徽 | -27.71 | 强负脱钩 | 1.07 | 扩张性连接 | -2.60 | 强脱钩 | ||
| 江西 | -2.02 | 强负脱钩 | 0.09 | 弱脱钩 | -6.91 | 强脱钩 | ||
| 湖北 | -2.07 | 强负脱钩 | 8.98 | 衰退脱钩 | -0.80 | 强脱钩 | ||
| 湖南 | -1.20 | 强负脱钩 | -0.55 | 强脱钩 | -0.44 | 强脱钩 | ||
| 重庆 | -2.12 | 强负脱钩 | -0.09 | 强脱钩 | -0.37 | 强脱钩 | ||
| 四川 | -0.90 | 强负脱钩 | -0.46 | 强脱钩 | -1.15 | 强脱钩 | ||
| 贵州 | -0.70 | 强负脱钩 | 0.00 | 弱脱钩 | -5.25 | 强脱钩 | ||
| 云南 | -3.77 | 强负脱钩 | 0.63 | 弱脱钩 | 2.78 | 衰退脱钩 | ||
表3 各省(直辖市)农药使用强度与复种指数的脱钩特征Table 3 Decoupling characteristics of pesticide usage intensity and multiple cropping index in each province |
| 省(直辖市) | 2002—2010年 | 2010—2015年 | 2015—2020年 | |||||
|---|---|---|---|---|---|---|---|---|
| 脱钩指数 | 脱钩状态 | 脱钩指数 | 脱钩状态 | 脱钩指数 | 脱钩状态 | |||
| 上海 | 0.92 | 衰退连接 | -1.38 | 强脱钩 | -0.95 | 强脱钩 | ||
| 江苏 | 0.57 | 弱脱钩 | -3.29 | 强脱钩 | -2.25 | 强脱钩 | ||
| 浙江 | -2.61 | 强负脱钩 | -0.32 | 强脱钩 | -3.79 | 强脱钩 | ||
| 安徽 | -58.27 | 强负脱钩 | -0.70 | 强脱钩 | -4.58 | 强脱钩 | ||
| 江西 | -4.99 | 强负脱钩 | -0.98 | 强脱钩 | -12.02 | 强脱钩 | ||
| 湖北 | -0.80 | 强负脱钩 | 22.49 | 衰退脱钩 | -0.91 | 强脱钩 | ||
| 湖南 | -1.64 | 强负脱钩 | -0.97 | 强脱钩 | -0.94 | 强脱钩 | ||
| 重庆 | -1.05 | 强负脱钩 | -2.51 | 强脱钩 | -0.57 | 强脱钩 | ||
| 四川 | 0.00 | 弱负脱钩 | -1.34 | 强脱钩 | -1.91 | 强脱钩 | ||
| 贵州 | -2.43 | 强负脱钩 | -0.49 | 强脱钩 | -7.62 | 强脱钩 | ||
| 云南 | -5.51 | 强负脱钩 | 0.69 | 弱脱钩 | 4.22 | 衰退脱钩 | ||
表4 各省(直辖市)化肥使用强度与农业产出密度的脱钩特征Table 4 Decoupling characteristics of fertilizer utilization intensity and agricultural yield density in each province |
| 省(直辖市) | 2002—2010年 | 2010—2015年 | 2015—2020年 | |||||
|---|---|---|---|---|---|---|---|---|
| 脱钩指数 | 脱钩状态 | 脱钩指数 | 脱钩状态 | 脱钩指数 | 脱钩状态 | |||
| 上海 | 17.78 | 衰退脱钩 | -0.28 | 强负脱钩 | 1.84 | 衰退脱钩 | ||
| 江苏 | 0.36 | 弱脱钩 | -0.39 | 强脱钩 | -1.34 | 强脱钩 | ||
| 浙江 | 0.94 | 扩张性连接 | 0.16 | 弱脱钩 | -1.06 | 强脱钩 | ||
| 安徽 | 1.48 | 扩张性负脱钩 | 0.31 | 弱脱钩 | 2.26 | 衰退脱钩 | ||
| 江西 | 1.95 | 扩张性负脱钩 | 0.10 | 弱脱钩 | -3.56 | 强脱钩 | ||
| 湖北 | -5.34 | 强负脱钩 | -0.29 | 强脱钩 | -3.84 | 强脱钩 | ||
| 湖南 | 1.04 | 扩张性连接 | -0.17 | 强脱钩 | -1.11 | 强脱钩 | ||
| 重庆 | 0.69 | 弱脱钩 | -0.04 | 强脱钩 | -0.33 | 强脱钩 | ||
| 四川 | 1.04 | 扩张性连接 | -0.27 | 强脱钩 | -2.66 | 强脱钩 | ||
| 贵州 | 0.34 | 弱脱钩 | 0.00 | 弱脱钩 | -0.99 | 强脱钩 | ||
| 云南 | 3.64 | 扩张性负脱钩 | 0.68 | 弱脱钩 | -1.90 | 强脱钩 | ||
表5 各省(直辖市)农药使用强度与农业产出密度的脱钩特征Table 5 Decoupling characteristics of pesticide usage intensity and agricultural yield density in each province |
| 省(直辖市) | 2002—2010年 | 2010—2015年 | 2015—2020年 | |||||
|---|---|---|---|---|---|---|---|---|
| 脱钩指数 | 脱钩状态 | 脱钩指数 | 脱钩状态 | 脱钩指数 | 脱钩状态 | |||
| 上海 | 11.90 | 衰退脱钩 | 57.33 | 衰退脱钩 | 4.76 | 衰退脱钩 | ||
| 江苏 | 0.76 | 弱脱钩 | -0.74 | 强脱钩 | -1.90 | 强脱钩 | ||
| 浙江 | 1.04 | 扩张性连接 | -1.22 | 强脱钩 | -2.43 | 强脱钩 | ||
| 安徽 | 4.78 | 扩张性负脱钩 | -0.20 | 强脱钩 | 3.99 | 衰退脱钩 | ||
| 江西 | 8.85 | 扩张性负脱钩 | -1.04 | 强脱钩 | -6.19 | 强脱钩 | ||
| 湖北 | -4.32 | 强负脱钩 | -0.73 | 强脱钩 | -4.38 | 强脱钩 | ||
| 湖南 | 1.44 | 扩张性负脱钩 | -0.30 | 强脱钩 | -2.35 | 强脱钩 | ||
| 重庆 | 0.22 | 弱脱钩 | -1.27 | 强脱钩 | -0.51 | 强脱钩 | ||
| 四川 | 0.79 | 弱脱钩 | -0.77 | 强脱钩 | -4.41 | 强脱钩 | ||
| 贵州 | 1.47 | 扩张性负脱钩 | -0.91 | 强脱钩 | -1.44 | 强脱钩 | ||
| 云南 | 7.14 | 扩张性负脱钩 | 0.75 | 弱脱钩 | -2.89 | 强脱钩 | ||
| [1] |
|
| [2] |
|
| [3] |
|
| [4] |
|
| [5] |
毛飞, 孔祥智. 中国农业现代化总体态势和未来取向. 改革, 2012, (10): 9-21.
[
|
| [6] |
金书秦, 牛坤玉, 韩冬梅. 农业绿色发展路径及其“十四五”取向. 改革, 2020, (2): 30-39.
[
|
| [7] |
房艳刚, 刘继生. 基于多功能理论的中国乡村发展多元化探讨: 超越“现代化”发展范式. 地理学报, 2015, 70(2): 257-270.
[
|
| [8] |
张桃林. 加强土壤和产地环境管理促进农业可持续发展. 中国科学院院刊, 2015, 30(4): 435-444.
[
|
| [9] |
赵雪雁, 刘江华, 王蓉, 等. 基于市域尺度的中国化肥施用与粮食产量的时空耦合关系. 自然资源学报, 2019, 34(7): 1471-1482.
[
|
| [10] |
金书秦, 张哲晰, 胡钰, 等. 中国农业绿色转型的历史逻辑、理论阐释与实践探索. 农业经济问题, 2024, (3): 4-19.
[
|
| [11] |
尹昌斌, 李福夺, 王术, 等. 中国农业绿色发展的概念、内涵与原则. 中国农业资源与区划, 2021, 42(1): 1-6.
[
|
| [12] |
李翠霞, 许佳彬. 中国农业绿色转型的理论阐释与实践路径. 中州学刊, 2022, (9): 40-48.
[
|
| [13] |
马红坤, 毛世平. 日本和欧盟农业支持政策的转型路径比较与启示. 华中农业大学学报: 社会科学版, 2019, (5): 46-53, 166-167.
[
|
| [14] |
冯丹萌, 许天成. 中国农业绿色发展的历史回溯和逻辑演进. 农业经济问题, 2021, (10): 90-99.
[
|
| [15] |
魏琦, 张斌, 金书秦. 中国农业绿色发展指数构建及区域比较研究. 农业经济问题, 2018, (11): 11-20.
[
|
| [16] |
崔瑜, 刘文新, 蔡瑜, 等. 中国农村绿色化发展效率收敛了吗? 基于1997—2017年的实证分析. 农业技术经济, 2021, (2): 72-87.
[
|
| [17] |
葛鹏飞, 王颂吉, 黄秀路. 中国农业绿色全要素生产率测算. 中国人口·资源与环境, 2018, 28(5): 66-74.
[
|
| [18] |
杨建辉. 农业化学投入与农业经济增长脱钩关系研究: 基于华东6省1市数据. 自然资源学报, 2017, 32(9): 1517-1527.
[
|
| [19] |
|
| [20] |
王如如, 张郁, 房艳刚, 等. 农业生产转型视角的东北三省农业碳排放格局特征与作用机制. 地理研究, 2023, 42(8): 2264-2282.
[
|
| [21] |
|
| [22] |
杨忍, 陈燕纯, 张菁, 等. 20世纪90年代以来西方乡村地理研究的主要理论演变与启示. 地理科学, 2020, 40(4): 544-555.
[
|
| [23] |
|
| [24] |
蔡荣, 汪紫钰, 钱龙, 等. 加入合作社促进了家庭农场选择环境友好型生产方式吗? 以化肥、农药减量施用为例. 中国农村观察, 2019, (1): 51-65.
[
|
| [25] |
曾琳琳, 李晓云, 杨志海. 作物种植专业化与化肥减量来源: 兼顾经营规模的影响. 自然资源学报, 2022, 37(7): 1707-1721.
[
|
| [26] |
张林秀, 白云丽, 孙明星, 等. 从系统科学视角探讨农业生产绿色转型. 农业经济问题, 2021, (10): 42-50.
[
|
| [27] |
崔之珍, 李二玲, 刘晨光. 黄河流域绿色农业专业村的时空演变及机制. 经济地理, 2021, 41(12): 158-166.
[
|
| [28] |
|
| [29] |
钱宸, 李凡, 李先德, 等. 基于农户经济和环境“双优”目标的粮食主产区化肥施用优化模拟分析: 以邯郸地区小麦生产为例. 自然资源学报, 2021, 36(6): 1481-1493.
[
|
| [30] |
张英男, 龙花楼. 农业生产转型及其环境效应的研究进展与展望. 自然资源学报, 2022, 37(7): 1691-1706.
[
|
| [31] |
|
| [32] |
|
| [33] |
|
| [34] |
农业农村部新闻办公室. 化肥农药使用量零增长行动目标顺利实现. 粮油与饲料科技, 2021, (1): 51.
[Information Office of the Ministry of Agriculture and Rural Affairs. The target of zero growth in chemical fertilizer and pesticide use was successfully achieved. Grain Oil and Feed Technology, 2021, (1): 51.]
|
| [35] |
季雅岚, 吴文革, 孙雪原, 等. 机插秧同步侧深施肥技术对水稻产量及肥料利用率的影响. 中国稻米, 2019, 25(3): 101-104.
[
|
| [36] |
袁会珠, 杨代斌, 闫晓静, 等. 农药有效利用率与喷雾技术优化. 植物保护, 2011, 37(5): 14-20.
[
|
| [37] |
井睿, 张蚌蚌, 赵敏娟, 等. 近35年中国耕地集约度时空变化特征分析. 水土保持研究, 2019, 26(5): 353-358, 365.
[
|
| [38] |
潘丹. 中国化肥施用强度变动的因素分解分析. 华南农业大学学报: 社会科学版, 2014, 13(2): 24-31.
[
|
| [39] |
姚成胜, 黄琳, 吕晞, 等. 基于能值理论的中国耕地利用集约度时空变化分析. 农业工程学报, 2014, 30(8): 1-12.
[
|
| [40] |
|
/
| 〈 |
|
〉 |

