
JOURNAL OF NATURAL RESOURCES >
The impact of green technology innovation on carbon emissions from the perspective of urban agglomeration: The moderating effect of human capitals
Received date: 2024-01-22
Revised date: 2024-04-24
Online published: 2024-09-04
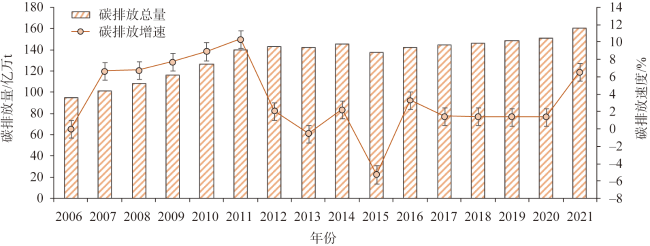
Under the goal of "carbon peaking and carbon neutrality", green technological innovation plays an important role in balancing high-quality economic development and carbon reduction. This article is based on panel data from 209 cities in 19 urban agglomerations from 2006 to 2021. On the basis of depicting the spatiotemporal evolution pattern of green technology innovation and carbon emissions, this paper empirically explores the nonlinear impact of green technology innovation on carbon emissions and discusses the moderating effect of human capital on the impact. First, from 2006 to 2021, the level of green technology innovation in China's urban agglomerations showed an upward trend, and the growth rate of carbon emissions showed the characteristics of first growth and then decline, and the growth rate of carbon emissions in urban agglomerations with higher levels of green technology innovation is significantly lower than that with lower levels of green technology innovation. Second, green technology innovation affects carbon emissions in an inverted "U"-shaped curve relationship that first promotes and then suppresses and it is affected by the level of urban agglomeration, geographical location, low-carbon policies, urban industrial structure and city scale. Third, human capital has a significant moderating effect on the impact of green technology innovation on carbon emissions. On the one hand, the increase in human capital strengthens the positive effect before the inflection point of the inverted "U"-shaped curve and the negative effect after the inflection point. On the other hand, it makes the carbon reduction threshold of green technology innovation level shifts to the right. The research conclusions of this article provide theoretical support and empirical evidence for improving human capital under the goal of "carbon peaking and carbon neutrality". With the improvement of human capital as the starting point, we will give full play to the carbon reduction effect of green technology innovation and implement the concept of green and low-carbon development.
WU Kang , GENG Yi-rui , GUO Tao . The impact of green technology innovation on carbon emissions from the perspective of urban agglomeration: The moderating effect of human capitals[J]. JOURNAL OF NATURAL RESOURCES, 2024 , 39(9) : 2121 -2139 . DOI: 10.31497/zrzyxb.20240907
表1 变量说明及描述性统计Table1 Descriptive statistics |
| 变量 | 变量赋值 | 观测值/个 | 均值 | 标准差 | 最小值 | 最大值 |
|---|---|---|---|---|---|---|
| lnCarbon | 碳排放总量/百万t | 3344 | 3.202 | 0.746 | 0.996 | 5.441 |
| lnGRP | 绿色专利申请数/件 | 3344 | 5.048 | 1.757 | 0.693 | 10.454 |
| HC | 城市大专及以上人口占全国大专及以上人口的比例/% | 3344 | 0.408 | 0.653 | 0.001 | 4.040 |
| lnPergdp | 人均地区生产总值/元 | 3344 | 10.600 | 0.711 | 7.926 | 13.056 |
| lnPOP | 单位面积人口数量/(人/km2) | 3344 | 8.028 | 0.697 | 5.864 | 9.908 |
| SEC | 第二产业增加值占比 | 3344 | 0.490 | 0.103 | 0.024 | 0.910 |
| lnINV | 固定资产投资总额/万元 | 3344 | 16.193 | 1.043 | 12.794 | 19.202 |
| lnFDI | 当年实际使用外资金额/万美元 | 3344 | 10.132 | 1.910 | 0 | 14.941 |
| lnPROAD | 人均道路面积/m2 | 3344 | 2.744 | 0.440 | 0.811 | 4.096 |
| Level | 城市群等级 | 3344 | 1.679 | 0.662 | 1.000 | 3.000 |
| Location | 地理区位 | 3344 | 0.407 | 0.491 | 0 | 1.000 |
| Lowcarbon | 是否低碳试点城市 | 3344 | 0.431 | 0.495 | 0 | 1.000 |
| Structure | 初期第三产业增加值占比是否大于第二产业增加值占比 | 3344 | 0.364 | 0.481 | 0 | 1.000 |
| Scale | 城区常住人口数/万人 | 3344 | 4.496 | 0.956 | 2.37 | 7.820 |
表2 绿色技术创新对碳排放影响的基准回归模型Table 2 The Benchmark Regression Model for the impact of green innovation on carbon emissions |
| 变量 | (1) | (2) | (3) | (4) | (5) | (6) | (7) |
|---|---|---|---|---|---|---|---|
| lnGRPt-1 | 0.1437*** | 0.1194*** | 0.1191*** | 0.1192*** | 0.1186*** | 0.1175*** | 0.1148*** |
| (19.591) | (16.045) | (15.999) | (16.007) | (15.934) | (15.714) | (15.209) | |
| lnGRP2t-1 | -0.0105*** | -0.0094*** | -0.0094*** | -0.0094*** | -0.0094*** | -0.0093*** | -0.0090*** |
| (-16.548) | (-15.007) | (-14.986) | (-14.993) | (-15.043) | (-14.687) | (-14.095) | |
| lnPergdp | 0.1443*** | 0.1441*** | 0.1451*** | 0.1247*** | 0.1214*** | 0.1184*** | |
| (11.983) | (11.967) | (11.912) | (8.677) | (8.359) | (8.131) | ||
| lnPOP | 0.0089 | 0.0089 | 0.0084 | 0.0084 | 0.0107* | ||
| (1.513) | (1.525) | (1.436) | (1.429) | (1.802) | |||
| SEC | -0.0065 | -0.0067 | -0.0064 | -0.0059 | |||
| (-0.573) | (-0.591) | (-0.565) | (-0.513) | ||||
| lnINV | 0.0199*** | 0.0192*** | 0.0204*** | ||||
| (2.684) | (2.582) | (2.749) | |||||
| lnFDI | 0.0026 | 0.0023 | |||||
| (1.521) | (1.329) | ||||||
| lnPROAD | 0.0260*** | ||||||
| (2.589) | |||||||
| Constant | 2.5628*** | 1.2035*** | 1.1357*** | 1.1195*** | 1.0280*** | 1.0486*** | 0.9861*** |
| (124.231) | (10.446) | (9.189) | (8.829) | (7.837) | (7.953) | (7.364) | |
| City FE | YES | YES | YES | YES | YES | YES | YES |
| Year FE | YES | YES | YES | YES | YES | YES | YES |
| Observations/个 | 3135 | 3135 | 3135 | 3135 | 3135 | 3135 | 3135 |
| R2 | 0.680 | 0.695 | 0.695 | 0.695 | 0.696 | 0.696 | 0.697 |
注:***、*分别表示p<0.01、p<0.1,下同。 |
表3 倒“U”型曲线检验结果Table 3 Results of inverted "U"-shaped curve test |
| 下界 | 上界 | |
|---|---|---|
| Interval | 0.693 | 10.454 |
| Slope | 0.102 | -0.074 |
| t | 14.767 | -7.811 |
| P>t | 0.000 | 0.000 |
注:是否存在倒“U”型测试:t=7.81,P>t=0.000 |
表4 工具变量及稳健性检验Table 4 Robustness test |
| 变量 | (1) lnCarbon | (2) lnCarbon | (3) lnPercarbon | (4) lnPercarbon | (5) lnCarbon |
|---|---|---|---|---|---|
| lnGRPt-1 | 0.622*** | 0.1294*** | |||
| (9.90) | (14.996) | ||||
| lnGRP2t-1 | -0.015*** | -0.0142*** | |||
| (-3.57) | (-19.407) | ||||
| lngpatt-1 | 0.1044*** | 0.1096*** | |||
| (14.203) | (12.955) | ||||
| lngpat2t-1 | -0.0094*** | -0.0140*** | |||
| (-13.768) | (-17.819) | ||||
| lnGRPi,t-1(low) | 0.0439*** | ||||
| (8.254) | |||||
| lnGRPi,t-1(high) | -0.0181** | ||||
| (-2.237) | |||||
| Constant | 5.7294*** | 1.0852*** | -5.0400*** | -4.9308*** | 1.2931*** |
| (0.914) | (8.012) | (-32.902) | (-31.639) | (8.963) | |
| Controls | YES | YES | YES | YES | |
| City FE | YES | YES | YES | YES | YES |
| Year FE | YES | YES | YES | YES | YES |
| Observations/个 | 3135 | 3135 | 3135 | 3135 | 3135 |
| R2 | 0.548 | 0.743 | 0.302 | 0.301 | 0.688 |
| First-stage Result | lnGRPt-1 | ||||
| lnInter | 0.406*** | ||||
| (25.21) | |||||
| KP-F值 | 174.825 |
注:(1)控制变量包括经济发展水平、人口密度、产业结构、固定资产投资、外商投资、交通基础设施、城市固定效应、年份固定效应;(2)**表示p<0.05。下同。 |
表5 人力资本对绿色技术创新与碳排放的影响机制Table 5 The mechanism of human capital's impact on green technology innovation and carbon emissions |
| 变量 | (1) 全样本 | (2) 持续三产 |
|---|---|---|
| lnGRPt-1 | 0.1305*** | 0.1171*** |
| (15.275) | (2.717) | |
| lnGRP2t-1 | -0.0124*** | 0.0009 |
| (-15.008) | (0.205) | |
| HC | -0.6429*** | -1.0269*** |
| (-8.213) | (-4.939) | |
| HC×lnGRPt-1 | 0.1647*** | 0.3058*** |
| (8.251) | (6.234) | |
| HC×lnGRP2t-1 | -0.0090*** | -0.0200*** |
| (-6.702) | (-6.243) | |
| Constant | 1.0422*** | -2.6796*** |
| (7.951) | (-3.633) | |
| Controls | YES | YES |
| City FE | YES | YES |
| Year FE | YES | YES |
| Observations/个 | 3135 | 360 |
| R2 | 0.710 | 0.605 |
表6 分城市群等级及区域异质性Table 6 Heterogeneity of urban agglomeration classification and region |
| 变量 | (1) 国家级 | (2) 区域级 | (3) 地区级 | (4) 东部 | (5) 中西部 |
|---|---|---|---|---|---|
| lnGRPt-1 | 0.0592*** | 0.0884*** | 0.1480*** | 0.0965*** | 0.0862*** |
| (5.985) | (7.393) | (5.508) | (7.901) | (8.488) | |
| lnGRP2t-1 | -0.0065*** | -0.0062*** | -0.0050 | -0.0092*** | -0.0045*** |
| (-7.852) | (-5.547) | (-1.610) | (-10.081) | (-4.597) | |
| Constant | 0.5658** | 0.7886*** | 0.5291 | 1.6129*** | 1.2611*** |
| (2.343) | (3.998) | (1.078) | (8.519) | (6.369) | |
| Controls | YES | YES | YES | YES | YES |
| City FE | YES | YES | YES | YES | YES |
| Year FE | YES | YES | YES | YES | YES |
| Observations/个 | 1350 | 1440 | 345 | 1275 | 1860 |
| R2 | 0.767 | 0.666 | 0.789 | 0.644 | 0.735 |
表7 是否低碳城市、主导产业以及城市规模异质性Table 7 Heterogeneity of low-carbon city, leading industry and city scale |
| 变量 | (1) 低碳 | (2) 非低碳 | (3) 服务型城市 | (4) 生产型城市 | (5) 城市规模 | |
|---|---|---|---|---|---|---|
| lnGRPt-1 | 0.1179*** | 0.1215*** | 0.0774*** | 0.1342*** | 0.0522** | |
| (9.487) | (12.174) | (6.131) | (14.253) | (2.089) | ||
| lnGRP2t-1 | -0.0099*** | -0.0098*** | -0.0066*** | -0.0103*** | -0.0118*** | |
| (-10.411) | (-10.242) | (-6.095) | (-12.958) | (-4.924) | ||
| Scale | -0.0471* | |||||
| (-1.753) | ||||||
| Scale×lnGRPt-1 | 0.0297*** | |||||
| (4.433) | ||||||
| Scale×lnGRP2t-1 | -0.0009* | |||||
| (-1.895) | ||||||
| Constant | 1.3433*** | 0.7562*** | 0.9935*** | 0.9847*** | 1.0403*** | |
| (6.187) | (4.265) | (4.590) | (5.805) | (6.988) | ||
| Controls | YES | YES | YES | YES | YES | |
| City FE | YES | YES | YES | YES | YES | |
| Year FE | YES | YES | YES | YES | YES | |
| Observations/个 | 1350 | 1785 | 1140 | 1995 | 3135 | |
| R2 | 0.662 | 0.735 | 0.746 | 0.677 | 0.703 | |
| [1] |
黄寰, 黄辉, 肖义, 等. 产业结构升级、政府生态环境注意力与绿色创新效率: 基于中国115个资源型城市的证据. 自然资源学报, 2024, 39(1): 104-124.
[
|
| [2] |
孙勇, 樊杰, 孙中瑞, 等. 黄河流域绿色技术创新时空格局及其影响因素分解. 生态经济, 2022, 38(5): 60-67.
[
|
| [3] |
|
| [4] |
|
| [5] |
|
| [6] |
|
| [7] |
|
| [8] |
|
| [9] |
|
| [10] |
|
| [11] |
|
| [12] |
|
| [13] |
|
| [14] |
|
| [15] |
|
| [16] |
|
| [17] |
贺晓丽, 逯进. 人力资本、技术创新与碳排放: 基于中国城市视角的讨论. 东方论坛, 2022, (6): 119-132.
[
|
| [18] |
谢长青, 叶林伟, 刘丽辉, 等. 人力资本、技术创新扩散与碳排放: 基于广东动态空间杜宾面板模型分析. 广东石油化工学院学报, 2022, 32(5): 49-54.
[
|
| [19] |
何伟军, 李闻钦, 邓明亮. 人力资本、绿色科技创新与长江经济带全要素碳排放效率. 科技进步与对策, 2022, 39(9): 23-32.
[
|
| [20] |
|
| [21] |
|
| [22] |
|
| [23] |
易信. 新一轮科技革命和产业变革对经济增长的影响研究: 基于多部门熊彼特内生增长理论的定量分析. 宏观经济研究, 2018, (11): 79-93.
[
|
| [24] |
杨莉莎, 朱俊鹏, 贾智杰. 中国碳减排实现的影响因素和当前挑战: 基于技术进步的视角. 经济研究, 2019, 54(11): 118-132.
[
|
| [25] |
张华, 魏晓平, 吕涛. 能源节约型技术进步、边际效用弹性与中国能源消耗. 中国地质大学学报: 社会科学版, 2015, 15(2): 11-22.
[
|
| [26] |
黄纯灿, 胡日东. 技术进步、能源效率及反弹效应: 基于索洛中性技术进步的再检验. 宏观经济研究, 2013, (4): 44-52, 111.
[
|
| [27] |
刘晔, 徐楦钫, 马海涛. 中国城市人力资本水平与人口集聚对创新产出的影响. 地理科学, 2021, 41(6): 923-932.
[
|
| [28] |
顾嵩楠, 万解秋. 我国省域人口流动对经济发展的传导机制研究: 基于门槛效应模型的分析. 西北人口, 2020, 41(4): 58-71.
[
|
| [29] |
刘俊, 白永秀, 韩先锋. 城市化对中国创新效率的影响: 创新二阶段视角下的SFA模型检验. 管理学报, 2017, 14(5): 704-712.
[
|
| [30] |
|
| [31] |
|
| [32] |
李健, 周慧. 中国碳排放强度与产业结构的关联分析. 中国人口·资源与环境, 2012, 22(1): 7-14.
[
|
| [33] |
徐国泉, 刘则渊, 姜照华. 中国碳排放的因素分解模型及实证分析: 1995—2004. 中国人口·资源与环境, 2006, 16(6): 158-161.
[
|
| [34] |
李锴, 齐绍洲. 贸易开放、经济增长与中国二氧化碳排放. 经济研究, 2011, 46(11): 60-72, 102.
[
|
| [35] |
朱勤, 彭希哲, 陆志明, 等. 人口与消费对碳排放影响的分析模型与实证. 中国人口·资源与环境, 2010, 20(2): 98-102.
[
|
| [36] |
|
| [37] |
李松亮, 曾小明, 曾祥炎, 等. 地级市尺度下人力资本的空间特征及驱动因子. 经济地理, 2020, 40(8): 43-48, 113.
[
|
| [38] |
方创琳, 张国友, 薛德升. 中国城市群高质量发展与科技协同创新共同体建设. 地理学报, 2021, 76(12): 2898-2908.
[
|
| [39] |
|
| [40] |
中国大连高级经理学院. 2021年能源行业碳排放及污染物排放. 中国能源发展报告(2022). 北京: 社会科学文献出版社, 2022: 191-194.
[China Business Executives Academy. Energy industry carbon emissions and pollutant emissions in 2021. Annual Report on China's Energy Development (2022). Beijing: Social Science Literature Press, 2022: 191-194.]
|
| [41] |
孙兴, 刘熙. 中国城市碳排放效率的时空演变及影响因素: 基于异质性空间随机前沿模型. 地理研究, 2023, 42(12): 3182-3201.
[
|
| [42] |
|
| [43] |
费威, 于宝鑫, 王维国. 数字经济发展与碳减排: 理论推演与实证检验. 经济学家, 2022, (11): 74-83.
[
|
| [44] |
|
| [45] |
韩峰, 阳立高. 生产性服务业集聚如何影响制造业结构升级? 一个集聚经济与熊彼特内生增长理论的综合框架. 管理世界, 2020, 36 (2): 72-94, 219.
[
|
| [46] |
方创琳, 毛其智, 倪鹏飞. 中国城市群科学选择与分级发展的争鸣及探索. 地理学报, 2015, 70(4): 515-527.
[
|
| [47] |
武力超, 吴政贤, 林澜, 等. 新能源汽车产业政策对企业技术创新的影响研究. 科学管理研究, 2023, 41(3): 71-78.
[
|
| [48] |
王之禹, 李富强. 城市规模对创新活动的影响: 基于区域知识吸收能力视角的分析. 中国软科学, 2021, (8): 140-151.
[
|
| [49] |
郭沛, 梁栋. 低碳试点政策是否提高了城市碳排放效率: 基于低碳试点城市的准自然实验研究. 自然资源学报, 2022, 37(7): 1876-1892.
[
|
| [50] |
孙伟增, 牛冬晓, 万广华. 交通基础设施建设与产业结构升级: 以高铁建设为例的实证分析. 管理世界, 2022, 38(3): 19-34, 58, 35-41.
[
|
| [51] |
|
/
| 〈 |
|
〉 |


