
JOURNAL OF NATURAL RESOURCES >
Regional differences in the evolution of territorial space and its driving mechanisms in Chinese border areas
Received date: 2023-08-21
Revised date: 2023-11-22
Online published: 2024-05-11
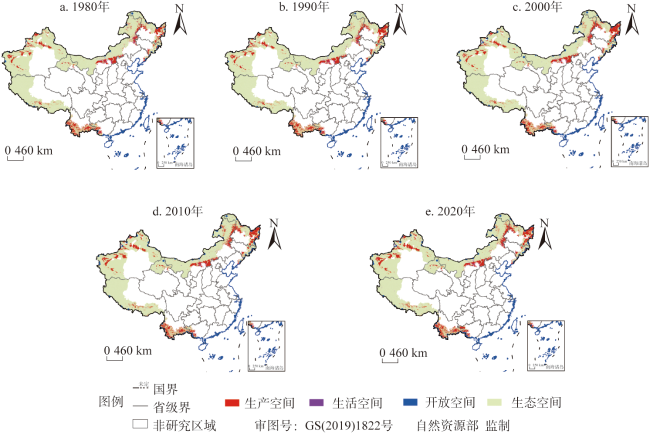
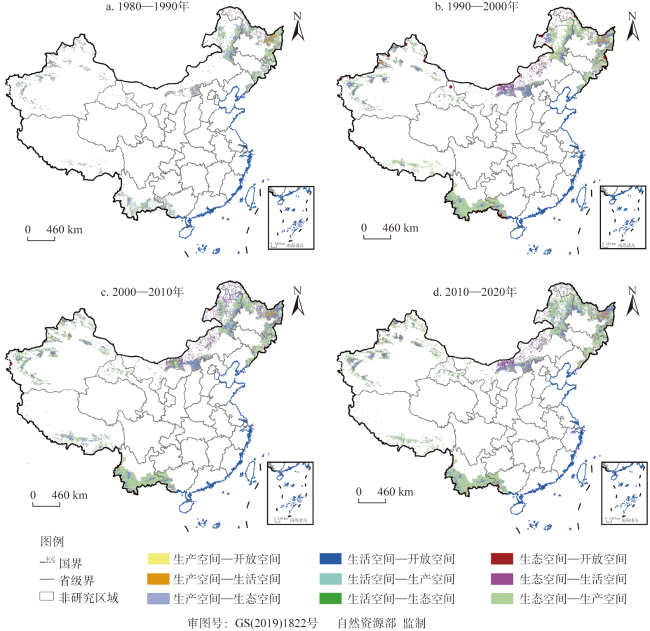
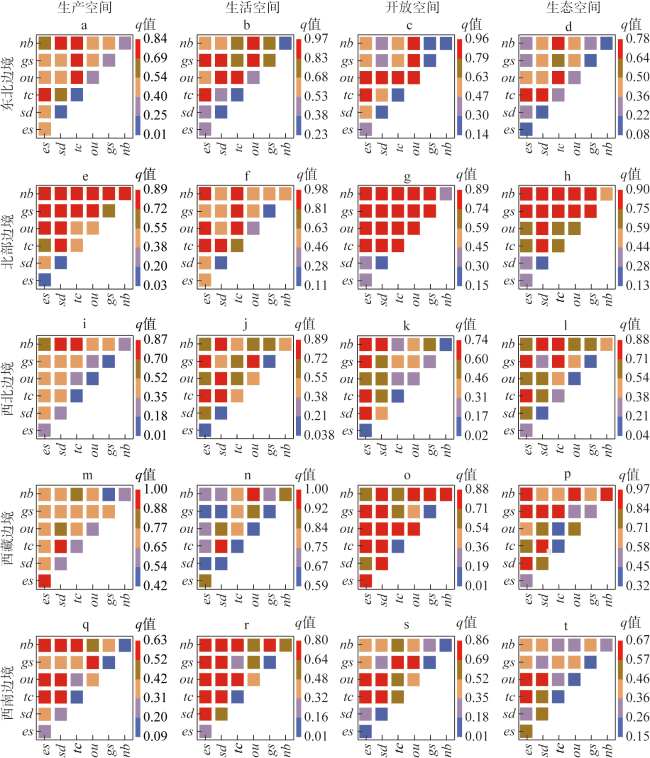
Since the implementation of reform and opening up policy in 1978, the combined effects of cross-border cooperation, population movement and urbanization in the border areas have exacerbated land-use conflicts. Border areas are facing the unbalanced development in terms of the differences in geostrategic environments, resource endowments, and economic development. With an aim to achieve the optimal allocation of regional territorial resources and balanced development, it is crucial that the laws of spatial differences in territorial spatial evolution and its driving mechanisms under different development gradients can be scientifically identified. Using 45 border areas in China as examples, this study analyzed the evolution process and influencing factors of the "production-living-open-ecological" space by applying models such as territorial spatial dynamics, land-use transfer matrix and geodetector. The results showed that: (1) From 1980 to 2020, the production, living and open space in Chinese border areas expanded while the ecological space shrank. The structure of "one belt, three zones and multiple points" revealed the dramatic pattern. Given that the spatial composition of the border areas is dominated by the terrestrial ecological space composed of mountains, rivers and potential ecological space, the border zone holds tremendous value and potential including the ecological value and the service capacity. (2) The conflicts of territorial space in the border areas mainly occurred during the urbanization and opening to the outside world when the population and industrial agglomeration promote the mutual transformation, competition and integration between different spaces. The conversion type of territorial space was mainly the interconversion of production space, open space and ecological space. Consequently, the conflicts would lead to the increasingly significant regional differences. (3) The driving factors affecting different territorial spatial changes have varying effects, with economic dynamics and opening to the outside world being the main influencing factors for territorial spatial evolution in the border areas. Therefore, the relevant government departments from the border areas should comprehensively consider the characteristics of different regions, leverage their geographic advantages, and formulate differentiated zoning and regulatory strategies to promote the efficient utilization of territorial space and achieve the high-quality regional development.

GU Guan-hai , WU Bin , ZHANG Wen-zhu , LU Ru-cheng , WANG Pei-qiong , LIAO Wen-hui , FENG Xiao-ling . Regional differences in the evolution of territorial space and its driving mechanisms in Chinese border areas[J]. JOURNAL OF NATURAL RESOURCES, 2024 , 39(5) : 1022 -1038 . DOI: 10.31497/zrzyxb.20240503
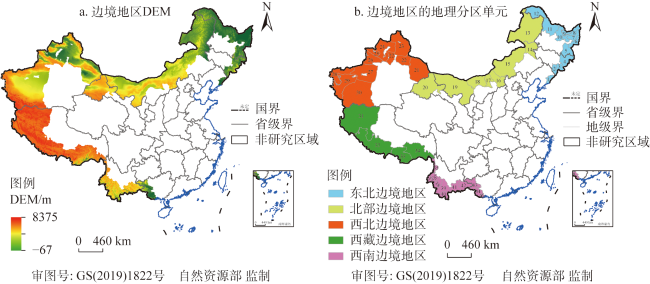
图1 研究区域示意图注:本图基于自然资源部标准地图服务网站下载的标准地图制作,底图无修改,下同。图b中序号1~45分别表示:1. 丹东市,2. 通化市,3. 白山市,4. 延边朝鲜族自治州,5. 牡丹江市,6. 鸡西市,7. 佳木斯市,8. 双鸭山市,9. 鹤岗市,10. 伊春市,11. 黑河市,12. 大兴安岭地区,13. 呼伦贝尔市,14. 兴安盟,15. 锡林郭勒盟,16. 乌兰察布市,17. 包头市,18. 巴彦淖尔市,19. 阿拉善盟,20. 酒泉市,21. 哈密市,22. 昌吉回族自治州,23. 阿勒泰地区,24. 塔城地区,25. 博尔塔拉蒙古自治州,26. 伊犁哈萨克自治州,27. 阿克苏地区,28. 克孜勒苏柯尔克孜自治州,29. 喀什地区,30. 和田地区,31. 阿里地区,32. 日喀则市,33. 山南市,34. 林芝市,35. 怒江傈僳族自治州,36. 保山市,37. 德宏傣族景颇族自治州,38. 临沧市,39. 普洱市,40. 西双版纳傣族自治州,41. 红河哈尼族彝族自治州,42. 文山壮族苗族自治州,43. 百色市,44. 崇左市,45. 防城港市。 Fig. 1 Study area diagram |
表1 中国边境地区“生产—生活—开放—生态”空间分类体系Table 1 Classification system of "production-living-open-ecological" space in Chinese border areas |
| 一级分类 | 二级分类 | 三级分类 |
|---|---|---|
| 生产空间 | 农业生产空间 | 水田、旱地 |
| 工矿生产空间 | 工矿用地及其附属交通用地 | |
| 生活空间 | 城镇生活空间 | 城镇用地 |
| 农村生活空间 | 农村居民点 | |
| 开放空间 | 对外开放型空间 | 边境口岸、边境经济合作区、跨境经济合作区和边民互市点等开放平台及其20 km缓冲区 |
| 生态空间 | 绿地生态空间 | 有林地、灌木林、疏林地、其他林地、高覆盖度草地、中覆盖度草地、低覆盖度草地 |
| 水域生态空间 | 河渠、湖泊、坑塘、滩涂、滩地 | |
| 潜在生态空间 | 裸土地、裸岩石砾地、沙地、盐碱地、其他未利用地 |
表2 边境地区国土空间变化影响因素指标体系构建Table 2 Construction of the index system for factors affecting territorial spatial changes in border areas |
| 维度 | 指标/单位 | 序号 | 指标解释 |
|---|---|---|---|
| 经济动力 (es) | 地均GDP/(亿元/km2) | x1 | 表征地区生产活动的最终水平 |
| 产业结构/% | x2 | 用地区二三产业产值占GDP总量的比例表征 | |
| 地均固定资产投资/(亿元/km2) | x3 | 表征地区固定资产投资规模、结构和发展速度 | |
| 市场机会/% | x4 | 衡量邻国与地区的经济发展差异程度(以周边国家人均GDP和边境地区人均GDP表示) | |
| 地均社会消费品零售总额/(亿元/km2) | x5 | 反映地区在一定时期的宏观经济景气程度 | |
| 社会发展 (sd) | 地均人口数/(人/km2) | x6 | 一定时期居住在某区域内单位土地面积人口数,即人口数/土地面积 |
| 国民总投资/亿元 | x7 | 一定时期内固定资产投资与流动资产投资之和 | |
| 地方财政收入/亿元 | x8 | 地方政府通过税收、非税收入和其他财政收入获得的资金总额 | |
| 地方财政支出/亿元 | x9 | 地方财政将把筹集到的资金用于满足经济建设和各种项目的需要 | |
| 教育水平/% | x10 | 以每万名中小学生中普通中学在校生人数来衡量 | |
| 医疗水平/% | x11 | 以每万人拥有医疗机构床位数来衡量 | |
| 交通水平 (tc) | 人均公路里程/(km/人) | x12 | 衡量区域道路建设和发展规模的重要指标 |
| 航空建设水平 | x13 | 为衡量航空发展水平,对机场建设情况进行打分:3C级机场得1分,4C级机场得2分,4D级机场得3分 | |
| 对外开放 (ou) | 口岸建设水平 | x14 | 衡量边境地区的口岸发展水平,其中一类口岸得2分,其余类别的口岸得1分 |
| 优惠指数 | x15 | 衡量国家政策支持力度(根据各地享受的政策条件来赋分,每项政策1分):如东北振兴、西部大开发、边境经济合作区等 | |
| 对外依存度/% | x16 | 衡量边境地区进出口贸易活跃程度(进出口总额/GDP) | |
| 国际旅游外汇/亿元 | x17 | 衡量边境地区的国际旅游业发展水平 | |
| 地缘态势 (gs) | 邻国安全状况 | x18 | 用国家脆弱性指数来衡量,是系统和平中心综合国家主权特征与军队冲突次数等综合测算的指数,可用于表征边境的外部的地缘态势影响 |
| 边防派出所/个 | x19 | 衡量边境内部安全,统计边境线上的边防派出所数量 | |
| 自然承载 (nb) | 平均海拔/m | x20 | 衡量边境地区的地形条件,每个市单位的平均海拔 |
| 地形起伏度/m | x21 | 单位面积内最大相对高程差,反映地面相对高差,是描述地貌形态的定量指标 | |
| 平均气温/℃ | x22 | 衡量边境地区气候特征的重要指标 |
表3 1980—2020 年中国边境地区国土空间面积占比及动态度变化Table 3 Changes in the area proportions and dynamics of territorial space in Chinese border areas from 1980 to 2020 (%) |
| 时间段/年 | 统计参数 | 生产空间 | 生活空间 | 开放空间 | 生态空间 | |||||||
|---|---|---|---|---|---|---|---|---|---|---|---|---|
| 农业生 产空间 | 工矿生 产空间 | 城镇生 活空间 | 农村生 活空间 | 对外开放型空间 | 绿地生 态空间 | 水域生 态空间 | 潜在生 态空间 | |||||
| 1980 | 面积 占比 | 6.30 | 0.02 | 0.05 | 0.33 | 1.11 | 56.84 | 2.43 | 32.92 | |||
| 1990 | 6.73 | 0.02 | 0.06 | 0.35 | 1.11 | 56.51 | 2.43 | 32.79 | ||||
| 2000 | 7.09 | 0.02 | 0.06 | 0.34 | 3.04 | 54.67 | 2.42 | 32.36 | ||||
| 2010 | 7.73 | 0.06 | 0.10 | 0.34 | 3.26 | 49.3 | 2.30 | 36.91 | ||||
| 2020 | 8.02 | 0.14 | 0.12 | 0.38 | 3.43 | 50.13 | 2.32 | 35.46 | ||||
| 1980—1990 | 空间 动态度 | 0.72 | 6.78 | 14.92 | 6.57 | 0 | -0.57 | -0.07 | -0.40 | |||
| 1990—2000 | 5.34 | 6.02 | 5.14 | -0.17 | 176.30 | -2.67 | 0.28 | -0.71 | ||||
| 2000—2010 | 230.80 | 9.11 | 62.91 | -0.34 | 7.29 | -9.79 | -4.85 | 14.09 | ||||
| 2010—2020 | 114.17 | 3.76 | 17.39 | 10.78 | 5.07 | 1.74 | 0.93 | -3.86 | ||||
| 1980—2020 | 568.96 | 28.16 | 131.07 | 17.45 | 211.45 | -11.18 | -3.76 | 8.47 | ||||
表4 1980—2020年中国边境地区“生产—生活—开放—生态”空间变化转移矩阵Table 4 Transition matrix of "production-living-open-ecological" space changes in Chinese border areas from 1980 to 2020 |
| 1980年 | 2020年 | ||||||||
|---|---|---|---|---|---|---|---|---|---|
| 农业生产 空间 | 工矿生产 空间 | 城镇生活空间 | 农村生活空间 | 对外开放型空间 | 绿地生态 空间 | 水域生态空间 | 潜在生态 空间 | 总计转出 面积 | |
| 农业生产空间 | — | 812.02 | 1511.43 | 3189.32 | 7965.35 | 19452.20 | 1422.41 | 1695.40 | 36048.14 |
| 工矿生产空间 | 36.95 | — | 35.79 | 23.71 | 62.66 | 41.62 | 35.74 | 65.47 | 301.94 |
| 城镇生活空间 | 81.02 | 1975.13 | — | 18.88 | 170.85 | 25.81 | 7.76 | 2.57 | 315.52 |
| 农村生活空间 | 1975.13 | 29.76 | 156.52 | — | 271.62 | 473.08 | 52.09 | 55.73 | 3013.93 |
| 对外开放型空间 | 0 | 0 | 0 | 0 | — | 0 | 0 | 0 | 0 |
| 绿地生态空间 | 73223.83 | 1926.21 | 706.08 | 1360.53 | 45098.56 | — | 18004.33 | 249797.32 | 390116.86 |
| 水域生态空间 | 1122.67 | 45.81 | 24.61 | 28.87 | 1233.33 | 11518.68 | — | 22213.76 | 36187.73 |
| 潜在生态空间 | 18532.22 | 1515.17 | 203.06 | 279.39 | 12712.26 | 135174.28 | 13397.23 | — | 181813.62 |
| 总计转入面积 | 94971.83 | 4337.61 | 2637.49 | 4900.70 | 67514.63 | 166685.66 | 32919.56 | 273830.26 | 647797.74 |
| 增减量 | 58923.69 | 4035.67 | 2321.97 | 1886.77 | 67514.63 | 223431.20 | -3268.17 | 92016.64 | — |
| 增减率 | 27.30 | 600.00 | 140.00 | 15.15 | 209.01 | -11.81 | -4.53 | 7.72 | 27.30 |
注:增减率的单位为%,其他单位均为km2。 |
表5 1980—2020年中国边境地区“生产—生活—开放—生态”空间转换类型面积统计Table 5 Area statistics of "production-living-open-ecological" space transition types in Chinese border areas from 1980 to 2020 |
| 转换类型 | 1980—1990年 | 1990—2000年 | 2000—2010年 | 2010—2020年 | 合计 | |
|---|---|---|---|---|---|---|
| 生产空间_开放空间 | 面积/km2 | 0 | 6965.38 | 379.73 | 686.61 | 8031.71 |
| 占比/% | 0 | 6.97 | 0.35 | 0.81 | 2.53 | |
| 生产空间_生活空间 | 面积/km2 | 601.49 | 925.02 | 3915.03 | 3048.43 | 8489.98 |
| 占比/% | 2.39 | 0.92 | 3.63 | 3.61 | 2.68 | |
| 生产空间_生态空间 | 面积/km2 | 4480.44 | 11457.43 | 33171.29 | 29050.07 | 78159.23 |
| 占比/% | 17.81 | 11.46 | 30.77 | 34.44 | 24.63 | |
| 生活空间_开放空间 | 面积/km2 | 0 | 442.52 | 7.04 | 11.60 | 461.16 |
| 占比/% | 0 | 0.44 | 0.01 | 0.01 | 0.15 | |
| 生活空间_生产空间 | 面积/km2 | 36.80 | 640.74 | 3258.18 | 1804.41 | 5740.13 |
| 占比/% | 0.15 | 0.64 | 3.02 | 2.14 | 1.81 | |
| 生活空间_生态空间 | 面积/km2 | 9.90 | 121.77 | 1197.57 | 949.83 | 2279.06 |
| 占比/% | 0.04 | 0.12 | 1.11 | 1.13 | 0.72 | |
| 生态空间_开放空间 | 面积/km2 | 0 | 48041.73 | 6125.89 | 3717.53 | 57885.15 |
| 占比/% | 0 | 48.04 | 5.68 | 4.41 | 18.24 | |
| 生态空间_生产空间 | 面积/km2 | 19583.68 | 31133.84 | 57877.69 | 43481.28 | 152076.49 |
| 占比/% | 77.85 | 31.13 | 53.68 | 51.55 | 47.93 | |
| 生态空间_生活空间 | 面积/km2 | 441.91 | 275.94 | 1880.34 | 1600.20 | 4198.38 |
| 占比/% | 1.76 | 0.28 | 1.74 | 1.90 | 1.32 | |
注:“A空间_B空间”表示由A空间转换为B空间的类型。 |
| [1] |
王思语, 昌忠泽, 韩子月. 改革开放以来中国贸易结构测度、演变及空间格局研究. 中国软科学, 2023, (2): 23-34.
[
|
| [2] |
|
| [3] |
宋周莺, 祝巧玲. 中国边境地区的城镇化格局及其驱动力. 地理学报, 2020, 75(8): 1603-1616.
[
|
| [4] |
肖池伟, 李鹏, 封志明. 地缘政治经济背景下中老—中越边境地区橡胶林时空扩展特征研究. 地球信息科学学报, 2022, 24(8): 1512-1524.
[
|
| [5] |
顾观海, 吴彬, 张文主, 等. 中国陆地边境带建设用地开发强度的时空分异及驱动机制研究. 中国土地科学, 2022, 36(7): 94-105.
[
|
| [6] |
刘继来, 刘彦随, 李裕瑞. 中国“三生空间”分类评价与时空格局分析. 地理学报, 2017, 72(7): 1290-1304.
[
|
| [7] |
刘彦随, 陈聪, 李玉恒. 中国新型城镇化村镇建设格局研究. 地域研究与开发, 2014, 33(6): 1-6.
[
|
| [8] |
郭垠宏, 宋涛, 孙曼. 安全、发展与开放关联下的中国边境地域功能演化及时段划分. 地理研究, 2023, 42(10): 2574-2591.
[
|
| [9] |
李广东, 方创琳. 城市生态—生产—生活空间功能定量识别与分析. 地理学报, 2016, 71(1): 49-65.
[
|
| [10] |
逯承鹏, 纪薇, 刘志良, 等. 黄河流域甘肃段县域“三生”功能空间时空格局及影响因素识别. 地理科学, 2022, 42(4): 579-588.
[
|
| [11] |
|
| [12] |
|
| [13] |
|
| [14] |
崔家兴, 顾江, 孙建伟, 等. 湖北省三生空间格局演化特征分析. 中国土地科学, 2018, 32(8): 67-73.
[
|
| [15] |
鞠洪润, 张生瑞, 闫逸晨. 1980—2020年粤港澳大湾区城镇用地空间格局类型演变及其驱动力多维探测. 地理学报, 2022, 77(5): 1086-1101.
[
|
| [16] |
林树高, 陆汝成, 刘少坤, 等. 基于“三生”空间的广西边境地区土地利用格局及多功能演变. 农业工程学报, 2021, 37(5): 265-274.
[
|
| [17] |
焦庚英, 杨效忠, 黄志强, 等. 县域“三生空间”格局与功能演变特征及可能影响因素分析: 以江西婺源县为例. 自然资源学报, 2021, 36(5): 1252-1267.
[
|
| [18] |
孔冬艳, 陈会广, 吴孔森. 中国“三生空间”演变特征、生态环境效应及其影响因素. 自然资源学报, 2021, 36(5): 1116-1135.
[
|
| [19] |
曲衍波, 王世磊, 朱伟亚, 等. 黄河三角洲国土空间演变的时空分异特征与驱动力分析. 农业工程学报, 2021, 37(6): 252-263.
[
|
| [20] |
孙婧雯, 刘彦随, 戈大专, 等. 平原农区土地综合整治与乡村转型发展协同机制. 地理学报, 2022, 77(8): 1971-1986.
[
|
| [21] |
周昱辰, 尹丹, 黄庆旭, 等. 基于生态系统服务参与式制图的“三生”空间优化建议: 以白洋淀流域为例. 自然资源学报, 2022, 37(8): 1988-2003.
[
|
| [22] |
邹利林, 章丽君, 刘彦随. 生态文明背景下国土空间功能研究: 过去、现在与未来. 地理科学进展, 2022, 41(7): 1312-1324.
[
|
| [23] |
孙久文, 蒋治. 沿边地区对外开放70年的回顾与展望. 经济地理, 2019, 39(11): 1-8.
[
|
| [24] |
凌子燕, 李延顺, 蒋卫国, 等. 山江海交错带城市群国土三生空间动态变化特征: 以广西北部湾城市群为例. 经济地理, 2022, 42(2): 18-24.
[
|
| [25] |
宋永永, 薛东前, 夏四友, 等. 近40a黄河流域国土空间格局变化特征与形成机理. 地理研究, 2021, 40(5): 1445-1463.
[
|
| [26] |
林树高, 诸培新, 陆汝成, 等. 贸易—经济—人口系统对边境地区国土空间格局演变区域差异的影响: 以中越边境带为例. 自然资源学报, 2023, 38(6): 1550-1569.
[
|
| [27] |
时振钦, 邓伟, 张少尧. 近25年横断山区国土空间格局与时空变化研究. 地理研究, 2018, 37(3): 607-621.
[
|
| [28] |
匡文慧. 新时代国土空间格局变化和美丽愿景规划实施的若干问题探讨. 资源科学, 2019, 41(1): 23-32.
[
|
| [29] |
|
| [30] |
庄芮, 宋荟柯, 张晓静. 我国沿边开放战略思考: 历史逻辑与推进方向. 国际贸易, 2021, (7): 45-52, 75.
[
|
| [31] |
孙久文, 周玉龙, 和瑞芳. 中国的沿边经济发展: 现状、问题和对策. 经济社会体制比较, 2017, (2): 28-38.
[
|
/
| 〈 |
|
〉 |