
JOURNAL OF NATURAL RESOURCES >
Can integration of rural primary, secondary and tertiary industries promote agricultural green development? A case study of 579 counties in China's Yangtze River Economic Belt
Received date: 2023-07-09
Revised date: 2023-11-21
Online published: 2024-03-12
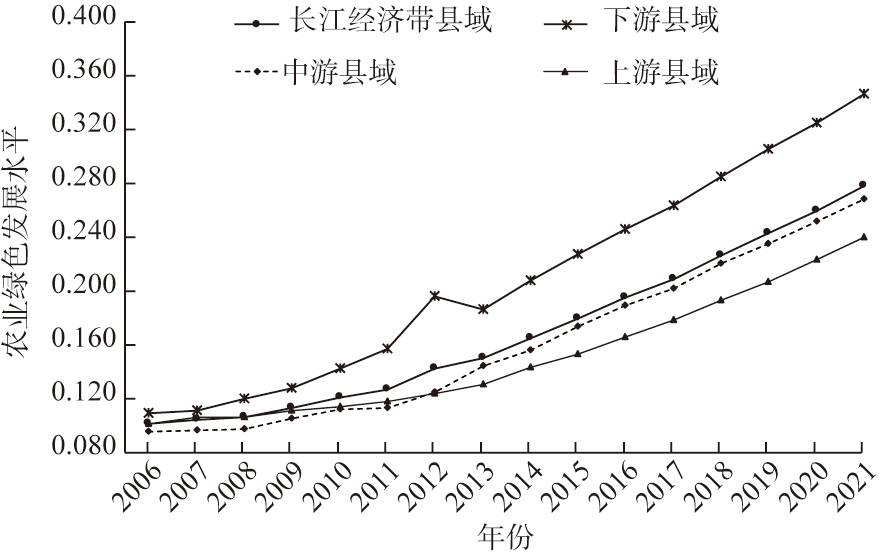
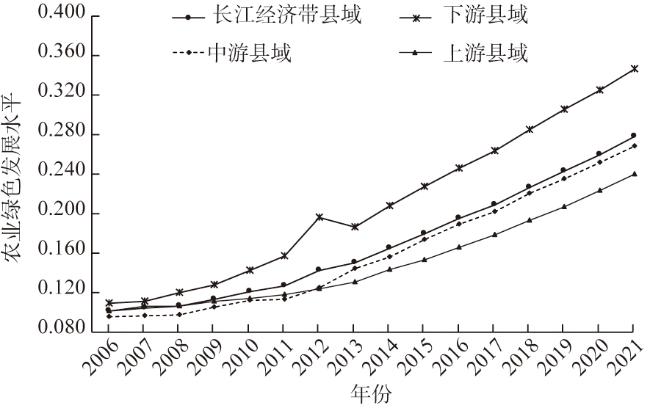
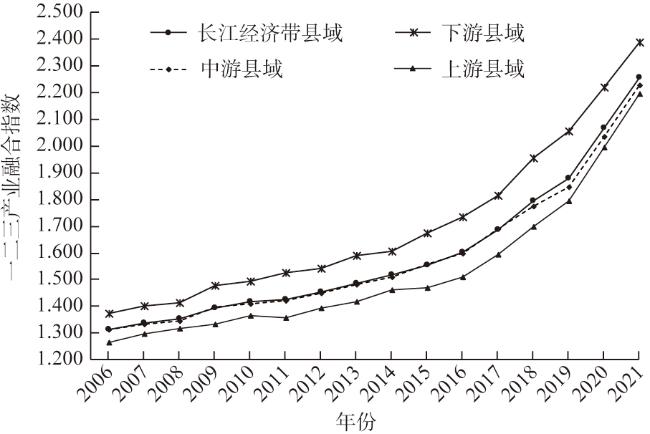
This research uses panel data of 579 counties in China's Yangtze River Economic Belt (YREB) from 2006 to 2021 to explore the impacts and nonlinear adjustment mechanisms of integration of rural primary, secondary and tertiary industries on agricultural green development using fixed-effects models and threshold models. The main conclusions show that: (1) During the study period, the level of agricultural green development and the integration of rural primary, secondary and tertiary industries index in the counties of the YREB showed a fluctuating upward trend, with a spatial divergence pattern of downstream>midstream>upstream. (2) The integration of rural primary, secondary and tertiary industries in the counties of the YREB can significantly promote the agricultural green development, but there is regional heterogeneity in the impact effect, manifested as downstream>midstream>upstream. (3) There is a double-threshold in the impact of the integration of rural primary, secondary and tertiary industries on agricultural green development. The whole region and midstream counties are characterized by a "leapfrog" growth. Downstream counties are characterized by a "U"-shaped pattern. Upstream counties show increasing marginal effects followed by decreasing marginal effects. The impact of the integration of rural primary, secondary and tertiary industries on agricultural green development is characterized by the existence of a double-threshold for industrial upgrading. The whole region and midstream and upstream counties are characterized by a "leapfrog" growth. Downstream counties are characterized by a "growth-buffer-growth" pattern. The impact of the integration of rural primary, secondary and tertiary industries on agricultural green development is characterized by the existence of a double-threshold for technological innovation. The whole regional midstream counties are characterized by a "leapfrog" growth. Downstream counties are characterized by a "growth-buffer-growth" pattern. There is no threshold effect in upstream counties. The results of the study can provide a reference for decision-making to promote agricultural green development in China, as well as lessons for agricultural green development in the remaining less developed countries.
TIAN Cai-hong , LI Lin , LIAO Bin . Can integration of rural primary, secondary and tertiary industries promote agricultural green development? A case study of 579 counties in China's Yangtze River Economic Belt[J]. JOURNAL OF NATURAL RESOURCES, 2024 , 39(3) : 601 -619 . DOI: 10.31497/zrzyxb.20240307
表1 县域农业绿色发展水平评价指标体系Table 1 Evaluation index system of agricultural green development at county level |
| 一级指标 | 衡量指标/单位 | |
|---|---|---|
| 县域农业绿色发展 | 农业社会经济 | 人均农林牧渔产值/元 |
| 农村居民可支配收入/元 | ||
| 农业资源节约 | 人均农作物总播种面积/hm2 | |
| 单位播种面积农机总动力/(kW/hm2) | ||
| 农业环境治理 | 单位面积化肥使用强度/(kg/hm2) | |
| 农业面源污染/(kg/hm2) | ||
| PM2.5/(μg/hm2) |
表2 县域农村一二三产业融合发展的衡量标准Table 2 Measurement of integration of rural primary, secondary and tertiary industries in county |
| 基准层 | 要素层/单位 | 属性 | |
|---|---|---|---|
| 县域农村一二三 产业融合发展 | 农业产业链延伸 | 县域人均农产品加工企业数量/个 | 正 |
| 县域人均电商企业数/个 | 正 | ||
| 农业多功能性拓展 | 县域人均粮食产量/kg | 正 | |
| 县域设施农业占地面积/hm2 | 正 | ||
| 农业服务业融合发展 | 县域人均农业服务企业数/个 | 正 | |
| 县域人均农林牧渔服务业产值/元 | 正 |
表3 描述性统计表Table 3 Descriptive statistics |
| 变量 | 观测值/个 | 均值 | 最大值 | 最小值 |
|---|---|---|---|---|
| 农业绿色发展水平 | 9264 | 0.17 | 0.63 | 0.05 |
| 农村一二三产业融合 | 9264 | 1.60 | 7.98 | 1.01 |
| 经济发展水平 | 9264 | 10.06 | 12.92 | 7.64 |
| 居民消费水平 | 9264 | 8.92 | 11.83 | 5.83 |
| 政府干预 | 9264 | 0.27 | 3.94 | 0 |
| 城镇化率 | 9264 | 31.61 | 88.95 | 3.03 |
| 劳动力数量 | 9264 | 11.77 | 14.31 | 6.70 |
| 产业升级 | 9264 | 2.18 | 2.73 | 1.68 |
| 技术创新 | 9264 | 1.41 | 7.39 | 0 |
表4 面板模型回归估计结果Table 4 Panel model regression estimates |
| 变量 | (1) | (2) | (3) | (4) |
|---|---|---|---|---|
| RID | 0.0779*** | 0.0169*** | 0.0533*** | 0.0207*** |
| (0.002) | (0.001) | (0.001) | (0.002) | |
| lnPgdp | 0.0586*** | 0.0209*** | 0.0248*** | |
| (0.001) | (0.002) | (0.002) | ||
| lnRcl | 0.0204*** | 0.0418*** | 0.0401*** | |
| (0.001) | (0.002) | (0.002) | ||
| Gov | 0.0612*** | -0.0104*** | -0.0166*** | |
| (0.002) | (0.003) | (0.003) | ||
| City | -0.0005*** | -0.0000 | 0.0000 | |
| (0.000) | (0.000) | (0.000) | ||
| lnLab | 0.0021*** | 0.0095*** | 0.0084*** | |
| (0.001) | (0.001) | (0.001) | ||
| Region1 RID | 0.0304*** | |||
| (0.003) | ||||
| Region2 RID | 0.0609*** | |||
| (0.003) | ||||
| Constant | 0.0458*** | -0.6548*** | -0.6076*** | -0.6103*** |
| (0.003) | (0.009) | (0.014) | (0.013) | |
| 固定效应 | NO | NO | YES | YES |
| R2 | 0.194 | 0.662 | 0.730 | 0.745 |
| Obs/个 | 9264 | 9264 | 9264 | 9264 |
注:括号内为标准误, ***代表系数在1%的水平上显著,下同。 |
表5 稳健性检验回归结果Table 5 Robustness test regression results |
| 变量 | (1) | (2) | (3) |
|---|---|---|---|
| RID | 0.0193*** | 0.0286*** | 0.0510*** |
| (0.002) | (0.010) | (0.004) | |
| lnPgdp | 0.0636*** | -0.0127 | 0.0188*** |
| (0.002) | (0.016) | (0.005) | |
| lnRcl | 0.0210*** | -0.0196 | 0.0396*** |
| (0.001) | (0.013) | (0.005) | |
| Gov | 0.0695*** | -0.0551*** | -0.0092 |
| (0.003) | (0.020) | (0.006) | |
| City | -0.0005*** | -0.0013*** | -0.0000 |
| (0.000) | (0.000) | (0.000) | |
| lnLab | 0.0037*** | -0.0036 | 0.0082*** |
| (0.001) | (0.007) | (0.002) | |
| Constant | -0.7368*** | 1.0168*** | -0.5497*** |
| (0.013) | (0.163) | (0.027) | |
| 固定效应 | YES | YES | YES |
| Obs/个 | 8685 | 9264 | 8710 |
| R2 | 0.672 | 0.633 | 0.755 |
表6 农村一二三产业融合的门槛效应检验结果Table 6 Threshold effect test results of integration of rural primary, secondary and tertiary industries |
| 区域 | 门槛类型 | 门槛值 | F值 | P值 |
|---|---|---|---|---|
| 长江经济带县域 | 单门槛 | 1.1556 | 147.08 | 0.0033 |
| 双门槛 | 1.5654 | 95.34 | 0.0100 | |
| 下游县域 | 单门槛 | 1.2151 | 367.65 | 0.0000 |
| 双门槛 | 1.3203 | 155.69 | 0.0000 | |
| 中游县域 | 单门槛 | 1.5205 | 195.99 | 0.0000 |
| 双门槛 | 1.6782 | 68.36 | 0.0667 | |
| 上游县域 | 单门槛 | 1.5505 | 114.81 | 0.0000 |
| 双门槛 | 2.5662 | 45.06 | 0.0900 |
表7 农村一二三产业融合的门槛效应回归结果Table 7 Threshold effect regression results of integration of rural primary, secondary and tertiary industries |
| 变量 | 全样本 | 下游县域 | 中游县域 | 上游县域 |
|---|---|---|---|---|
| RID_1 | 0.0144*** | -0.0420*** | 0.0111*** | 0.0504*** |
| (0.003) | (0.004) | (0.003) | (0.004) | |
| RID_2 | 0.0388*** | -0.0050 | 0.0197*** | 0.0583*** |
| (0.002) | (0.004) | (0.003) | (0.003) | |
| RID_3 | 0.0490*** | 0.0329*** | 0.0321*** | 0.0489*** |
| (0.002) | (0.003) | (0.002) | (0.002) | |
| 控制变量 | YES | YES | YES | YES |
| Constant | -0.5467*** | -0.8958*** | -0.6422*** | -0.2447*** |
| (0.014) | (0.034) | (0.019) | (0.018) | |
| R2 | 0.737 | 0.827 | 0.811 | 0.758 |
| Obs/个 | 9264 | 2384 | 3520 | 3360 |
表8 产业升级的门槛效应检验结果Table 8 Threshold effect test results of industrial upgrading |
| 区域 | 门槛类型 | 门槛值 | F值 | P值 |
|---|---|---|---|---|
| 长江经济带县域 | 单门槛 | 2.2724 | 605.92 | 0.0000 |
| 双门槛 | 2.3943 | 259.55 | 0.0000 | |
| 下游县域 | 单门槛 | 2.0533 | 466.48 | 0.0000 |
| 双门槛 | 2.3835 | 128.98 | 0.0000 | |
| 中游县域 | 单门槛 | 2.1660 | 306.88 | 0.0000 |
| 双门槛 | 2.2318 | 61.34 | 0.0033 | |
| 上游县域 | 单门槛 | 2.1393 | 80.38 | 0.0467 |
| 双门槛 | 2.2725 | 55.21 | 0.0433 |
表9 产业升级的门槛效应回归结果Table 9 Threshold effect regression results of industrial upgrading |
| 变量 | 全样本 | 下游县域 | 中游县域 | 下游县域 |
|---|---|---|---|---|
| Idu_1 | 0.0399*** | 0.0445*** | 0.0251*** | 0.0399*** |
| (0.001) | (0.004) | (0.002) | (0.002) | |
| Idu_2 | 0.0501*** | 0.0218*** | 0.0325*** | 0.0463*** |
| (0.001) | (0.003) | (0.002) | (0.002) | |
| Idu_3 | 0.0695*** | 0.0508*** | 0.0430*** | 0.0534*** |
| (0.002) | (0.003) | (0.002) | (0.002) | |
| 控制变量 | YES | YES | YES | YES |
| Constant | -0.5656*** | -0.9618*** | -0.6553*** | -0.2332*** |
| (0.013) | (0.034) | (0.018) | (0.018) | |
| R2 | 0.753 | 0.831 | 0.816 | 0.757 |
| Obs/个 | 9264 | 2384 | 3520 | 3360 |
表10 技术创新的门槛效应检验结果Table 10 Threshold effect test results of technological innovation |
| 区域 | 门槛类型 | 门槛值 | F值 | P值 |
|---|---|---|---|---|
| 长江经济带县域 | 单门槛 | 1.9459 | 773.35 | 0.0000 |
| 双门槛 | 3.9703 | 290.12 | 0.0000 | |
| 下游县域 | 单门槛 | 0.6931 | 175.77 | 0.0000 |
| 双门槛 | 5.0562 | 64.90 | 0.0067 | |
| 中游县域 | 单门槛 | 1.6094 | 157.16 | 0.0000 |
| 双门槛 | 2.7726 | 63.99 | 0.0100 | |
| 上游县域 | 单门槛 | 0.0000 | 7.67 | 0.7300 |
| 双门槛 | 1.0986 | 7.50 | 0.1733 |
表11 技术创新的门槛效应回归结果Table 11 Threshold effect regression results for technological innovation |
| 变量 | 全样本 | 下游县域 | 中游县域 |
|---|---|---|---|
| lnIL_1 | 0.0495*** | 0.0363*** | 0.0457*** |
| (0.001) | (0.003) | (0.002) | |
| lnIL_2 | 0.0589*** | 0.0232*** | 0.0526*** |
| (0.001) | (0.003) | (0.002) | |
| lnIL_3 | 0.0794*** | 0.0457*** | 0.0621*** |
| (0.002) | (0.004) | (0.002) | |
| 控制变量 | YES | YES | YES |
| Constant | -0.5386*** | -1.1199*** | -0.6657*** |
| (0.013) | (0.039) | (0.018) | |
| R2 | 0.758 | 0.807 | 0.809 |
| Obs/个 | 9264 | 2384 | 3520 |
| [1] |
薛飞, 陈煦. 绿色财政政策的碳减排效应: 来自“节能减排财政政策综合示范城市”的证据. 财经研究, 2022, 48(7): 79-93.
[
|
| [2] |
于法稳. 习近平绿色发展新思想与农业的绿色转型发展. 中国农村观察, 2016, (5): 2-9, 94.
[
|
| [3] |
孙炜琳, 王瑞波, 姜茜, 等. 农业绿色发展的内涵与评价研究. 中国农业资源与区划, 2019, 40(4): 14-21.
[
|
| [4] |
|
| [5] |
|
| [6] |
魏琦, 张斌, 金书秦. 中国农业绿色发展指数构建及区域比较研究. 农业经济问题, 2018, (11): 11-20.
[
|
| [7] |
|
| [8] |
巩前文, 李学敏. 农业绿色发展指数构建与测度: 2005—2018年. 改革, 2020, (1): 133-145.
[
|
| [9] |
|
| [10] |
姚鹏, 李慧昭. 农业水权交易能否推动农业绿色发展. 中国农村经济, 2023, (2): 17-40.
[
|
| [11] |
|
| [12] |
|
| [13] |
|
| [14] |
|
| [15] |
|
| [16] |
|
| [17] |
马国群, 谭砚文. 环境规制对农业绿色全要素生产率的影响研究: 基于面板门槛模型的分析. 农业技术经济, 2021, (5): 77-92.
[
|
| [18] |
|
| [19] |
|
| [20] |
陈学云, 程长明. 乡村振兴战略的三产融合路径: 逻辑必然与实证判定. 农业经济问题, 2018, (11): 91-100.
[
|
| [21] |
陈红霞, 雷佳. 农村一二三产业融合水平测度及时空耦合特征分析. 中国软科学, 2021, (s1): 357-364.
[
|
| [22] |
张林, 温涛. 数字普惠金融如何影响农村产业融合发展. 中国农村经济, 2022, (7): 59-80.
[
|
| [23] |
王丽纳, 李玉山. 农村一二三产业融合发展对农民收入的影响及其区域异质性分析. 改革, 2019, (12): 104-114.
[
|
| [24] |
郝爱民, 谭家银. 农村产业融合赋能农业韧性的机理及效应测度. 农业技术经济, 2023, (7): 88-107.
[
|
| [25] |
|
| [26] |
|
| [27] |
罗明忠, 魏滨辉. 农村产业融合的环境效应分析. 农村经济, 2022, (12): 57-66.
[
|
| [28] |
李周. 中国农业绿色发展: 创新与演化. 中国农村经济, 2023, (2): 2-16.
[
|
| [29] |
|
| [30] |
|
| [31] |
葛继红, 王猛, 汤颖梅. 农村三产融合、城乡居民消费与收入差距: 效率与公平能否兼得?. 中国农村经济, 2022, (3) : 50-66.
[
|
| [32] |
尹昌斌, 李福夺, 王术, 等. 中国农业绿色发展的概念、内涵与原则. 中国农业资源与区划, 2021, 42(1): 1-6.
[
|
| [33] |
曹群, 张恩英, 刘增凡. 农村一二三产业融合促进乡村振兴的支持政策研究. 商业研究, 2022, (4): 132-139.
[
|
| [34] |
姜松, 周洁, 邱爽. 适度规模经营是否能抑制农业面源污染: 基于动态门槛面板模型的实证. 农业技术经济, 2021, (7): 33-48.
[
|
| [35] |
|
| [36] |
宋博, 穆月英, 侯玲玲. 农户专业化对农业低碳化的影响研究: 来自北京市蔬菜种植户的证据. 自然资源学报, 2016, 31(3): 468-476.
[
|
| [37] |
诸培新, 苏敏, 颜杰. 转入农地经营规模及稳定性对农户化肥投入的影响: 以江苏四县(市)水稻生产为例. 南京农业大学学报: 社会科学版, 2017, 17(4): 85-94, 158.
[
|
| [38] |
王亚平, 任建兰, 程钰. 科技创新对绿色发展的影响机制与区域创新体系构建. 山东师范大学学报: 人文社会科学版, 2017, 62(4): 68-76.
[
|
| [39] |
杜建军, 章友德, 刘博敏, 等. 数字乡村对农业绿色全要素生产率的影响及其作用机制. 中国人口·资源与环境, 2023, 33(2): 165-175.
[
|
| [40] |
|
| [41] |
|
| [42] |
秦天, 彭珏, 邓宗兵, 等. 环境分权、环境规制对农业面源污染的影响. 中国人口·资源与环境, 2021, 31(2): 61-70.
[
|
| [43] |
胡森林, 鲍涵, 郝均, 等. 环境规制对长三角城市绿色发展的影响: 基于技术创新的作用路径分析. 自然资源学报, 2022, 37(6): 1572-1585.
[
|
| [44] |
张艳红, 陈政, 萧烽, 等. 高质量发展背景下湖南农村产业融合发展水平测度与空间分异研究. 经济地理, 2021, (7): 1-15.
[
|
| [45] |
朱媛媛, 罗源, 罗静, 等. 资源型地区乡村三产融合及其内生动力提升: 以湖北省大冶市为例. 自然资源学报, 2023, 38(8): 1989-2008.
[
|
| [46] |
宋全云, 吴雨, 尹志超. 金融知识视角下的家庭信贷行为研究. 金融研究, 2017, (6): 95-110.
[
|
| [47] |
|
/
| 〈 |
|
〉 |