
JOURNAL OF NATURAL RESOURCES >
Regional disparity in green transformation performance of resource-based cities and its policy enlightenment
Received date: 2023-03-13
Revised date: 2023-08-17
Online published: 2023-12-12
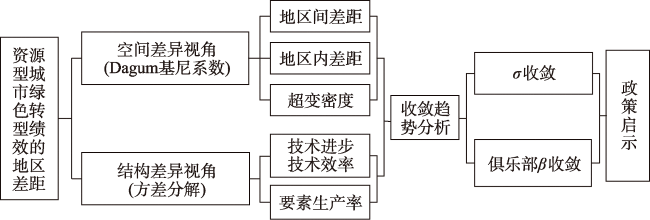
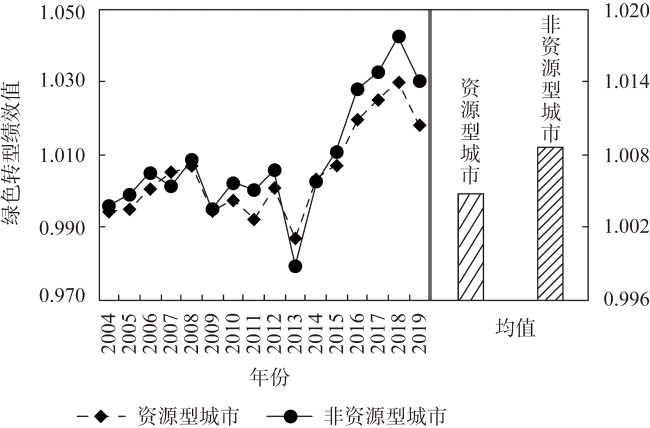
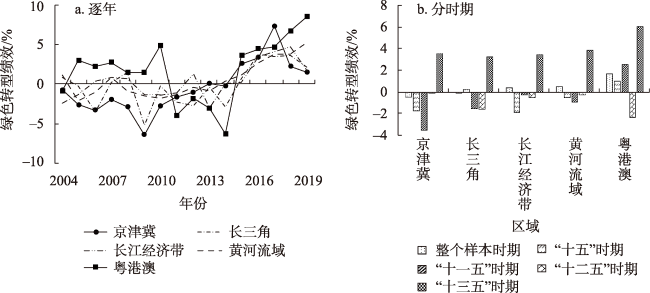
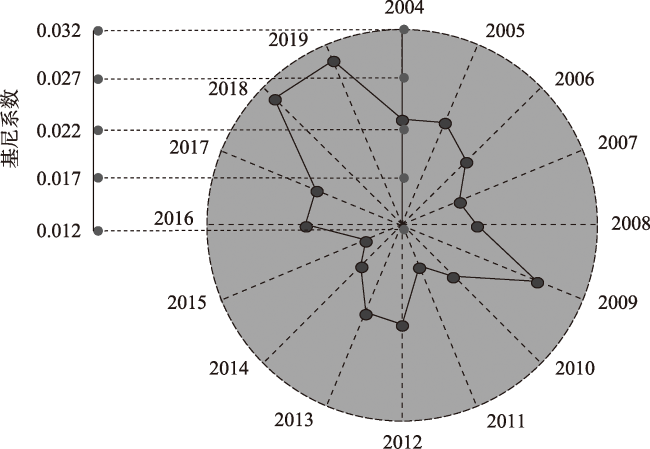
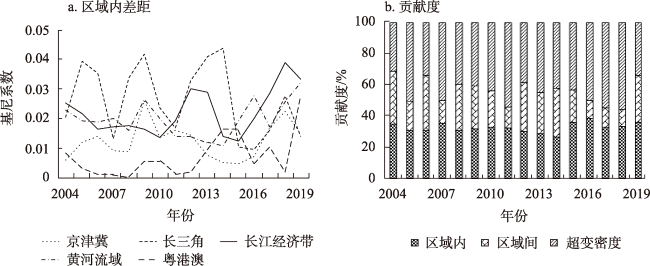
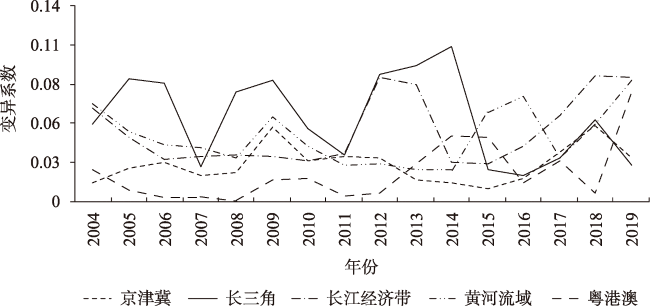
This paper adopts the method of data envelopment analysis to measure the green transformation performance of resource-based cities within major national strategic regions; utilizes Dagum Gini coefficient and variance decomposition to explore the sources of regional disparities in the green transformation performance of resource-based cities in terms of spatial and structural differences; and applies the σ and β convergences to test whether there are convergence characteristics in the green transformation performance of resource-based cities within major strategic regions. The research found that: (1) Throughout the sample period, the green transformation performance of resource-based cities in the Guangdong-Hong Kong-Macao Greater Bay Area (GBA) is higher than that of the Yellow River Basin (YRB), the Yangtze River Economic Belt (YREB), the Yangtze River Delta (YRD) and Beijing-Tianjin-Hebei region (BTH). (2) From the spatial dimension, super variable density is the main source of regional gaps in green transformation performance of resource-based cities in major strategic regions. (3) From the technical structure dimension, the gap in pure technical efficiency is the main reason for the formation of regional gaps in the green transformation performance of resource-based cities in the BTH, the YRD and the YRB, while the main reasons for the formation of regional gaps in the GBA and the YREB derive from the gaps in pure technological advancement and scale efficiency. (4) From the factor structure dimension, the gap in the energy utilization productivity is the main reason for the formation of regional gaps in green transformation performance of resource-based cities in the GBA, while other regions mainly come from the gap in pollution control productivity. (5) From the results of the convergence test, there are absolute club convergence and conditional club convergence in the green transformation performance of resource-based cities within major strategic regions.
WANG Jue , LI Lin . Regional disparity in green transformation performance of resource-based cities and its policy enlightenment[J]. JOURNAL OF NATURAL RESOURCES, 2023 , 38(12) : 3041 -3057 . DOI: 10.31497/zrzyxb.20231207
表1 变量描述性统计Table 1 Descriptive statistics of variables |
| 区域 | 年均增长率 | 所占份额 | |||||||||
|---|---|---|---|---|---|---|---|---|---|---|---|
| L | K | E | Y | FS | SO2 | PM2.5 | FS | SO2 | PM2.5 | ||
| 京津冀 | 0.426 | 20.264 | 4.898 | 8.271 | -6.224 | -8.902 | -1.903 | 0.107 | 0.113 | 0.073 | |
| 长三角 | 2.444 | 18.948 | 5.905 | 10.686 | -2.302 | -7.143 | -1.313 | 14.877 | 7.995 | 16.125 | |
| 长江经济带 | 1.959 | 19.749 | 5.156 | 11.039 | -4.219 | -5.048 | -1.624 | 24.218 | 21.626 | 25.621 | |
| 黄河流域 | 1.268 | 18.398 | 5.142 | 9.953 | -1.778 | -8.856 | -1.462 | 47.097 | 57.846 | 49.135 | |
| 粤港澳 | 1.326 | 15.384 | 4.282 | 10.025 | -2.656 | -9.730 | -1.627 | 3.073 | 1.279 | 1.857 | |
表2 2004—2019年重大战略区域资源型城市绿色转型绩效的地区间差距Table 2 Inter-regional disparities in the green transformation performance of resource-based cities in major strategic regions during 2004-2019 |
| 年份 | ①-② | ①-③ | ①-④ | ①-⑤ | ②-③ | ②-④ | ②-⑤ | ③-④ | ③-⑤ | ④-⑤ |
|---|---|---|---|---|---|---|---|---|---|---|
| 2004 | 0.015 | 0.017 | 0.017 | 0.008 | 0.024 | 0.023 | 0.017 | 0.026 | 0.018 | 0.017 |
| 2005 | 0.029 | 0.020 | 0.017 | 0.028 | 0.032 | 0.031 | 0.033 | 0.021 | 0.022 | 0.025 |
| 2006 | 0.028 | 0.022 | 0.020 | 0.028 | 0.029 | 0.028 | 0.031 | 0.019 | 0.014 | 0.018 |
| 2007 | 0.015 | 0.018 | 0.021 | 0.023 | 0.016 | 0.018 | 0.015 | 0.019 | 0.015 | 0.015 |
| 2008 | 0.029 | 0.020 | 0.017 | 0.022 | 0.027 | 0.027 | 0.022 | 0.018 | 0.013 | 0.014 |
| 2009 | 0.038 | 0.031 | 0.033 | 0.040 | 0.033 | 0.037 | 0.036 | 0.022 | 0.016 | 0.024 |
| 2010 | 0.021 | 0.016 | 0.018 | 0.038 | 0.020 | 0.023 | 0.033 | 0.017 | 0.031 | 0.034 |
| 2011 | 0.017 | 0.018 | 0.016 | 0.016 | 0.019 | 0.016 | 0.017 | 0.017 | 0.019 | 0.017 |
| 2012 | 0.025 | 0.024 | 0.015 | 0.013 | 0.034 | 0.025 | 0.025 | 0.023 | 0.021 | 0.013 |
| 2013 | 0.028 | 0.020 | 0.011 | 0.017 | 0.037 | 0.029 | 0.029 | 0.021 | 0.023 | 0.015 |
| 2014 | 0.028 | 0.012 | 0.010 | 0.031 | 0.031 | 0.030 | 0.044 | 0.013 | 0.035 | 0.035 |
| 2015 | 0.011 | 0.013 | 0.017 | 0.016 | 0.012 | 0.016 | 0.020 | 0.016 | 0.021 | 0.024 |
| 2016 | 0.009 | 0.015 | 0.019 | 0.009 | 0.016 | 0.020 | 0.009 | 0.025 | 0.015 | 0.020 |
| 2017 | 0.023 | 0.029 | 0.023 | 0.019 | 0.023 | 0.017 | 0.016 | 0.024 | 0.022 | 0.016 |
| 2018 | 0.027 | 0.034 | 0.027 | 0.021 | 0.035 | 0.027 | 0.025 | 0.034 | 0.027 | 0.024 |
| 2019 | 0.015 | 0.025 | 0.026 | 0.037 | 0.025 | 0.025 | 0.034 | 0.034 | 0.044 | 0.038 |
| 均值 | 0.022 | 0.021 | 0.019 | 0.023 | 0.026 | 0.024 | 0.025 | 0.022 | 0.022 | 0.022 |
注:① 京津冀;② 长三角;③ 长江经济带;④ 黄河流域;⑤ 粤港澳。 |
表3 重大战略区域资源型城市绿色转型绩效地区差距的来源:基于技术结构⑥Table 3 Sources of regional disparities in the green transformation performance of resource-based cities in major strategic regions: Based on technical structure |
| 时期 | 京津冀 | 长三角 | 长江经济带 | |||||||||||
|---|---|---|---|---|---|---|---|---|---|---|---|---|---|---|
| GPTP | GSEC | GPEC | GTPSE | GPTP | GSEC | GPEC | GTPSE | GPTP | GSEC | GPEC | GTPSE | |||
| I | 46.13 | 22.08 | 46.29 | -14.51 | 35.60 | 17.93 | 57.12 | -10.65 | 54.12 | 29.97 | 41.22 | -25.32 | ||
| II | 127.79 | 72.20 | 16.68 | -116.66 | 22.09 | 11.18 | 21.25 | 45.48 | 42.82 | 68.00 | 16.95 | -27.77 | ||
| III | 39.60 | -13.08 | 40.02 | 33.46 | 93.31 | 7.05 | 1.40 | -1.77 | 32.75 | 11.70 | 50.82 | 4.74 | ||
| IV | -5.99 | 44.38 | 111.08 | -49.47 | -7.00 | 8.73 | 109.03 | -10.77 | 86.63 | 31.53 | 37.48 | -55.64 | ||
| V | 78.61 | 13.10 | -12.05 | 20.33 | 23.46 | 46.40 | 79.80 | -49.66 | 45.87 | 31.85 | 46.04 | -23.76 | ||
| 时期 | 黄河流域 | 粤港澳 | ||||||||||||
| GPTP | GSEC | GPEC | GTPSE | GPTP | GSEC | GPEC | GTPSE | |||||||
| I | 36.04 | 24.93 | 36.26 | 2.77 | -50.91 | 303.30 | -78.59 | -73.80 | ||||||
| II | 17.20 | 2.88 | 11.85 | 68.07 | 118.90 | 574.86 | -51.81 | -541.95 | ||||||
| III | 48.51 | 15.19 | 8.72 | 27.58 | 11.47 | 537.30 | -219.25 | -229.51 | ||||||
| IV | 21.88 | 32.90 | 75.16 | -29.94 | 31.79 | 260.76 | -11.51 | -181.04 | ||||||
| V | 47.57 | 38.17 | 34.27 | -20.01 | -317.16 | -71.82 | 0 | 488.98 | ||||||
⑥ 注:I表示整个样本时期;II表示“十五”时期;III表示“十一五”时期;IV表示“十二五”时期;V表示“十三五”时期,下同。 |
表4 重大战略区域资源型城市绿色转型绩效地区差距的来源:基于要素结构Table 4 Sources of regional disparities in the green transformation performance of resource-based cities in major strategic regions: Based on factor structure |
| 时期 | 京津冀 | 长三角 | |||||||||||||
|---|---|---|---|---|---|---|---|---|---|---|---|---|---|---|---|
| L | K | E | Y | FS | SO2 | PM2.5 | L | K | E | Y | FS | SO2 | PM2.5 | ||
| I | 14.85 | -19.15 | 11.15 | 0 | 26.74 | 13.21 | 53.19 | 22.64 | -2.05 | 18.94 | 0 | 18.25 | 16.63 | 25.60 | |
| II | -3.81 | -12.32 | 27.50 | 0 | 84.14 | 39.12 | -34.64 | 32.97 | -1.85 | 23.38 | 0 | 13.66 | 7.51 | 24.34 | |
| III | 14.75 | -16.96 | 27.67 | 0 | 25.75 | 24.18 | 24.60 | 13.16 | -2.38 | 29.82 | 0 | 22.81 | 18.45 | 18.13 | |
| IV | 27.06 | -15.96 | 3.58 | 0 | 4.61 | -1.01 | 81.71 | 29.86 | 1.98 | 19.09 | 0 | 23.28 | 22.49 | 3.30 | |
| V | 9.02 | -29.27 | -8.20 | 0 | 26.93 | 4.32 | 97.21 | 20.27 | -6.77 | 2.94 | 0 | 8.54 | 11.58 | 63.43 | |
| 时期 | 长江经济带 | 黄河流域 | |||||||||||||
| L | K | E | Y | FS | SO2 | PM2.5 | L | K | E | Y | FS | SO2 | PM2.5 | ||
| I | 18.15 | -4.40 | 13.59 | 0 | 26.79 | 26.95 | 18.92 | 18.28 | -6.78 | 20.25 | 0 | 25.00 | 23.22 | 20.03 | |
| II | 23.41 | -4.76 | 16.48 | 0 | 22.99 | 26.52 | 15.35 | 26.44 | -2.33 | 32.92 | 0 | 8.45 | 18.00 | 16.52 | |
| III | 14.48 | -17.58 | 16.04 | 0 | 32.07 | 22.98 | 32.02 | 16.30 | -14.76 | 20.30 | 0 | 37.57 | 22.86 | 17.72 | |
| IV | 17.98 | -2.60 | 12.18 | 0 | 26.51 | 29.03 | 16.91 | 17.89 | -10.11 | 16.09 | 0 | 33.14 | 20.53 | 22.46 | |
| V | 20.31 | 10.00 | 10.85 | 0 | 22.43 | 29.53 | 6.87 | 17.14 | 5.13 | 19.05 | 0 | 7.39 | 29.64 | 21.64 | |
| 时期 | 粤港澳 | ||||||||||||||
| L | K | E | Y | FS | SO2 | PM2.5 | |||||||||
| I | -75.06 | -4.05 | 231.08 | 0 | 15.46 | -46.81 | -20.62 | ||||||||
| II | 67.81 | 6.00 | 25.10 | 0 | 24.85 | 48.97 | -72.73 | ||||||||
| III | -243.11 | 0 | 386.23 | 0 | 93.26 | -115.17 | -21.21 | ||||||||
| IV | -4.21 | 1.25 | 142.72 | 0 | 2.10 | -46.64 | 4.78 | ||||||||
| V | -24.98 | -20.77 | 250.58 | 0 | -69.79 | -9.47 | -25.57 | ||||||||
表5 绝对俱乐部收敛、条件俱乐部收敛检验结果Table 5 Test results of absolute club convergence and conditional club convergence |
| 时期 | 回归系数 | 京津冀 | 长三角 | 长江经济带 | 黄河流域 | 粤港澳 |
|---|---|---|---|---|---|---|
| 整 个 样 本 时 期 | 绝对收敛系数 | -0.488*** (0.103) | -1.203*** (0.075) | -1.105*** (0.054) | -1.027*** (0.044) | -0.485** (0.192) |
| Hausman检验 | re | fe | fe | fe | fe | |
| Adjust R2 | 0.235 | 0.589 | 0.526 | 0.470 | 0.170 | |
| 条件收敛系数 | -1.043*** (0.150) | -1.244*** (0.074) | -1.204*** (0.054) | -1.156*** (0.043) | -0.973*** (0.301) | |
| lnrgdp | 0.057 (0.081) | 0.016 (0.017) | -0.036 (0.037) | -0.001 (0.022) | 0.054 (0.173) | |
| urb | 0.017 (0.224) | 0.014 (0.015) | 0.059 (0.147) | -0.016 (0.069) | 0.038* (0.210) | |
| hum | 5.179 (4.001) | -0.243 (0.019) | 0.638 (1.275) | -0.315 (0.609) | 12.528 (22.143) | |
| emp | -0.174 (0.140) | 0.181 (0.191) | -0.089 (0.064) | -0.095** (0.048) | 0.912** (0.400) | |
| gov | -0.868** (0.329) | -0.495 (0.361) | 0.029 (0.072) | -0.051 (0.071) | 0.115 (0.616) | |
| fin | 0.054 (0.034) | 0.044** (0.018) | 0.042** (0.017) | 0.005 (0.005) | -0.094* (0.051) | |
| ind | 0.271 (0.237) | 0.007 (0.109) | -0.218*** (0.077) | -0.095** (0.045) | -0.087 (0.389) | |
| tec | -11.292 (9.975) | 3.714 (4.120) | 2.962 (3.554) | 0.065 (0.820) | 0.568 (1.341) | |
| ope | 1.044** (0.400) | 0.016 (0.021) | 0.001 (0.001) | 0.027 (0.020) | 0.234 (0.453) | |
| env | 0.011 (0.039) | -0.002 (0.031) | 0.028 (0.021) | -0.015 (0.012) | -0.117 (0.098) | |
| mar | 0.017 (0.011) | -0.000 (0.003) | 0.008 (0.007) | 0.009** (0.004) | -0.001 (0.017) | |
| Hausman检验 | fe | re | fe | fe | re | |
| Adjust R2 | 0.036 | 0.635 | 0.424 | 0.485 | 0.641 |
注:*、**、***分别代表在10%、5%、1%显著性水平上显著,括号内数值为标椎差。 |
| [1] |
吴康, 张文忠, 张平宇, 等. 中国资源型城市的高质量发展: 困境与突破. 自然资源学报, 2023, 38(1): 1-21.
[
|
| [2] |
张文忠, 余建辉. 中国资源型城市转型发展的政策演变与效果分析. 自然资源学报, 2023, 38(1): 22-38.
[
|
| [3] |
曾贤刚, 段存儒. 煤炭资源枯竭型城市绿色转型绩效评价与区域差异研究. 中国人口·资源与环境, 2018, 28(7): 127-135.
[
|
| [4] |
谭俊涛, 张新林, 刘雷, 等. 中国资源型城市转型绩效测度与评价. 经济地理, 2020, 40(7): 57-64.
[
|
| [5] |
张梦朔, 张平宇, 李鹤. 资源型城市经济转型绩效特征与评价方法: 基于东北地区的实证研究. 自然资源学报, 2021, 36(8): 2051-2064.
[
|
| [6] |
聂雷, 王圆圆, 张静, 等. 资源型城市绿色转型绩效评价: 来自中国114个地级市的检验. 技术经济, 2022, 41(4): 141-152.
[
|
| [7] |
徐维祥, 郑金辉, 周建平, 等. 资源型城市转型绩效特征及其碳减排效应. 自然资源学报, 2023, 38(1): 39-57.
[
|
| [8] |
孙晓华, 郑辉, 于润群, 等. 资源型城市转型升级: 压力测算与方向选择. 中国人口·资源与环境, 2020, 30(4): 54-62.
[
|
| [9] |
王晓楠, 孙威. 黄河流域资源型城市转型效率及其影响因素. 地理科学进展, 2020, 39(10): 1643-1655.
[
|
| [10] |
陈文君, 梅凤乔. 资源型城市工业绿色转型效率的时空演变及驱动因素研究. 生态经济, 2022, 38(11): 78-87.
[
|
| [11] |
李博, 秦欢, 孙威. 产业转型升级与绿色全要素生产率提升的互动关系: 基于中国116个地级资源型城市的实证研究. 自然资源学报, 2022, 37(1): 186-199.
[
|
| [12] |
崔丹, 卜晓燕, 徐祯, 等. 中国资源型城市高质量发展综合评估及影响机理. 地理学报, 2021, 76(10): 2489-2503.
[
|
| [13] |
窦睿音, 焦贝贝, 张文洁, 等. 西部资源型城市绿色发展效率时空分异与驱动力. 自然资源学报, 2023, 38(1): 238-254.
[
|
| [14] |
张国兴, 王涵, 闫磊超. 基于绿色发展效率的黄河流域资源型城市转型发展研究. 区域经济评论, 2021, (5): 138-144.
[
|
| [15] |
张国兴, 张婧钰. 黄河流域资源型城市高质量发展的时空演变. 中国人口·资源与环境, 2023, 33(2): 124-133.
[
|
| [16] |
胡春生, 莫秀蓉. 中国资源型城市经济收敛的结构分解. 资源科学, 2016, 38(12): 2338-2347.
[
|
| [17] |
张晓昱, 綦雪飞. 中部六省资源型城市经济增长收敛性分析. 统计理论与实践, 2020, (1): 57-63.
[
|
| [18] |
王昀, 孙晓华, 刘桐, 等. 资源型城市的要素错配问题更严重吗?. 统计研究, 2023, 40(2): 58-72.
[
|
| [19] |
肖小东, 刘耀彬, 李汝资. 中国资源型城市经济高质量发展水平识别与转换规律: 以30个煤炭城市为例. 自然资源学报, 2023, 38(3): 563-575.
[
|
| [20] |
李兰冰, 刘秉镰. 中国区域经济增长绩效、源泉与演化: 基于要素分解视角. 经济研究, 2015, 50(8): 58-72.
[
|
| [21] |
|
| [22] |
|
| [23] |
王兵, 吴延瑞, 颜鹏飞. 中国区域环境效率与环境全要素生产率增长. 经济研究, 2010, 45(5): 95-109.
[
|
| [24] |
|
| [25] |
|
| [26] |
|
| [27] |
|
| [28] |
|
| [29] |
|
| [30] |
杨骞, 王珏, 李超, 等. 中国农业绿色全要素生产率的空间分异及其驱动因素. 数量经济技术经济研究, 2019, 36(10): 21-37.
[
|
| [31] |
朱子云. 中国经济发展省际差距成因的双层挖掘分析. 数量经济技术经济研究, 2015, 32(1): 3-19.
[
|
| [32] |
李小克, 胡巧丽. 偏向性技术进步视角下全要素生产率增长的跨国收敛性及影响因素研究. 统计研究, 2023, 40(5): 37-50.
[
|
| [33] |
单豪杰. 中国资本存量K的再估算: 1952—2006年. 数量经济技术经济研究, 2008, 25(10): 17-31.
[
|
| [34] |
吴延瑞. 生产率对中国经济增长的贡献: 新的估计. 经济学(季刊), 2008, 7(3): 827-842.
[
|
| [35] |
史丹, 李少林. 排污权交易制度与能源利用效率: 对地级及以上城市的测度与实证. 中国工业经济, 2020, (9): 5-23.
[
|
| [36] |
赵明亮, 冯健康, 孙威. 环境规制影响资源型城市绿色全要素生产率的途径与政策建议. 自然资源学报, 2023, 38(1): 186-204.
[
|
| [37] |
樊纲, 王小鲁, 马光荣. 中国市场化进程对经济增长的贡献. 经济研究, 2011, 46(9): 4-16.
[
|
| [38] |
杨东亮, 郑鸽. 粤港澳大湾区人口集聚表现与对策研究. 经济体制改革, 2022, (4): 66-72.
[
|
/
| 〈 |
|
〉 |