
JOURNAL OF NATURAL RESOURCES >
Analysis on the pattern and determinants of rural ecological products commodification in the Yangtze River Delta
Received date: 2022-11-07
Revised date: 2023-09-17
Online published: 2023-12-12
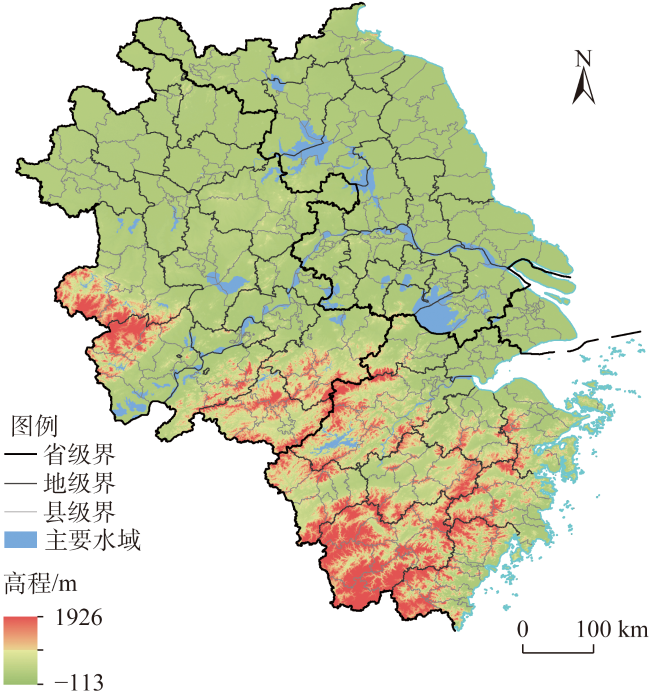
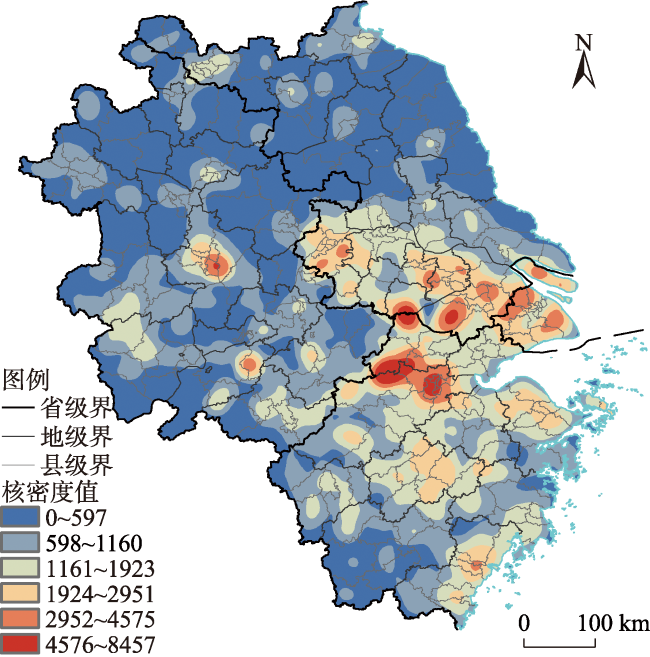
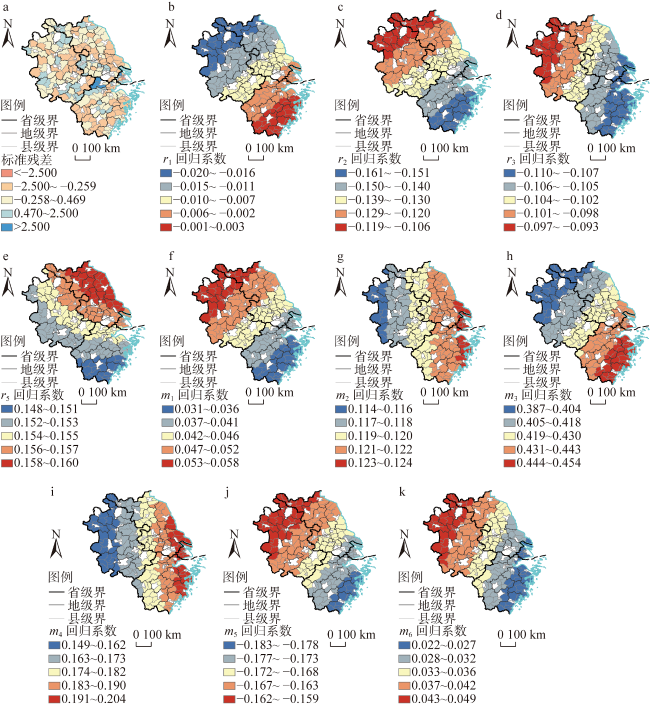
Research on the commodification of ecological products has important implications for guiding the ecological transformation of current economic and social development. In this paper, we take the Yangtze River Delta as a case study and employ data related to agro-product geographical indication, point of interest (POI) and enterprises in 2022. With the help of ArcGIS and SPSS Software, we explore the spatial pattern and determinants of rural ecological products commodification in the Yangtze River Delta (YRD). In the first place, we use the method of Kernel Density Analysis to explore the spatial pattern of rural ecological products commodification in the study area. In the second place, based on economic demand and supply, we take the natural resource endowment and market economic conditions as the factor layer to construct a determinants index system to explain the commodification pattern. In the third place, we compare the GWR model with the traditional OLS model to further investigate the determinants of the commodification pattern in the YRD. Based on the analysis, the primary conclusions can be summarized as follows. (1) The commodification pattern exhibited agglomeration characteristics in Southern Jiangsu and Northern Zhejiang. Up to now, three high-density areas have been formed: Huzhou-Hangzhou, the coast of Lake Taihu, and Hefei city. In addition, sub-high-density areas have been formed in the suburbs of many large cities. (2) The market economy is the main factor affecting the formation of commodification pattern, in which regional traffic conditions, per capita disposable income of urban residents, and industrial base of service industry have significant positive effects. (3) In the model selection, we compare the GWR model with the traditional OLS model. The result shows that GWR is better, indicating that the impact of the indicators varies across space. In coastal areas, the commodification pattern is greatly affected by the regional traffic conditions. In areas with a higher level of economic development, the positive impact of the per capita disposable income index of urban residents is more significant. In areas with a developed service industry, the positive effect of the service industry base is more significant, while the negative impact brought by long-term agricultural production is weaker.
LI Ying-ying , CHEN Cheng , CAO Hui , GAO Jin-long , CHEN Jiang-long . Analysis on the pattern and determinants of rural ecological products commodification in the Yangtze River Delta[J]. JOURNAL OF NATURAL RESOURCES, 2023 , 38(12) : 2986 -3002 . DOI: 10.31497/zrzyxb.20231204
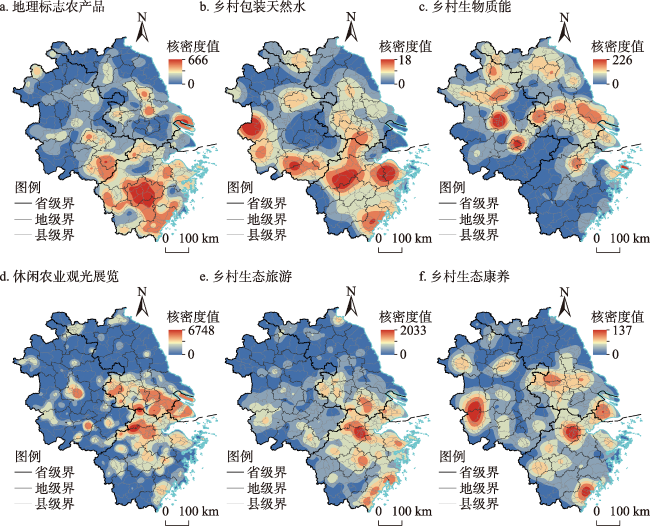
表1 乡村生态产品商品化主要类型及经营主体Table 1 Dominant types and operators of rural eco-products commodification |
| 主要类型 | 释义 | 经营主体 |
|---|---|---|
| 地理标志农产品 | 地理标志是对某一地域的特色产品划定范围进行保护[26],地理标志农产品以其特色性和稀缺性,实现对农林牧渔产品的生态溢价 | 地理标志农产品供给密集的主产地所在村 |
| 乡村包装天然水 | 矿泉水、天然水等利用优质水源生产的包装饮用水[25] | 乡村地区生产、加工包装天然水的企业 |
| 乡村生物质能 | 秸秆、薪材、农业加工副产品、人畜粪便、能源作物等[24] | 乡村地区生产生物柴油、燃料乙醇的企业;乡村养殖场粪便厌氧发酵制沼企业;乡村生物质发电企业 |
| 休闲农业观光展览 | 农业观光、农业展览等经营 | 采摘园、垂钓园、度假村、农家乐、生态园、渔村、山庄等 |
| 乡村生态旅游 | 旨在保护乡村自然景观的可持续发展的旅游服务 | 位于乡村地区的风景名胜、旅游景点(自然类)、世界遗产(自然类)、海滨浴场、露营地等 |
| 乡村生态康养 | 依托生态环境优良的乡村聚落区开展的健康养老服务 | 位于乡村地区的度假康养场所、农业康养场所、生态康养场所等(不含生态旅游企业) |
注:根据地理标志农产品数据可获得性,选择供给主体密集的主产地所在村表征地理标志农产品经营主体。 |
表2 乡村生态产品商品化格局影响因素的选择及计算方法Table 2 Selection and calculation method of influencing factors on rural eco-products commodification |
| 因素层 | 指标层 | 作用方向 | 指标刻画 |
|---|---|---|---|
| 自然资源禀赋(解释变量) | 地区地形多样性r1 | + | 地区地形多样性指数(SHDI) |
| 地区多年平均气温r2/℃ | +/- | 地区多年年平均气温总值/年数 | |
| 地区多年平均降水量r3/mm | +/- | 地区多年降水总量/年数 | |
| 地区生境质量r4 | + | 地区生物多样性(InVEST模型) | |
| 地区植被丰富度r5 | + | 地区归一化植被指数(NDVI) | |
| 地区森林覆盖率r6/% | + | 地区森林面积/地区国土面积 | |
| 市场经济条件(解释变量) | 地区城镇人口占比m1/% | + | 地区城镇人口/地区总人口 |
| 地区城镇居民人均可支配收入 m2/(元/人) | + | 地区城镇常住居民人均可支配收入 | |
| 地区内部路网密度m3/(km/km2) | + | 地区交通道路里程/地区国土面积 | |
| 地区到区域中心时间距离m4/(1/h) | + | 1/地区到区域中心驾车出行时间 | |
| 地区一产占比m5/% | +/- | 地区一产增加值/地区GDP | |
| 地区三产占比m6/% | + | 地区三产增加值/地区GDP | |
| 经济状况(控制变量) | 地区国内生产总值c1/万元 | + | —— |
| 政府调控(控制变量) | 地区财政收入c2/万元 | + | 地区一般公共预算收入 |
表3 长三角乡村生态产品经营主体数量结构特征Table 3 Quantity structure characteristics of rural eco-products operators in Yangtze River Delta |
| 主要类型 | 经营主体数量/个 | 经营主体占比/% |
|---|---|---|
| 地理标志农产品类 | 4634 | 13.41 |
| 包装天然水类 | 193 | 0.56 |
| 生物质能类 | 1300 | 3.76 |
| 休闲农业观光展览类 | 20609 | 59.63 |
| 乡村生态旅游类 | 6725 | 19.46 |
| 乡村生态康养类 | 1098 | 3.18 |
| 总数 | 34559 | 100.00 |
表4 OLS模型估计及诊断结果Table 4 Estimation and diagnosis results of OLS model |
| 解释变量 | 模型1 | 模型2 | |||||||||
|---|---|---|---|---|---|---|---|---|---|---|---|
| 标准化 系数 | 标准 误差 | t | 显著性 | VIF | 标准化 系数 | 标准 误差 | t | 显著性 | VIF | ||
| 常量 | 0.099 | 3.415 | 0.001*** | 0.067 | 0.892 | 0.374 | |||||
| r1 | 0.037 | 0.038 | 0.715 | 0.475 | 1.368 | -0.012 | 0.038 | -0.234 | 0.815 | 1.287 | |
| r2 | -0.145 | 0.075 | -2.436 | 0.016** | 1.761 | -0.107 | 0.069 | -1.939 | 0.054* | 1.433 | |
| r3 | -0.184 | 0.083 | -1.569 | 0.118 | 6.861 | -0.150 | 0.063 | -1.679 | 0.095* | 3.737 | |
| r4 | -0.617 | 0.148 | -3.415 | 0.001*** | 16.292 | ||||||
| r5 | 0.194 | 0.063 | 1.984 | 0.049** | 4.785 | 0.233 | 0.058 | 2.606 | 0.010*** | 3.764 | |
| r6 | 0.641 | 0.088 | 3.681 | 0.000*** | 15.113 | ||||||
| m1 | 0.026 | 0.056 | 0.446 | 0.656 | 1.718 | 0.046 | 0.058 | 0.756 | 0.450 | 1.702 | |
| m2 | 0.086 | 0.072 | 0.910 | 0.364 | 4.458 | 0.154 | 0.072 | 1.638 | 0.103 | 4.142 | |
| m3 | 0.334 | 0.078 | 4.291 | 0.000*** | 3.023 | 0.423 | 0.074 | 5.767 | 0.000*** | 2.527 | |
| m4 | 0.072 | 0.081 | 1.383 | 0.168 | 1.368 | 0.119 | 0.081 | 2.280 | 0.024** | 1.281 | |
| m5 | -0.213 | 0.067 | -2.749 | 0.007*** | 2.992 | -0.201 | 0.069 | -2.522 | 0.012** | 2.985 | |
| m6 | 0.037 | 0.056 | 0.751 | 0.453 | 1.196 | 0.030 | 0.057 | 0.597 | 0.551 | 1.156 | |
| c1 | -0.321 | 0.134 | -2.670 | 0.008*** | 7.196 | -0.328 | 0.138 | -2.657 | 0.008*** | 7.169 | |
| c2 | 0.452 | 0.130 | 3.863 | 0.000*** | 6.845 | 0.440 | 0.134 | 3.662 | 0.000*** | 6.782 | |
| K(BP) 统计量 | - | 32.021 | |||||||||
| AICc | - | -301 | |||||||||
| R2 | 0.583 | 0.553 | |||||||||
| Adj-R2 | 0.555 | 0.527 | |||||||||
注:*、**、***分别表示10%、5%、1%的显著性水平,下同。 |
表5 各变量之间的Pearson相关系数Table 5 Correlation coefficients of variables |
| r1 | r2 | r3 | r4 | r5 | r6 | m1 | m2 | m3 | m4 | m5 | m6 | c1 | c2 | |
|---|---|---|---|---|---|---|---|---|---|---|---|---|---|---|
| r1 | 1 | |||||||||||||
| r2 | -0.219** | 1 | ||||||||||||
| r3 | 0.317** | -0.130 | 1 | |||||||||||
| r4 | 0.374** | -0.396** | 0.844** | 1 | ||||||||||
| r5 | 0.370** | -0.124 | 0.823** | 0.830** | 1 | |||||||||
| r6 | 0.298** | -0.247** | 0.899** | 0.927** | 0.850** | 1 | ||||||||
| m1 | 0.041 | 0.168* | 0.169* | -0.014 | 0.129 | 0.117 | 1 | |||||||
| m2 | 0.076 | 0.347** | 0.185** | -0.094 | 0.038 | 0.098 | 0.525** | 1 | ||||||
| m3 | -0.127 | 0.450** | -0.136* | -0.468** | -0.285** | -0.265** | 0.431** | 0.636** | 1 | |||||
| m4 | 0.037 | -0.242** | 0.157* | 0.239** | 0.148* | 0.261** | -0.243** | -0.155* | -0.217** | 1 | ||||
| m5 | -0.091 | -0.258** | -0.183** | 0.059 | -0.085 | -0.081 | -0.583** | -0.754** | -0.549** | 0.332** | 1 | |||
| m6 | 0.102 | 0.053 | 0.248** | 0.203** | 0.191** | 0.242** | 0.160* | 0.181** | 0.147* | -0.010 | -0.117 | 1 | ||
| c1 | 0.065 | 0.257** | -0.194** | -0.403** | -0.270** | -0.297** | 0.267** | 0.662** | 0.595** | -0.196** | -0.507** | 0.065 | 1 | |
| c2 | 0.083 | 0.269** | -0.054 | -0.294** | -0.153* | -0.174** | 0.312** | 0.698** | 0.597** | -0.172** | -0.523** | 0.171* | 0.907** | 1 |
表6 GWR模型运算结果Table 6 Regression results of GWR model |
| 解释变量 | 最小值 | 25%分位数 | 中位数 | 75%分位数 | 最大值 | 平均值 |
|---|---|---|---|---|---|---|
| r1 | -0.020 | -0.014 | -0.010 | -0.004 | 0.003 | -0.009 |
| r2 | -0.161 | -0.146 | -0.134 | -0.124 | -0.106 | -0.135 |
| r3 | -0.110 | -0.107 | -0.104 | -0.101 | -0.093 | -0.104 |
| r5 | 0.148 | 0.152 | 0.154 | 0.156 | 0.160 | 0.154 |
| m1 | 0.031 | 0.038 | 0.044 | 0.049 | 0.058 | 0.044 |
| m2 | 0.114 | 0.118 | 0.120 | 0.121 | 0.124 | 0.119 |
| m3 | 0.387 | 0.410 | 0.425 | 0.439 | 0.454 | 0.424 |
| m4 | 0.149 | 0.168 | 0.179 | 0.188 | 0.204 | 0.178 |
| m5 | -0.183 | -0.175 | -0.169 | -0.164 | -0.159 | -0.170 |
| m6 | 0.022 | 0.028 | 0.034 | 0.040 | 0.049 | 0.034 |
| c1 | -0.386 | -0.373 | -0.362 | -0.352 | -0.333 | -0.362 |
| c2 | 0.487 | 0.491 | 0.492 | 0.493 | 0.494 | 0.492 |
| 带宽 | 9.724 | — | — | — | — | — |
| 残差平方和 | 2.886 | — | — | — | — | — |
| Sigma | 0.118 | — | — | — | — | — |
| AICc | -304 | — | — | — | — | — |
| R2 | 0.563 | — | — | — | — | — |
| Adj-R2 | 0.533 | — | — | — | — | — |
表7 OLS模型运算结果Table 7 Regression results of OLS model |
| 被解释变量 | 解释变量 | 标准化系数 | 标准误差 | t | 显著性 | VIF |
|---|---|---|---|---|---|---|
| 常量 | 0.041 | -3.712 | 0.000 | |||
| r4 | 0.531 | 0.059 | 9.256 | 0.000*** | 1.009 | |
| m2 | 0.118 | 0.055 | 2.053 | 0.041** | 1.009 | |
| 常量 | 0.025 | -2.682 | 0.008 | |||
| r4 | 0.209 | 0.037 | 3.042 | 0.003*** | 1.174 | |
| r1 | 0.174 | 0.033 | 2.523 | 0.012** | 1.180 | |
| m5 | 0.149 | 0.037 | 2.338 | 0.020** | 1.019 | |
| 常量 | 0.015 | 11.715 | 0.000 | |||
| r3 | -0.336 | 0.032 | 5.295 | 0.000*** | 1.000 | |
| 常量 | 0.031 | -2.960 | 0.003 | |||
| c2 | 0.633 | 0.057 | 10.224 | 0.000*** | 1.279 | |
| r4 | 0.547 | 0.078 | 4.743 | 0.000*** | 4.437 | |
| r3 | -0.251 | 0.065 | -2.278 | 0.024** | 4.064 | |
| 常量 | 0.026 | -0.676 | 0.500 | |||
| r6 | 0.394 | 0.032 | 6.970 | 0.000*** | 1.418 | |
| c2 | 0.286 | 0.090 | 3.945 | 0.000*** | 2.333 | |
| r1 | 0.232 | 0.041 | 4.538 | 0.000*** | 1.153 | |
| m2 | 0.296 | 0.067 | 3.717 | 0.000*** | 2.803 | |
| m3 | -0.157 | 0.078 | -2.259 | 0.025** | 2.151 | |
| 常量 | 0.035 | 2.802 | 0.006 | |||
| r5 | 0.277 | 0.033 | 4.180 | 0.000*** | 1.082 | |
| c1 | 0.211 | 0.059 | 3.102 | 0.002*** | 1.141 | |
| r2 | -0.159 | 0.065 | -2.398 | 0.017** | 1.075 |
注: 、 、 、 、 、 分别表示地理标志农产品、乡村包装天然水、乡村生物质能、休闲农业观光展览、乡村生态旅游、乡村生态康养的经营主体数量。 |
| [1] |
王金南, 王志凯, 刘桂环, 等. 生态产品第四产业理论与发展框架研究. 中国环境管理, 2021, 13(4): 5-13.
[
|
| [2] |
曾贤刚, 虞慧怡, 谢芳. 生态产品的概念、分类及其市场化供给机制. 中国人口·资源与环境, 2014, 24(7): 12-17.
[
|
| [3] |
叶兴庆. 迈向2035年的中国乡村: 愿景、挑战与策略. 管理世界, 2021, 37(4): 98-112.
[
|
| [4] |
张元洁, 田云刚. 马克思的产业理论对乡村产业振兴的指导意义. 中国农村经济, 2020, (10): 2-16.
[
|
| [5] |
王宾. 共同富裕视角下乡村生态产品价值实现: 基本逻辑与路径选择. 中国农村经济, 2022, (6): 129-143.
[
|
| [6] |
|
| [7] |
|
| [8] |
杜焱强, 王继应, 孙雪峰. “生态颜值”何以持续转化为“农民财富”?. 中国人口·资源与环境, 2022, 32(10): 150-159.
[
|
| [9] |
|
| [10] |
|
| [11] |
张林波, 虞慧怡, 郝超志, 等. 生态产品概念再定义及其内涵辨析. 环境科学研究, 2021, 34(3): 655-660.
[
|
| [12] |
|
| [13] |
|
| [14] |
|
| [15] |
袁伟彦, 周小柯. 生态补偿问题国外研究进展综述. 中国人口·资源与环境, 2014, 24(11): 76-82.
[
|
| [16] |
戴其文, 赵雪雁. 生态补偿机制中若干关键科学问题: 以甘南藏族自治州草地生态系统为例. 地理学报, 2010, 65(4): 494-506.
[
|
| [17] |
靳乐山, 吴乐. 我国生态补偿的成就、挑战与转型. 环境保护, 2018, 46(24): 7-13.
[
|
| [18] |
温铁军, 罗士轩, 董筱丹, 等. 乡村振兴背景下生态资源价值实现形式的创新. 中国软科学, 2018, (12): 1-7.
[
|
| [19] |
张轩畅, 刘彦随, 李裕瑞, 等. 黄土丘陵沟壑区乡村生态产业化机理及其典型模式. 资源科学, 2020, 42(7): 1275-1284.
[
|
| [20] |
|
| [21] |
|
| [22] |
王鹏飞. 论北京农村空间的商品化与城乡关系. 地理学报, 2013, 68(12): 1657-1667.
[
|
| [23] |
苏康传, 杨庆媛, 吴江, 等. 重庆市乡村空间商品化格局特征、驱动机制及发展模式. 经济地理, 2022, 42(7): 167-177.
[
|
| [24] |
刘刚, 沈镭. 中国生物质能源的定量评价及其地理分布. 自然资源学报, 2007, 22(1): 9-19.
[
|
| [25] |
刘永林, 雒昆利, 倪润祥, 等. 新疆于田县优质富锂富锶天然饮用矿泉水及其开发前景. 自然资源学报, 2013, 28(12): 2150-2158.
[
|
| [26] |
李裕瑞, 卜长利, 王鹏艳. 中国农产品地理标志的地域分异特征. 自然资源学报, 2021, 36(4): 827-840.
[
|
| [27] |
钟林生, 马向远, 曾瑜皙. 中国生态旅游研究进展与展望. 地理科学进展, 2016, 35(6): 679-690.
[
|
| [28] |
李伯华, 李珍, 刘沛林, 等. 湘江流域传统村落景观基因变异及其分异规律. 自然资源学报, 2022, 37(2): 362-377.
[
|
| [29] |
杨馥端, 窦银娣, 易韵, 等. 催化视角下旅游驱动型传统村落共同富裕的机制与路径研究: 以湖南省板梁村为例. 自然资源学报, 2023, 38(2): 357-374.
[
|
| [30] |
许泽宁, 高晓路. 基于电子地图兴趣点的城市建成区边界识别方法. 地理学报, 2016, 71(6): 928-939.
[
|
| [31] |
王周伟, 崔百胜, 张元庆. 空间计量经济学:现代模型与方法. 北京: 北京大学出版社, 2017: 179-191.
[
|
/
| 〈 |
|
〉 |