
JOURNAL OF NATURAL RESOURCES >
Spatio-temporal evolution and driving mechanism of supply and demand of urban park green space in China
Received date: 2022-06-06
Revised date: 2022-12-19
Online published: 2023-05-15
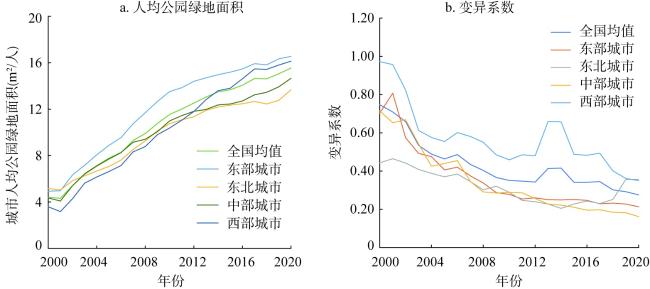
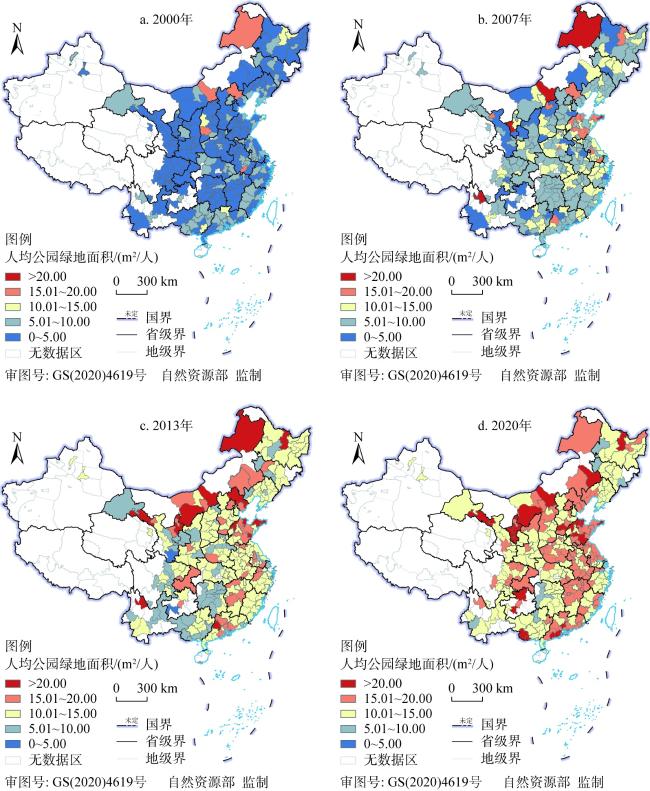
Based on the panel data of park green space and social economy of 284 prefecture- level Chinese cities since 2000, we examined the spatio-temporal patterns and driving mechanism of supply and demand of park green space, using the coefficient of variation, exploratory spatial data analysis methods and econometric models. The results show that: (1) The total area of China's urban park green space increased significantly since the beginning of the 21st century. The average level of park green space per capita has been significantly improved, with obvious differentiation in cities with different regions. (2) The difference degree of supply and demand of park green space converged significantly. After 2010, the supply of park green space in Western China has increased significantly. The lower per capita area of some small and medium-sized cities in Northeast, Central and Western China was the main inducement to block the equalization of park green space. (3) The spatio-temporal evolution of supply and demand of urban park green space was comprehensively driven by multi-dimensional factors such as urban background, social economy and public policy. Both the level of urban population agglomeration and land development had negative impact. The improvement of economic development, industrial structure upgrading and optimal allocation of residential land played an important promotive role. The public financial support, improvement of transportation infrastructure and level of environmental protection had significant positive impact. The driving mechanism of each factor however was obvious heterogeneous. We should increase the total supply of park green space according to the local conditions of different cities, innovate the supply mode and supply form, and improve the operation and maintenance system of park green space. The research results can provide references for improving the supply and demand of urban park green space, and solving the unbalanced and insufficient supply of park green space.
SONG Yang , HE Can-fei , XU Yang , QU Jun-xi . Spatio-temporal evolution and driving mechanism of supply and demand of urban park green space in China[J]. JOURNAL OF NATURAL RESOURCES, 2023 , 38(5) : 1194 -1209 . DOI: 10.31497/zrzyxb.20230506
表1 变量描述性统计Table 1 Descriptive statistics of variables |
| 解释变量 | 变量名称 | 变量符号 | 定义 | 单位 |
|---|---|---|---|---|
| 被解释变量 | 城市公园绿地供需 | lnPGpc | 人均公园绿地面积 | m2/人 |
| 解释变量 | 城市土地开发程度 | lnPCL | 建设用地占城区面积比例 | % |
| 城市人口集聚 | lnPop | 建成区常住人口密度 | 万人/km2 | |
| 经济发展水平 | lnGDPpc | 城市人均GDP | 元/人 | |
| 产业结构升级 | lnIndus | 产业结构层次指数 | % | |
| 居住用地优化配置 | lnRESpc | 人均居住用地面积 | m2/人 | |
| 交通基础设施优化 | lnRoad | 城市道路密度 | km/km2 | |
| 政府公共财政支持 | lnExpend | 人均地方公共财政支出 | 万元/人 | |
| 生态环境保护力度 | lnEnvir | 建成区绿化覆盖率 | % |
表2 2000—2020年中国城市人均公园绿地面积全局Moran's I指数Table 2 Global Moran's I index of park green space per capita in Chinese cities during 2000-2020 |
| 年份 | Moran's I | 期望值 | Z(I) | P(I) |
|---|---|---|---|---|
| 2000 | 0.086 | -0.004 | 3.8753 | 0.004 |
| 2005 | 0.067 | -0.004 | 3.054 | 0.007 |
| 2010 | 0.114 | -0.004 | 5.083 | 0.001 |
| 2015 | 0.224 | -0.004 | 10.003 | 0.001 |
| 2020 | 0.119 | -0.004 | 5.116 | 0.002 |
表3 基准回归结果Table 3 Results of estimated model |
| 变量 | (1) 全样本 | (2) 2000—2012年 | (3) 2013—2020年 |
|---|---|---|---|
| lnPCL | -0.0147 | -0.0613*** | 0.0094 |
| (0.0124) | (0.0214) | (0.0118) | |
| lnPop | -0.448*** | -0.445*** | -0.352*** |
| (0.0189) | (0.0250) | (0.0237) | |
| lnGDPpc | 0.131*** | 0.100*** | 0.0513*** |
| (0.0174) | (0.0287) | (0.0163) | |
| lnIndus | 0.207 | 0.354 | 0.156 |
| (0.1396) | (0.2165) | (0.1472) | |
| lnRESpc | 0.144*** | 0.188*** | 0.0918*** |
| (0.0150) | (0.0204) | (0.0177) | |
| lnRoad | 0.198*** | 0.218*** | 0.112*** |
| (0.0152) | (0.0210) | (0.0170) | |
| lnExpend | 0.0319*** | 0.0154 | 0.0318*** |
| (0.0115) | (0.0169) | (0.0108) | |
| lnEnvir | 0.541*** | 0.459*** | 0.621*** |
| (0.0170) | (0.0223) | (0.0297) | |
| _cons | -3.297*** | -3.557*** | -1.977** |
| (0.7732) | (1.1845) | (0.8364) | |
| 时间/城市 | 控制 | 控制 | 控制 |
| R2 | 0.815 | 0.807 | 0.833 |
| N/个 | 5964 | 3692 | 2272 |
注:***、**、*分别为1%、5%、10%显著水平,括号中的数字表示标准误差,下同。 |
表4 基于不同区域的分组模型估计结果Table 4 Results of estimated model by region |
| 变量 | (1) 全样本 | (2) 东部地区 | (3) 东北地区 | (4) 中部地区 | (5) 西部地区 |
|---|---|---|---|---|---|
| lnPCL | -0.0147 | -0.0736*** | 0.0138 | 0.0319 | -0.00153 |
| (0.0124) | (0.0170) | (0.0289) | (0.0213) | (0.0353) | |
| lnPop | -0.448*** | -0.466*** | -0.0727 | -0.553*** | -0.340*** |
| (0.0189) | (0.0290) | (0.0500) | (0.0409) | (0.0387) | |
| lnGDPpc | 0.131*** | 0.0999*** | 0.0389 | 0.0717** | 0.217*** |
| (0.0174) | (0.0317) | (0.0322) | (0.0326) | (0.0409) | |
| lnIndus | 0.207 | 0.771*** | -0.130 | -0.727*** | 0.314 |
| (0.1396) | (0.2886) | (0.2153) | (0.2459) | (0.2977) | |
| lnRESpc | 0.144*** | 0.0769*** | 0.0630 | 0.0782*** | 0.275*** |
| (0.0150) | (0.0207) | (0.0387) | (0.0301) | (0.0331) | |
| lnRoad | 0.198*** | 0.166*** | -0.135*** | 0.216*** | 0.243*** |
| (0.0152) | (0.0236) | (0.0362) | (0.0275) | (0.0325) | |
| lnExpend | 0.0319*** | 0.0787*** | 0.0100 | -0.00544 | 0.0733*** |
| (0.0115) | (0.0227) | (0.0184) | (0.0213) | (0.0246) | |
| lnEnvir | 0.541*** | 0.635*** | 0.244*** | 0.695*** | 0.463*** |
| (0.0170) | (0.0503) | (0.0434) | (0.0341) | (0.0281) | |
| _cons | -3.297*** | -6.362*** | 1.528 | 2.267* | -5.345*** |
| (0.7732) | (1.5453) | (1.2472) | (1.3759) | (1.6549) | |
| 时间/城市 | 控制 | 控制 | 控制 | 控制 | 控制 |
| R2 | 0.815 | 0.817 | 0.839 | 0.813 | 0.824 |
| N/个 | 5964 | 1764 | 714 | 1722 | 1764 |
表5 稳健性检验Table 5 Results of robustness test |
| 变量 | (1) 基准回归 | (2) | (3) | (4) |
|---|---|---|---|---|
| lnPCL | -0.0147 | -0.0115 | -0.0192 | -0.0171 |
| (0.0124) | (0.0126) | (0.0214) | (0.0133) | |
| lnPop | -0.448*** | -0.444*** | -0.580*** | -0.286*** |
| (0.0189) | (0.0191) | (0.0324) | (0.0196) | |
| lnGDPpc | 0.131*** | 0.129*** | 0.107*** | 0.148*** |
| (0.0174) | (0.0175) | (0.0299) | (0.0183) | |
| lnIndus | 0.207 | 0.217 | 1.460*** | 0.152 |
| (0.1396) | (0.1406) | (0.2397) | (0.1468) | |
| lnRESpc | 0.144*** | 0.144*** | 0.127*** | 0.103*** |
| (0.0150) | (0.0151) | (0.0257) | (0.0156) | |
| lnRoad | 0.198*** | 0.197*** | 0.217*** | 0.107*** |
| (0.0152) | (0.0155) | (0.0261) | (0.0159) | |
| lnExpend | 0.0319*** | 0.0339*** | 0.121*** | 0.0145 |
| (0.0115) | (0.0116) | (0.0197) | (0.0122) | |
| lnEnvir | 0.541*** | 0.538*** | 0.740*** | 0.486*** |
| (0.0170) | (0.0171) | (0.0292) | (0.0176) | |
| _cons | -3.297*** | -3.343*** | -11.95*** | -2.454*** |
| (0.7732) | (0.7781) | (1.3277) | (0.8159) | |
| 时间/城市 | 控制 | 控制 | 控制 | 控制 |
| R2 | 0.815 | 0.814 | 0.750 | 0.779 |
| N/个 | 5964 | 5880 | 5964 | 5680 |
:真诚感谢北京大学—林肯研究院城市发展与土地政策研究中心刘志主任对本文结果分析及结论凝练等方面提供的宝贵意见。
| [1] |
李鑫, 马晓冬, 薛小同, 等. 城市绿地空间供需评价与布局优化: 以徐州中心城区为例. 地理科学, 2019, 39(11): 1771-1779.
[
|
| [2] |
王子琳, 李志刚, 程晗蓓. 中国大城市公园绿地可达性的公平性研究: 以武汉市中心城区为例. 地理科学进展, 2022, 41(4): 621- 635.
[
|
| [3] |
|
| [4] |
|
| [5] |
罗文斌, 楚雪莲, 唐沛, 等. 城市公园用地增长的时空分异及其驱动因素: 基于湖南省城市面板数据的实证分析. 经济地理, 2021, 41(12): 74-83.
[
|
| [6] |
|
| [7] |
|
| [8] |
|
| [9] |
任家怿, 王云. 基于改进两步移动搜索法的上海市黄浦区公园绿地空间可达性分析. 地理科学进展, 2021, 40(5): 774-783.
[
|
| [10] |
徐影秋, 刘志强, 洪亘伟, 等. 中国城市公园综合发展水平评价及障碍度分析. 生态经济, 2021, 37(6): 87-93.
[
|
| [11] |
刘志强, 宋佳, 余慧, 等. 基于动态计量模型的我国公园绿地面积与城市人口互动关系. 中国城市林业, 2021, 19(5): 22-27.
[
|
| [12] |
|
| [13] |
刘志强, 徐影秋, 洪亘伟, 等. 中国城区公园绿地面积与人口数量、建设用地面积演变的脱钩关系研究. 中国园林, 2021, 37(2): 54-59.
[
|
| [14] |
|
| [15] |
尹上岗, 杨山. 长三角地区城市人口—绿地面积异速增长特征及驱动机制. 地理研究, 2021, 40(10): 2780-2795.
[
|
| [16] |
|
| [17] |
周聪惠, 张彧. 高密度城区小微型公园绿地布局调控方法. 中国园林, 2021, 37(10): 60-65.
[
|
| [18] |
|
| [19] |
|
| [20] |
|
| [21] |
仝德, 孙裔煜, 谢苗苗. 基于改进高斯两步移动搜索法的深圳市公园绿地可达性评价. 地理科学进展, 2021, 40(7): 1113-1126.
[
|
| [22] |
|
| [23] |
|
| [24] |
|
| [25] |
黄玖菊, 林伊婷, 陶卓霖, 等. 社会公平视角下深圳公园绿地可达性研究. 地理科学, 2022, 42(5): 896-906.
[
|
| [26] |
宋洋, 朱道林,
[
|
| [27] |
李锋, 王如松. 城市绿地系统的生态服务功能评价、规划与预测研究: 以扬州市为例. 生态学报, 2003, 23(9): 1929-1936.
[
|
| [28] |
徐欣, 胡静, 贾垚焱, 等. 武汉市多维度城市公园绿地空间公平性分析. 地理科学, 2021, 41(12): 2138-2148.
[
|
| [29] |
刘雨婧, 唐健雄. 中国旅游业绿色发展效率时空演变特征及影响机理. 自然资源学报, 2022, 37(3): 681-700.
[
|
| [30] |
赵宁宁, 郭炎, 李志刚, 等. 中部地区乡村生产要素协同转型的时空格局及影响因素: 以湖南岳阳为例. 自然资源学报, 2021, 36(12): 3170-3185.
[
|
| [31] |
董又铭, 郭炎, 李志刚, 等. 长江经济带乡村性的时空分异格局及驱动机制. 自然资源学报, 2022, 37(2): 378-395.
[
|
| [32] |
唐宇娣, 朱道林, 程建, 等. 差别定价的产业用地供应策略对产业结构升级的影响: 基于中国277个城市的实证分析. 资源科学, 2020, 42(3): 548-557.
[
|
/
| 〈 |
|
〉 |

