
JOURNAL OF NATURAL RESOURCES >
Transformation performance characteristics of resource-based cities and their carbon emission reduction effects
Received date: 2022-01-24
Revised date: 2022-08-19
Online published: 2023-01-28
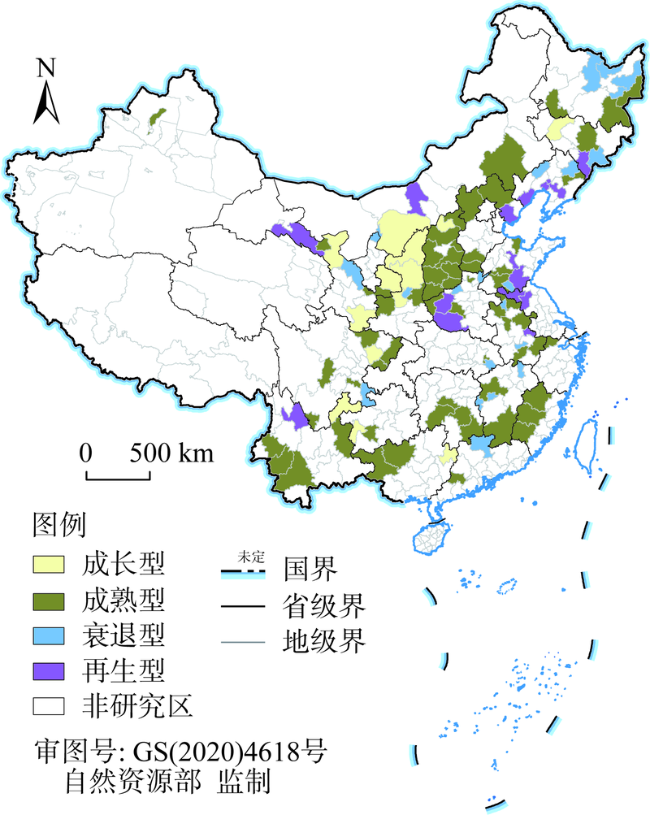
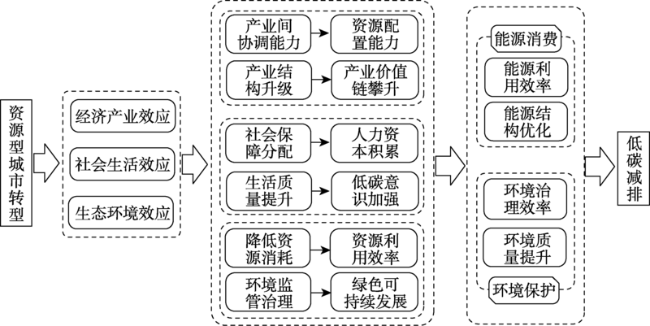
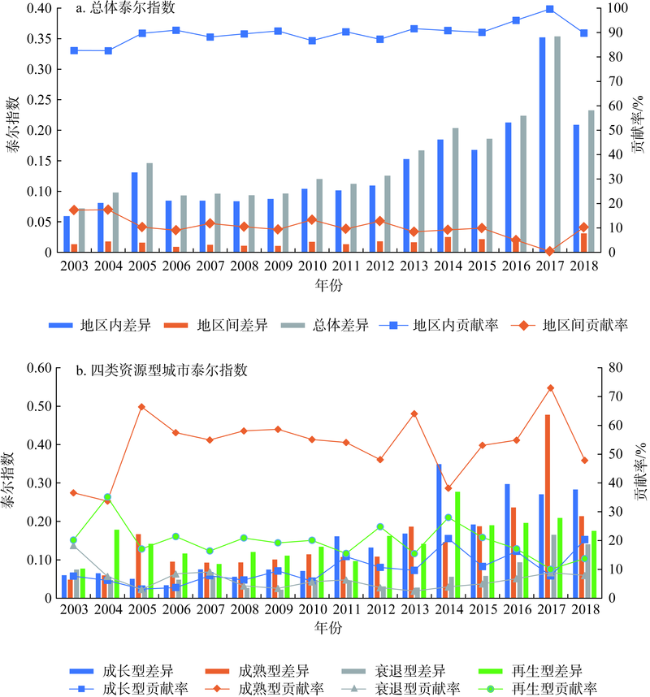
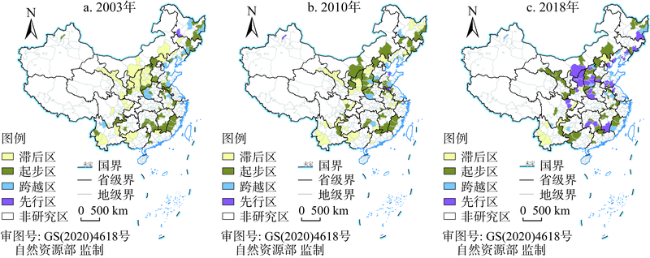
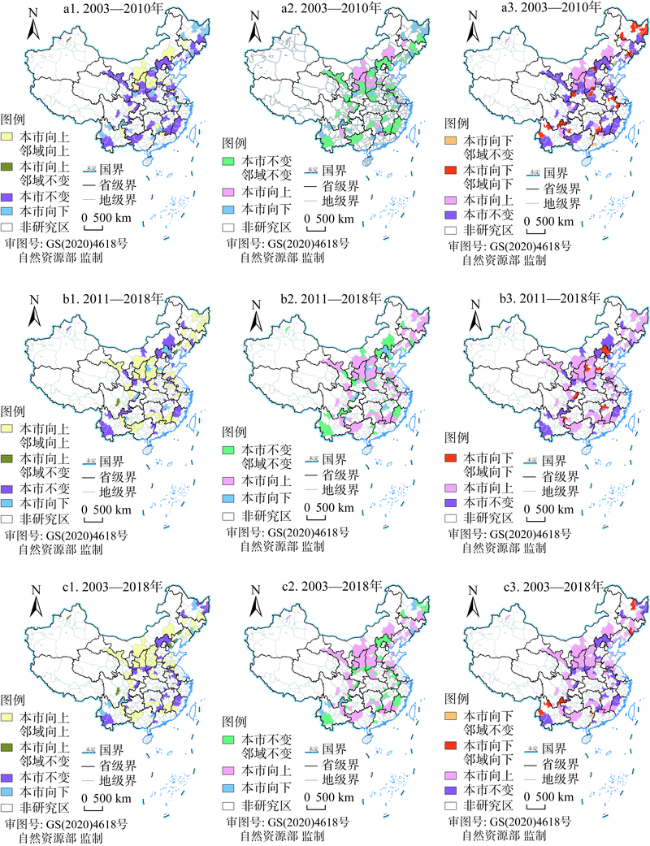
Based on the panel data of China's resource-based cities from 2003 to 2018, this paper comprehensively measures the performance of urban transformation, and uses spatial Markov chain, spatial econometric model and spatial double difference model to explore the performance characteristics of resource-based cities' transformation and its impact on carbon emissions. The results show that: (1) The transformation performance of resource-based cities is increasing year by year, which corresponds to the fluctuating upward trend of regional differences, and the regional differences between the four types of resource-based cities mainly come from regional differences, and mature cities contribute the most; There are obvious spatial differences in the transformation performance of resource-based cities, and the development pattern has evolved from the "multi-point" sporadic distribution with the spanning area as the core to the "cluster" aggregation with the leading area as the core. (2) The transformation performance of resource-based cities has the possibility of state transfer in different periods, which has the characteristics of four convergence clubs: lagging area, starting area, spanning area and leading area. Spatial Markov chain shows that the transfer trend has obvious spatial relevance. State transfer usually occurs between adjacent levels, with less "jumping" transfer phenomenon, and has long-term and sustainable characteristics. (3) The transformation of resource-based cities has significant carbon emission reduction effect, and this effect has the heterogeneity characteristics of different resource types, different development stages and different spatial locations. Economic and industrial transformation, social life transformation and ecological environment transformation are important factors to play the role of carbon emission reduction. Further policy impact analysis shows that the establishment of industrial transformation and upgrading demonstration zones and high-tech industrial development zones has a positive policy effect on urban carbon emission reduction.
XU Wei-xiang , ZHENG Jin-hui , ZHOU Jian-ping , CHEN Xi-lin , LIU Cheng-jun . Transformation performance characteristics of resource-based cities and their carbon emission reduction effects[J]. JOURNAL OF NATURAL RESOURCES, 2023 , 38(1) : 39 -57 . DOI: 10.31497/zrzyxb.20230103
表1 资源型城市转型绩效评价指标体系Table 1 The transformation performance evaluation index system of resource-based cities |
| 一级指标 | 二级指标 | 三级指标 | 指标说明 | 单位 | 性质 |
|---|---|---|---|---|---|
| 经济产业 | 经济活力 | 经济发展 | 地区GDP | 万元 | 正向 |
| 转型 | 经济增长 | GDP增长率 | % | 正向 | |
| 财政收入 | 地方财政一般预算收入 | 万元 | 正向 | ||
| 产业结构 | 产业高级化 | 第三产业产值/第二产业产值 | — | 正向 | |
| 产业合理化 | 一、二、三产业的泰尔指数 | — | 负向 | ||
| 采矿业强度 | 采矿业从业人员所占比例 | % | 负向 | ||
| 社会生活 | 社会保障 | 科学教育 | 教育、科学支出占财政支出比例 | % | 正向 |
| 转型 | 医疗资源 | 万人医院、卫生院床位数 | 张/万人 | 正向 | |
| 失业状况 | 城镇登记失业率 | % | 负向 | ||
| 生活质量 | 居民储蓄 | 人均居民人民币存款 | 元/人 | 正向 | |
| 职工工资 | 在岗职工平均工资 | 元 | 正向 | ||
| 生活消费 | 人均社会消费品零售总额 | 元/人 | 正向 | ||
| 生态环境 | 资源消耗 | 能源消费 | 单位工业产值用电量 | kW·h/万元 | 负向 |
| 转型 | 单位水耗 | 单位GDP用水量 | t/万元 | 负向 | |
| 土地利用 | 单位土地创造的GDP | 万元/km2 | 正向 | ||
| 环境治理 | 废物利用 | 工业固体废物综合利用率 | % | 正向 | |
| 污水处理 | 生活污水处理率 | % | 正向 | ||
| 垃圾处理 | 生活垃圾无害化处理率 | % | 正向 |
表2 空间马尔可夫转移概率Table 2 Spatial markov transition probability |
| 类型 | 2003—2010年 | 2011—2018年 | 2003—2018年 | ||||||||||||
|---|---|---|---|---|---|---|---|---|---|---|---|---|---|---|---|
| 滞后 | 起步 | 跨越 | 先行 | 滞后 | 起步 | 跨越 | 先行 | 滞后 | 起步 | 跨越 | 先行 | ||||
| 滞后 | 滞后 | 0.809 | 0.183 | 0.004 | 0.004 | 0.764 | 0.186 | 0.029 | 0.021 | 0.774 | 0.192 | 0.011 | 0.023 | ||
| 起步 | 0.297 | 0.658 | 0.045 | 0.000 | 0.424 | 0.457 | 0.068 | 0.051 | 0.307 | 0.598 | 0.074 | 0.021 | |||
| 跨越 | 0.100 | 0.300 | 0.400 | 0.200 | 0.250 | 0.250 | 0.312 | 0.188 | 0.116 | 0.302 | 0.373 | 0.209 | |||
| 先行 | 0.500 | 0.000 | 0.500 | 0.000 | 0.000 | 0.200 | 0.600 | 0.200 | 0.333 | 0.083 | 0.500 | 0.084 | |||
| 起步 | 滞后 | 0.784 | 0.207 | 0.009 | 0.000 | 0.500 | 0.371 | 0.060 | 0.069 | 0.637 | 0.294 | 0.033 | 0.036 | ||
| 起步 | 0.200 | 0.683 | 0.117 | 0.000 | 0.295 | 0.591 | 0.104 | 0.010 | 0.228 | 0.641 | 0.128 | 0.003 | |||
| 跨越 | 0.069 | 0.552 | 0.241 | 0.138 | 0.200 | 0.400 | 0.320 | 0.080 | 0.146 | 0.354 | 0.390 | 0.110 | |||
| 先行 | 0.000 | 0.000 | 1.000 | 0.000 | 0.500 | 0.000 | 0.500 | 0.000 | 0.083 | 0.000 | 0.583 | 0.334 | |||
| 跨越 | 滞后 | 0.900 | 0.100 | 0.000 | 0.000 | 0.211 | 0.263 | 0.000 | 0.526 | 0.692 | 0.212 | 0.038 | 0.058 | ||
| 起步 | 0.250 | 0.500 | 0.250 | 0.000 | 0.185 | 0.408 | 0.222 | 0.185 | 0.302 | 0.442 | 0.163 | 0.093 | |||
| 跨越 | 0.077 | 0.385 | 0.461 | 0.077 | 0.115 | 0.250 | 0.500 | 0.135 | 0.068 | 0.318 | 0.500 | 0.114 | |||
| 先行 | 0.000 | 0.000 | 0.000 | 1.000 | 0.286 | 0.071 | 0.357 | 0.286 | 0.091 | 0.091 | 0.454 | 0.364 | |||
| 先行 | 滞后 | 0.000 | 0.000 | 0.000 | 0.000 | 0.000 | 0.000 | 0.000 | 0.000 | 0.000 | 0.000 | 0.000 | 0.000 | ||
| 起步 | 0.000 | 0.000 | 0.000 | 0.000 | 0.000 | 0.000 | 0.000 | 0.000 | 0.000 | 0.000 | 0.000 | 0.000 | |||
| 跨越 | 0.000 | 0.000 | 0.500 | 0.500 | 0.000 | 0.000 | 0.750 | 0.250 | 0.000 | 0.000 | 0.333 | 0.667 | |||
| 先行 | 0.000 | 0.000 | 0.400 | 0.600 | 0.000 | 0.000 | 0.100 | 0.900 | 0.000 | 0.000 | 0.167 | 0.833 | |||
表3 Moran's I统计量检验结果Table 3 Moran's I test results |
| 年份 | 2003 | 2004 | 2005 | 2006 | 2007 | 2008 | 2009 | 2010 |
|---|---|---|---|---|---|---|---|---|
| TRA | 0.261*** | 0.122* | 0.326*** | 0.400*** | 0.353*** | 0.131* | 0.050*** | 0.029*** |
| EMI | 0.164*** | 0.165*** | 0.167*** | 0.167*** | 0.170*** | 0.169*** | 0.166*** | 0.163*** |
| TRA与EMI | 0.105* | 0.284*** | 0.154** | 0.085 | 0.183*** | 0.066 | 0.106* | 0.113** |
| 年份 | 2011 | 2012 | 2013 | 2014 | 2015 | 2016 | 2017 | 2018 |
| TRA | 0.249*** | 0.102 | 0.089 | 0.082 | 0.012 | 0.139* | 0.151** | 0.281*** |
| EMI | 0.163*** | 0.162*** | 0.153*** | 0.150*** | 0.152*** | 0.151*** | 0.144*** | 0.101*** |
| TRA与EMI | 0.232*** | 0.221*** | 0.103* | 0.082 | 0.046 | 0.250*** | 0.133** | 0.178*** |
注:*、**、***分别表示10%、5%、1%的显著性水平,下同。 |
表4 模型基础估计结果Table 4 The base model estimation results |
| 变量 | 面板FE模型 | 内生性检验 | 稳健性检验 | 空间杜宾模型 | |||||
|---|---|---|---|---|---|---|---|---|---|
| lnEMI | lnEMI | lnCOG | lnEMI | Main | W×X | ||||
| TRA | -0.484*** | -0.646* | -0.400*** | -0.461*** | -0.721*** | -0.532* | |||
| (-7.16) | (-1.86) | (-12.48) | (-6.68) | (-2.80) | (-1.84) | ||||
| GOV | 0.538*** | -3.039*** | -0.073 | 0.806*** | 0.461*** | -0.589*** | |||
| (3.13) | (-4.21) | (-0.76) | (3.56) | (4.45) | (-4.24) | ||||
| POP | 1.887*** | -0.178 | 0.157 | 1.732*** | 0.034 | 0.357* | |||
| (3.87) | (-1.23) | (0.66) | (3.84) | (0.27) | (1.79) | ||||
| ENR | 0.078** | 0.021 | -0.030 | 0.070* | -0.030* | -0.009 | |||
| (2.23) | (0.10) | (-1.18) | (1.84) | (-1.82) | (-0.42) | ||||
| FIN | -0.047* | 0.577*** | -0.018 | -0.054 | -0.066*** | 0.090*** | |||
| (-1.67) | (5.86) | (-0.85) | (-1.52) | (-3.27) | (3.58) | ||||
| INF | 0.144*** | 0.496*** | -0.022 | 0.144*** | 0.018 | 0.001 | |||
| (5.40) | (2.91) | (-1.13) | (5.23) | (1.41) | (0.03) | ||||
| SIZ | 0.072*** | 0.097* | -0.054*** | 0.068*** | -0.022*** | 0.011 | |||
| (4.73) | (1.65) | (-4.12) | (4.44) | (-3.14) | (1.26) | ||||
| cons/rho | 9.963*** | 3.724*** | 0.943 | 9.281*** | 0.200*** | ||||
| (5.39) | (17.42) | (0.72) | (5.41) | (8.48) | |||||
| N/个 | 1792 | 1568 | 1792 | 1792 | 1792 | ||||
| R2 | 0.331 | 0.067 | 0.442 | 0.338 | 0.207 | ||||
注:括号内为t值;在内生性检验模型中,AR(1) 检验结果为-3.24(P=0.001),AR(2) 检验结果为-2.40(P=0.216);Hansen检验结果为83.16(P=0.122)。在非空间计量模型(面板FE、内生性、稳健性)中的cons表示常数项,在空间计量模型中的rho表示空间滞后项,下同。 |
表5 异质性分析结果Table 5 The results of heterogeneity analysis |
| 变量 | 不同资源类型 | 不同发展阶段 | 不同空间区位 | ||||||||||
|---|---|---|---|---|---|---|---|---|---|---|---|---|---|
| 成长型 | 成熟型 | 衰退型 | 再生型 | 滞后区 | 起步区 | 跨越区 | 先行区 | 东部 | 中部 | 西部 | |||
| TRA | -0.945** | -0.639*** | 0.053 | -0.109** | -0.106 | -0.246 | -0.795*** | -0.166* | -0.607*** | -0.232 | -1.061** | ||
| (-2.22) | (-3.33) | (0.14) | (-2.31) | (-0.35) | (-0.86) | (-6.07) | (-1.65) | (-4.53) | (-1.32) | (-2.56) | |||
| W×TRA | 1.783 | -0.720** | -0.639 | -0.820** | 0.186 | -0.672* | 0.467*** | 0.018 | -0.011 | -0.481** | 1.572** | ||
| (1.60) | (-2.41) | (-0.89) | (-2.21) | (0.39) | (-1.79) | (3.13) | (0.12) | (-0.06) | (-2.24) | (2.14) | |||
| 控制变量 | 是 | 是 | 是 | 是 | 是 | 是 | 是 | 是 | 是 | 是 | 是 | ||
| rho | 0.505*** | 0.127*** | 0.027*** | 0.029*** | 0.135** | 0.219*** | 0.453*** | 0.061*** | 0.385*** | 0.213*** | 0.261*** | ||
| (4.31) | (3.27) | (13.39) | (10.89) | (2.05) | (3.39) | (15.77) | (16.49) | (9.33) | (7.33) | (5.49) | |||
| N/个 | 208 | 992 | 352 | 240 | 352 | 288 | 608 | 544 | 352 | 944 | 496 | ||
| R2 | 0.251 | 0.032 | 0.138 | 0.230 | 0.222 | 0.520 | 0.368 | 0.466 | 0.509 | 0.220 | 0.201 | ||
表6 资源型城市转型的作用分解Table 6 Decomposition of the role of resource-based city transformation development |
| 变量 | 经济产业转型 | 社会生活转型 | 生态环境转型 | |||||
|---|---|---|---|---|---|---|---|---|
| Main | W×X | Main | W×X | Main | W×X | |||
| X | -0.507*** | -0.126 | -0.363* | -0.541*** | -0.511* | -1.237*** | ||
| (-3.53) | (-0.65) | (-1.83) | (-2.75) | (-1.93) | (-3.83) | |||
| 控制 变量 | 是 | 是 | 是 | |||||
| rho | 0.198*** | 0.202*** | 0.391*** | |||||
| (8.38) | (8.56) | (17.24) | ||||||
| N/个 | 1792 | 1792 | 1792 | |||||
| R2 | 0.101 | 0.108 | 0.373 | |||||
表7 政策冲击效应的DID模型估计结果Table 7 The DID model estimation results of policy shocks |
| 变量 | 产业转型升级示范区 | 高新技术产业开发区 | |||
|---|---|---|---|---|---|
| 传统DID | 空间DID | 传统DID | 空间DID | ||
| POC | 0.190 | -0.244*** | -0.064 | -0.053** | |
| (1.50) | (-5.23) | (-1.47) | (-2.06) | ||
| W×POC | 0.098* | 0.070** | |||
| (1.65) | (2.30) | ||||
| rho | 2.430*** | 0.497*** | 2.287*** | 0.502*** | |
| (3.26) | (28.83) | (3.10) | (29.26) | ||
| 控制变量 | 是 | 是 | 是 | 是 | |
| N/个 | 1792 | 1792 | 1792 | 1792 | |
| R2 | 0.673 | 0.401 | 0.670 | 0.383 | |
| [1] |
王回茴, 李汉廷, 谢苗苗, 等. 资源型城市工矿用地系统修复的生态安全格局构建. 自然资源学报, 2020, 35(1): 162-173.
[
|
| [2] |
蒋海兵, 张文忠, 余建辉. 可达性对资源枯竭城市经济转型发展成效的作用机制. 自然资源学报, 2020, 35(2): 257-268.
[
|
| [3] |
|
| [4] |
|
| [5] |
陈妍, 王士君, 梅林. 东北地区非资源型城市与资源型城市产业转型的对比研究. 地理研究, 2021, 40(3): 808-820.
[
|
| [6] |
黄天能, 李江风, 许进龙, 等. 资源枯竭城市转型发展绩效评价及障碍因子诊断: 以湖北大冶为例. 自然资源学报, 2019, 34(7): 1417-1428.
[
|
| [7] |
|
| [8] |
王晓楠, 孙威. 流域资源型城市转型效率及其影响因素. 地理科学进展, 2020, 39(10): 1643-1655.
[
|
| [9] |
李江苏, 王晓蕊, 苗长虹. 基于两种DEA模型的资源型城市发展效率评价比较. 经济地理, 2017, 37(4): 99-106.
[
|
| [10] |
白雪洁, 汪海凤, 闫文凯. 资源衰退、科教支持与城市转型: 基于坏产出动态SBM模型的资源型城市转型效率研究. 中国工业经济, 2014, (11): 30-43.
[
|
| [11] |
|
| [12] |
徐君, 李巧辉, 王育红. 供给侧改革驱动资源型城市转型的机制分析. 中国人口·资源与环境, 2016, 26(10): 53-60.
[
|
| [13] |
徐君, 高厚宾, 王育红. 生态文明视域下资源型城市低碳转型战略框架及路径设计. 管理世界, 2014, (6): 178-179.
[
|
| [14] |
孙天阳, 陆毅, 成丽红. 资源枯竭型城市扶助政策实施效果、长效机制与产业升级. 中国工业经济, 2020, (7): 98-116.
[
|
| [15] |
叶雪洁, 吕莉, 王晓蕾. 经济地质学视角下的资源型城市产业转型路径研究: 以淮南市为例. 中国软科学, 2018, (2): 186-192.
[
|
| [16] |
谭俊涛, 张新林, 刘雷, 等. 中国资源型城市转型绩效测度与评价. 经济地理, 2020, 40(7): 57-64.
[
|
| [17] |
张梦朔, 张平宇, 李鹤. 资源型城市经济转型绩效特征与评价方法: 基于东北地区的实证研究. 自然资源学报, 2021, 36(8): 2051-2064.
[
|
| [18] |
张荣光, 付俊, 杨劬. 资源型城市转型效率及影响因素: 以四川为例. 财经科学, 2017, (6): 115-123.
[
|
| [19] |
余建辉, 李佳洺, 张文忠. 中国资源型城市识别与综合类型划分. 地理学报, 2018, 73(4): 677-687.
[
|
| [20] |
原嫄, 周洁. 中国省域尺度下产业结构多维度特征及演化对碳排放的影响. 自然资源学报, 2021, 36(12): 3186-3202.
[
|
| [21] |
张伟, 朱启贵, 高辉. 产业结构升级、能源结构优化与产业体系低碳化发展. 经济研究, 2016, (12): 62-75.
[
|
| [22] |
逯进, 赵亚楠, 陈阳. 人力资本、技术创新对环境污染的影响机制: 基于全国285个城市的实证分析. 长江流域资源与环境, 2019, 28(9): 2186-2196.
[
|
| [23] |
|
| [24] |
|
| [25] |
刘凯, 吴怡, 陶雅萌, 等. 中国省域生态文明建设对碳排放强度的影响. 中国人口·资源与环境, 2019, 29(7): 50-56.
[
|
| [26] |
徐辉, 王成亮, 冯国强. 环境分权对中国污染减排效果的影响: 基于空间动态面板模型的检验. 资源科学, 2021, 43(6): 1128-1139.
[
|
| [27] |
聂长飞, 简新华. 中国高质量发展的测度及省际现状的分析比较. 数量经济技术经济研究, 2020, 27(2): 26-47.
[
|
| [28] |
胡森林, 焦世泰, 张晓奇. 中国城市旅游发展的时空演化及影响因素: 基于动态空间马尔科夫链模型的分析. 自然资源学报, 2021, 36(4): 854-865.
[
|
| [29] |
|
| [30] |
彭飞, 金慧晴. 区域产业政策有效性评估: 基于中国资源型和老工业城市的证据. 产业经济研究, 2021, (3): 99-111.
[
|
| [31] |
|
| [32] |
张金萍, 秦耀辰, 张丽君, 等. 黄河下游沿岸地市CO2排放的时空分异. 地理研究, 2012, 31(12): 2229-2239.
[
|
| [33] |
|
| [34] |
|
/
| 〈 |
|
〉 |