
JOURNAL OF NATURAL RESOURCES >
Differential response of housing price in resource-based cities and its influencing factors within the context of population shrinkage
Received date: 2022-01-16
Revised date: 2022-05-29
Online published: 2023-01-28
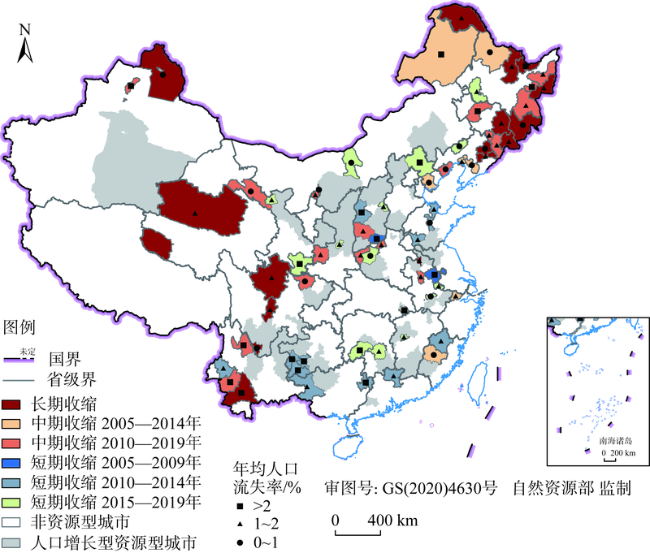
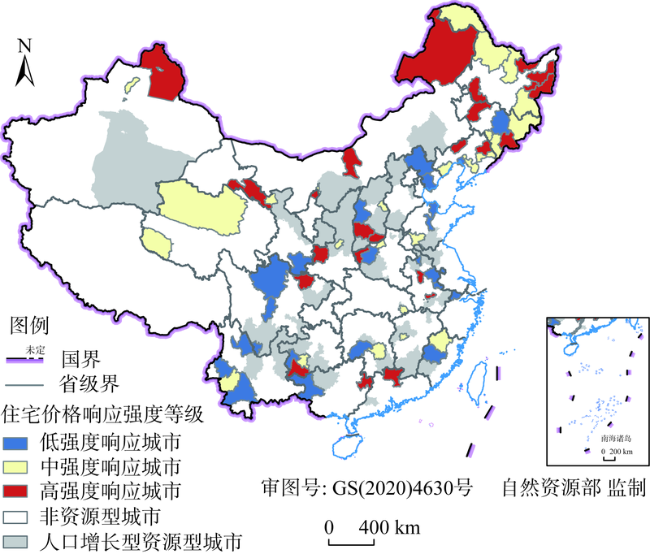
In this paper, resource-based cities (RCs) with shrinking population in China are taken as cases to analyze the spatio-temporal evolution characteristics of urban population and housing price since 2005, and compare the different response characteristics of urban housing prices during the period of population shrinkage in terms of the amount and speed of housing price appreciation. In addition, the grey correlation model is adopted to identify factors influencing different responses of housing prices. The results show that: (1) The population shrinkage of RCs in China is getting worse, but the housing prices of 90% RCs are increasing during the period of population shrinkage. Only a few RCs, mainly in Eastern Heilongjiang, Northwestern Gansu and Central Shanxi, have seen a slight decline in house prices. (2) There are obvious differences in housing price response intensity in RCs under the background of population shrinkage. Cities of high response intensity grades mainly include the moderate population shrinkage cities, the declining and mature coal resource cities, the border RCs, and the RCs in the border area of provinces. (3) For most RCs, population shrinkage is not closely correlated with housing price response. Other factors are more closely correlated with the response to housing prices, and there are significant differences among cities with different housing price response intensity.
LI Yan-lin , LI He . Differential response of housing price in resource-based cities and its influencing factors within the context of population shrinkage[J]. JOURNAL OF NATURAL RESOURCES, 2023 , 38(1) : 157 -170 . DOI: 10.31497/zrzyxb.20230110
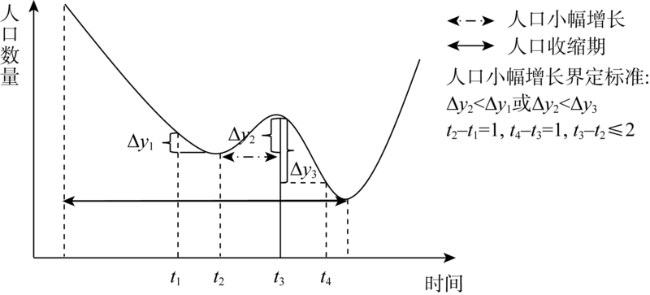
表1 资源型城市人口收缩情况Table 1 Population shrinkage of resource-based cities |
| 人口流失情况 | 短期收缩型 | 中期收缩型 | 长期收缩型 | ||||||
|---|---|---|---|---|---|---|---|---|---|
| 数量/个 | 占比/% | 数量/个 | 占比/% | 数量/个 | 占比/% | ||||
| 年均人口流失率/% | 0~1 | 5 | 17.9 | 8 | 29.6 | 4 | 25.0 | ||
| 1~2 | 13 | 46.4 | 12 | 44.5 | 10 | 62.5 | |||
| >2 | 10 | 35.7 | 7 | 25.9 | 2 | 12.5 | |||
| 人口收缩发生时间段/年 | 2005—2009 | 2 | 7.1 | ||||||
| 2010—2014 | 12 | 42.9 | |||||||
| 2015—2019 | 14 | 50.0 | |||||||
| 2005—2014 | 8 | 29.6 | |||||||
| 2010—2019 | 19 | 70.4 | |||||||
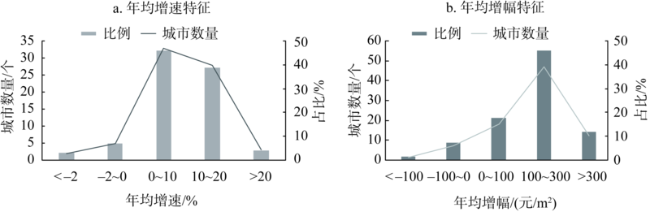
表2 不同收缩时长资源型城市住宅价格响应特征Table 2 Response characteristics of housing price in resource-based cities with different shrinkage periods |
| 住宅价格响应特征 | 短期收缩型 | 中期收缩型 | 长期收缩型 | ||||||
|---|---|---|---|---|---|---|---|---|---|
| 城市数量/个 | 占比/% | 城市数量/个 | 占比/% | 城市数量/个 | 占比/% | ||||
| 年均增幅/(元/m2) | < -100 | 1 | 3.6 | 0 | 0 | 0 | 0 | ||
| -100~0 | 2 | 7.0 | 4 | 14.8 | 0 | 0 | |||
| 0~100 | 5 | 17.9 | 3 | 11.1 | 7 | 43.8 | |||
| 100~300 | 12 | 42.9 | 18 | 66.7 | 9 | 56.2 | |||
| >300 | 8 | 28.6 | 2 | 7.4 | 0 | 0 | |||
| 年均增速/% | < -2 | 1 | 3.6 | 1 | 3.7 | 0 | 0 | ||
| -2~0 | 2 | 7.0 | 3 | 11.1 | 0 | 0 | |||
| 0~10 | 12 | 42.9 | 15 | 55.6 | 6 | 37.5 | |||
| 10~20 | 12 | 42.9 | 6 | 22.2 | 10 | 62.5 | |||
| >20 | 1 | 3.6 | 2 | 7.4 | 0 | 0 | |||
| 响应强度 | 高强度 | 8 | 28.6 | 11 | 40.7 | 5 | 31.3 | ||
| 中强度 | 8 | 28.6 | 11 | 40.7 | 5 | 31.3 | |||
| 低强度 | 12 | 42.8 | 5 | 18.6 | 6 | 37.4 | |||
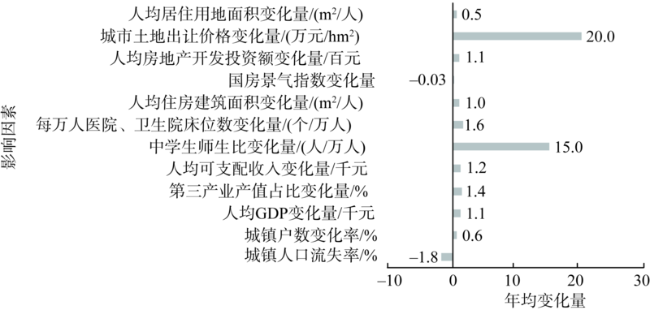
表3 住宅价格响应强度的影响因素指标体系Table 3 Indicator system of factors affecting the difference in housing price response intensity |
| 维度 | 解释变量 | 变量代码 |
|---|---|---|
| 人口与户数 变动 | 城镇人口流失率 | X1 |
| 城镇户数变化率 | X2 | |
| 经济发展水平 与结构 | 人均GDP变化量 | X3 |
| 第三产业产值占比变化量 | X4 | |
| 城镇居民人均可支配收入变化量 | X5 | |
| 居住与配套 服务条件 | 中学生师生比变化量 | X6 |
| 每万人医院、卫生院床位 数变化量 | X7 | |
| 人均住房建筑面积变化量 | X8 | |
| 住宅市场 发展情况 | 国房景气指数变化量 | X9 |
| 人均房地产开发投资完成 额变化量 | X10 | |
| 城市土地供应 | 城市土地出让价格变化量 | X11 |
| 人均居住用地面积变化量 | X12 |
注:各影响因素变化率、变化量皆为年均变化率、年均变化量;人均居住用地指标中涉及的人口按城区总人口(城区户籍人口+城区暂住人口)计,与居住用地统计范围保持一致;城市土地出让价格数据来自中国土地市场网(https://www.landchina.com/)公布的土地供应结果,整理汇总求得逐年逐市(招拍挂)土地出让价格;考虑到各盟州影响因素数据缺乏,实际用于住宅价格响应成因分析的地级单元为65个资源型城市。 |
图5 全样本影响因素平均变化情况Fig. 5 The average change of influencing factors in the whole sample |
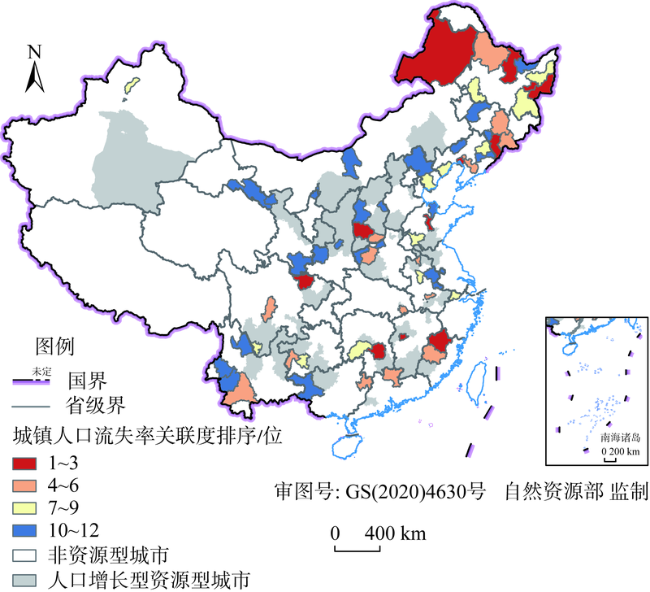
表4 灰色关联分析结果Table 4 The results of grey correlation analysis (%) |
| 影响因素 | 城市占比 | 排序1~3位 | ||||||
|---|---|---|---|---|---|---|---|---|
| 排序1~3位 | 排序4~6位 | 排序7~9位 | 排序10~12位 | 高强度 | 中强度 | 低强度 | ||
| X1 | 18.46 | 23.08 | 20.00 | 38.46 | 22.73 | 23.81 | 9.52 | |
| X2 | 29.23 | 23.08 | 26.15 | 21.54 | 22.73 | 33.33 | 33.33 | |
| X3 | 38.46 | 12.31 | 27.69 | 21.54 | 27.27 | 42.86 | 47.62 | |
| X4 | 23.08 | 24.62 | 26.15 | 26.15 | 13.64 | 33.33 | 23.81 | |
| X5 | 29.23 | 13.85 | 23.08 | 33.85 | 31.82 | 14.29 | 42.86 | |
| X6 | 26.15 | 10.77 | 27.69 | 35.38 | 36.36 | 23.81 | 19.05 | |
| X7 | 15.38 | 33.85 | 24.62 | 26.15 | 9.09 | 19.05 | 19.05 | |
| X8 | 26.98 | 31.75 | 17.46 | 23.81 | 33.33 | 38.10 | 9.52 | |
| X9 | 18.46 | 33.85 | 33.85 | 13.85 | 9.09 | 28.57 | 19.05 | |
| X10 | 27.69 | 38.46 | 18.46 | 15.38 | 27.27 | 14.29 | 42.86 | |
| X11 | 24.62 | 27.69 | 33.85 | 13.85 | 40.91 | 14.29 | 19.05 | |
| X12 | 23.08 | 27.69 | 21.54 | 27.69 | 27.27 | 14.29 | 28.57 | |
| [1] |
|
| [2] |
|
| [3] |
|
| [4] |
|
| [5] |
|
| [6] |
|
| [7] |
何鑫, 田丽慧, 楚尔鸣. 人口流动视角下中国房价波动的空间异质性. 人口与经济, 2017, (6): 43-57.
[
|
| [8] |
|
| [9] |
范百灵. 城镇化对房价影响及其区域差异性研究. 价格理论与实践, 2021, (3): 39-42.
[
|
| [10] |
|
| [11] |
吴康, 龙瀛, 杨宇. 京津冀与长江三角洲的局部收缩: 格局、类型与影响因素识别. 现代城市研究, 2015, (9): 26-35.
[
|
| [12] |
|
| [13] |
|
| [14] |
|
| [15] |
|
| [16] |
|
| [17] |
刘云刚. 中国资源型城市界定方法的再考察. 经济地理, 2006, 26(6): 940-944.
[
|
| [18] |
|
| [19] |
|
| [20] |
|
| [21] |
湛东升, 吴倩倩, 余建辉, 等. 中国资源型城市房价时空变化与影响因素分析. 自然资源学报, 2020, 35(12): 2888-2900.
[
|
| [22] |
王洋, 王德利, 王少剑. 中国城市住宅价格的空间分异格局及影响因素. 地理科学, 2013, 33(10): 1157-1165.
[
|
| [23] |
袁东, 何秋谷, 赵波. 房价变动的影响因素研究: 一个文献综述. 经济与管理研究, 2016, 37(3): 77-85.
[
|
| [24] |
张梦朔, 张平宇, 李鹤. 资源型城市经济转型绩效特征与评价方法: 基于东北地区的实证研究. 自然资源学报, 2021, 36(8): 2051-2064.
[
|
/
| 〈 |
|
〉 |