
JOURNAL OF NATURAL RESOURCES >
Theoretical mechanism and empirical analysis on the influence of agricultural chemical fertilizer input by cooperatives with agricultural product quality certification
Received date: 2021-10-18
Revised date: 2022-07-11
Online published: 2022-12-28
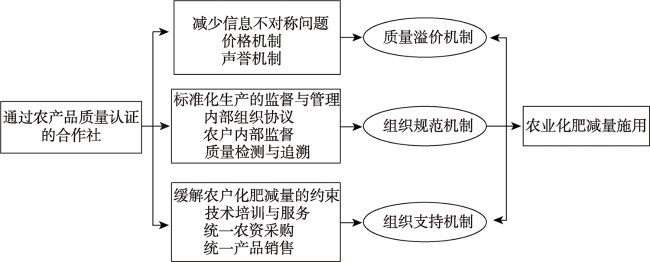
Promoting chemical fertilizer reduction is an effective measure to improve the quality of agricultural products and achieve the high-quality agriculture in China. Nevertheless, numerous smallholders with the characteristics of scattered plots and small-scale is not conducive to the popularization of technology to reduce the amount of chemical fertilizer. Agricultural cooperative has been proposed as an important institutional arrangement to make up for the shortage of smallholders and implement agricultural product quality certification. In the process of cooperative development, whether and how cooperatives can promote chemical fertilizer reduction is an important practical question to be answered urgently. This study focuses on cooperatives that have been obtained agricultural product quality certification, and explore the impact of cooperative development on the amount of chemical fertilizer and its mechanism. The panel data from 30 provincial-level regions in China from 2007 to 2018 were used to conduct an empirical analysis. The results show that: (1) Cooperatives that have obtained agricultural product quality certification have a significant effect on the reduction of fertilizer application, which can achieve the goal mainly through transmission paths including quality premiums, organizational norms and organizational support. (2) In terms of regional differences, our results show that in provinces with larger fertilizer applications, the effect of fertilizer reduction of agricultural product quality certification cooperatives is more significant. In terms of crop differences, the chemical fertilizer reduction effects of cooperatives with agricultural product quality certification are related with the three major grain crops (i.e., rice, wheat and corn), as well as the commercial crops such as cotton, sugarcane, apples and oranges.
SHEN Xue , AO Rong-jun , GONG Sheng-sheng , ZHANG Jun-biao . Theoretical mechanism and empirical analysis on the influence of agricultural chemical fertilizer input by cooperatives with agricultural product quality certification[J]. JOURNAL OF NATURAL RESOURCES, 2022 , 37(12) : 3267 -3281 . DOI: 10.31497/zrzyxb.20221216
表1 变量定义与描述性分析Table 1 Variable definition and descriptive analysis |
| 变量名称 | 代码 | 变量含义与赋值 | 均值 | 标准差 |
|---|---|---|---|---|
| 被解释变量 | ||||
| 化肥用量 | 单位农作物播种面积化肥用量/(kg/hm2) | 365.400 | 122.600 | |
| 解释变量 | ||||
| 通过农产品质量认证的合作社 | 通过无公害农产品、绿色食品、有机食品等质量认证的 合作社数量/家 | 999.200 | 1153.000 | |
| 控制变量 | ||||
| 城镇化率 | 城镇人口占总人口的比例/% | 54.690 | 13.370 | |
| 人均地区生产总值 | 地区生产总值除以地区总人口/(元/人) | 22863 | 15162 | |
| 农业专业化生产水平 | 赫芬达尔专业化生产指数(0~1) | 0.488 | 0.145 | |
| 农业劳动力数量 | 农林牧渔业从业人口数量/万人 | 895.800 | 658.100 | |
| 农村劳动力平均受教育年限 | 7.723 | 0.863 | ||
| 农业机械化水平 | 单位农作物播种面积农业机械化总动力/(kW·h/hm2) | 6.142 | 2.533 | |
| 有效灌溉率 | 有效灌溉面积占农作物播种面积的百分比/% | 41.454 | 15.649 | |
| 水土治理面积 | 水土流失治理面积/hm2 | 3.705×10⁶ | 2.901×10⁶ | |
| 农地流转率 | 家庭承包土地流转面积占家庭承包经营土地面积的百分比/% | 0.243 | 0.168 | |
| 化学肥料价格指数 | 以2007年为基期的化学肥料价格指数 | 129.494 | 17.166 | |
| 气温 | 日平均温度/℃ | 13.640 | 5.138 | |
| 降水 | 日均降水量/mm | 839.200 | 544.400 | |
| 日照时长 | 年日照总时长/h | 282.100 | 730.500 | |
| 工具变量 | ||||
| 政府支持 | 获得财政资金扶持的合作社占合作社总数的比例/% | 6.472 | 6.182 | |
| 机制变量 | ||||
| 质量溢价 | 合作社社员人均盈余/(元/人) | 2236.975 | 2401.914 | |
| 组织规范 | 实施标准化生产的合作社占合作社总数的比例/% | 5.621 | 7.119 | |
| 组织支持 | 合作社培训成员数量/人次 | 1.189E+06 | 1.546E+06 |
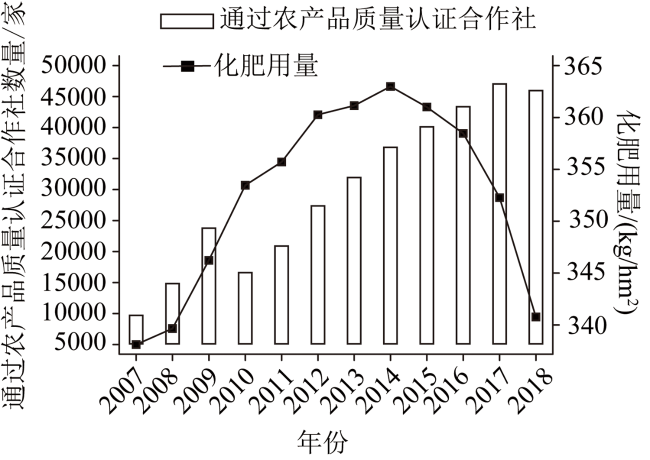
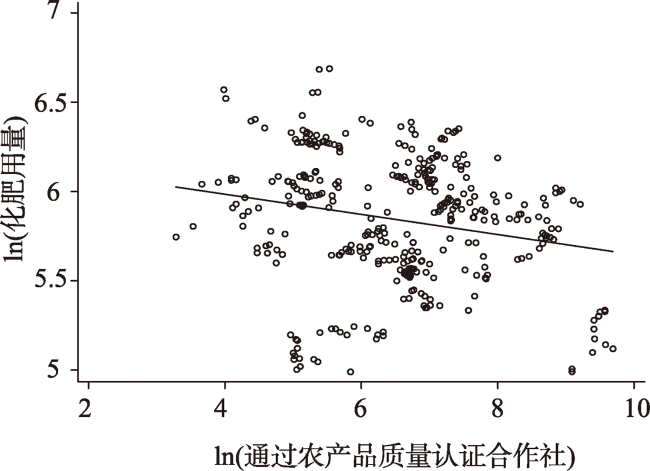
图2 通过农产品质量认证的合作社与化肥用量变化趋势Fig. 2 The trend between cooperatives that have obtained agricultural product quality certification and fertilizer reduction |
表2 通过农产品质量认证的合作社对农业化肥用量的影响Table 2 The impact of cooperatives that have obtained agricultural product quality certification on agricultural fertilizer consumption |
| 变量 | 被解释变量: | |
|---|---|---|
| 模型(1) | 模型(2) | |
| -0.034*** | -0.010** | |
| (0.009) | (0.005) | |
| — | 0.000 | |
| — | (0.007) | |
| — | 0.683* | |
| — | (0.373) | |
| — | -0.020 | |
| — | (0.114) | |
| — | -0.565** | |
| — | (0.263) | |
| — | 0.000 | |
| — | (0.000) | |
| — | -0.022*** | |
| — | (0.005) | |
| — | 0.016** | |
| — | (0.008) | |
| — | 0.862*** | |
| — | (0.128) | |
| — | -0.046 | |
| — | (0.038) | |
| — | -0.163 | |
| — | (0.149) | |
| — | -0.001 | |
| — | (0.001) | |
| — | -0.004 | |
| — | (0.003) | |
| — | -0.009 | |
| — | (0.009) | |
| — | -0.000* | |
| — | (0.000) | |
| 常数项 | 5.911*** | -0.150 |
| (0.340) | (3.336) | |
| 样本量/个 | 360 | 360 |
| R2 | 0.237 | 0.492 |
注:***、**、*分别表示在1%、5%、10%水平下显著,括号内数字为省级层面的聚类标准误,下同。 |
表3 内生性检验结果Table 3 The results of endogenous test |
| 变量 | 模型(1) | 模型(2) | 模型(3) |
|---|---|---|---|
| 被解释变量: | 被解释变量: | 被解释变量: | |
| 0.028*** | — | — | |
| (0.010) | — | — | |
| — | -0.011** | -0.013** | |
| — | (0.005) | (0.006) | |
| — | -0.086*** | — | |
| — | (0.028) | — | |
| 控制变量 | 控制 | 控制 | 控制 |
| 省份固定效应 | 控制 | 控制 | 控制 |
| 年份固定效应 | 控制 | 控制 | 控制 |
| 常数项 | -97.590*** | 7.808** | — |
| (24.397) | (3.675) | — | |
| 样本量/个 | 360 | 360 | 360 |
| R2 | 0.805 | 0.152 | 0.975 |
表4 机制检验结果Table 4 The results of mechanism analysis |
| 变量 | (1) | (2) | (3) | (4) | (5) | (6) |
|---|---|---|---|---|---|---|
| 0.250*** | 14.692* | 0.740*** | -0.034 | -0.102 | -0.002 | |
| (0.087) | (8.099) | (0.043) | (0.158) | (0. 202) | (0. 005) | |
| — | — | — | -14.710* | — | — | |
| — | — | — | (7.864) | — | — | |
| — | — | — | — | -0.005* | — | |
| — | — | — | — | (0.002) | — | |
| — | — | — | — | — | -0.062*** | |
| — | — | — | — | — | (0.020) | |
| -0.218** | -13.616 | -0.769*** | -0.102*** | -0.102*** | -0.034*** | |
| (0.088) | (8.106) | (0.059) | (0.036) | (0.027) | (0.013) | |
| 控制变量 | 控制 | 控制 | 控制 | 控制 | 控制 | 控制 |
| 省份固定效应 | 控制 | 控制 | 控制 | 控制 | 控制 | 控制 |
| 年份固定效应 | 控制 | 控制 | 控制 | 控制 | 控制 | 控制 |
| 常数项 | 14.770 | 15.919 | 13.095*** | 3.776*** | 2.899*** | 16.444*** |
| (9.731) | (7.717) | (1.600) | (0.692) | (0.723) | (7.771) | |
| 样本量/个 | 360 | 360 | 360 | 360 | 360 | 360 |
| R2 | 0.644 | 0.702 | 0.849 | 0.627 | 0.641 | 0.991 |
表5 通过农产品质量认证的合作社对化肥用量的影响:UQR估计结果Table 5 The impact of cooperatives that have obtained agricultural product quality certification on agricultural fertilizer consumption: UQR estimation |
| 变量 | 被解释变量: | |||
|---|---|---|---|---|
| 模型(1) | 模型(2) | 模型(3) | 模型(4) | |
| -0.003 | -0.016* | -0.029* | -0.041** | |
| (0.008) | (0.009) | (0.015) | (0.016) | |
| 控制变量 | 控制 | 控制 | 控制 | 控制 |
| 省份固定效应 | 控制 | 控制 | 控制 | 控制 |
| 年份固定效应 | 控制 | 控制 | 控制 | 控制 |
| 常数项 | 8.782*** | 7.199 | 10.088 | 8.136 |
| (2.575) | (5.239) | (9.863) | (8.353) | |
| 样本量/个 | 360 | 360 | 360 | 360 |
| R2 | 0.051 | 0.060 | 0.279 | 0.309 |
表6 通过农产品质量认证的合作社对不同类别作物的化肥用量影响Table 6 The impact of cooperatives that have obtained agricultural product quality certification on the amount of fertilizers consumption in different crops |
| 变量 | 粮食作物 | 经济作物 | ||||||||||
|---|---|---|---|---|---|---|---|---|---|---|---|---|
| 水稻 | 小麦 | 玉米 | 大豆 | 花生 | 油菜 | 棉花 | 甘蔗 | 苹果 | 柑 | 橘 | ||
| -0.004* | -0.002** | -0.005** | -0.003 | -0.005 | -0.004 | -0.007*** | -0.030** | -0.023*** | -0.046** | 0.008 | ||
| (0.002) | (0.001) | (0.002) | (0.007) | (0.005) | (0.005) | (0.003) | (0.013) | (0.008) | (0.020) | (0.018) | ||
| 控制变量 | 控制 | 控制 | 控制 | 控制 | 控制 | 控制 | 控制 | 控制 | 控制 | 控制 | 控制 | |
| 省份固定效应 | 控制 | 控制 | 控制 | 控制 | 控制 | 控制 | 控制 | 控制 | 控制 | 控制 | 控制 | |
| 年份固定效应 | 控制 | 控制 | 控制 | 控制 | 控制 | 控制 | 控制 | 控制 | 控制 | 控制 | 控制 | |
| 常数项 | 8.252*** | 0.906 | 6.340*** | -5.797 | 5.381 | 7.393 | 11.459*** | 4.586 | 1.188 | 4.423 | 14.489*** | |
| (0.500) | (3.065) | (0.759) | (6.980) | (0.754) | (7.813) | (1.798) | (8.705) | (2.607) | (5.221) | (4.719) | ||
| 样本量/个 | 277 | 184 | 241 | 133 | 124 | 189 | 153 | 62 | 104 | 80 | 79 | |
| R2 | 0.568 | 0.574 | 0.346 | 0.361 | 0.796 | 0.209 | 0.094 | 0.268 | 0.745 | 0.631 | 0.487 | |
| [1] |
中华人民共和国农业农村部. 农业部关于印发《到2020年化肥使用量零增长行动方案》和《到2020年农药使用量零增长行动方案》的通知. http://jiuban.moa.gov.cn/zwllm/tzgg/tz/201503/t20150318_4444765.htm 2015-02-07.
[ Ministry of Agricultural and Rural Affairs of the People's Republic of China. Notice of the Ministry of Agriculture on the issuance of the 'Action Plan for the Zero Growth of Fertilizer Use by 2020' and the 'Action Plan for the Zero Growth of Pesticide Use by 2020'. http://jiuban.moa.gov.cn/zwllm/tzgg/tz/201503/t20150318_4444765.htm 2015-02-07.]
|
| [2] |
栾江, 仇焕广, 井月, 等. 我国化肥施用量持续增长的原因分解及趋势预测. 自然资源学报, 2013, 28(11): 1869-1878.
[
|
| [3] |
国家统计局. 中国统计年鉴. 北京: 中国统计出版社, 2020.
[ National Bureau of Statistics of China. China Statistical Yearbook. Beijing: China Statistics Press, 2020.]
|
| [4] |
夏雯雯, 杜志雄, 郜亮亮. 土地经营规模对测土配方施肥技术应用的影响研究: 基于家庭农场监测数据的观察. 中国土地科学, 2019, 33(11): 70-78.
[
|
| [5] |
史常亮, 张益, 郭焱, 等. 耕地细碎化对农户化肥使用效率的影响. 自然资源学报, 2019, 34(12): 2687-2700.
[
|
| [6] |
江雪萍. 农业分工: 生产环节的可外包性. 南方经济, 2014, (12): 96-104.
[
|
| [7] |
倪国华, 郑风田, 喻志军. 通过“纵向整合”解决“一家两制”的理论与实证. 中国人口·资源与环境, 2014, 24(3): 93-100.
[
|
| [8] |
蔡荣, 汪紫钰, 钱龙, 等. 加入合作社促进了家庭农场选择环境友好型生产方式吗? 以化肥、农药减量施用为例. 中国农村观察, 2019, (1): 51-65.
[
|
| [9] |
高晶晶, 彭超, 史清华. 中国化肥高用量与小农户的施肥行为研究: 基于1995—2016年全国农村固定观察点数据的发现. 管理世界, 2019, 35(10): 120-132.
[
|
| [10] |
陆钰凤, 刘进, 许庆. 中国化肥减量政策变迁及其内在逻辑. 农业经济问题, 2021, (1): 1-12.
[
|
| [11] |
匡远配, 陆钰凤. 我国农地流转“内卷化”陷阱及其出路. 农业经济问题, 2018, (9): 33-43.
[
|
| [12] |
梁志会, 张露, 张俊飚. 土地转入、地块规模与化肥减量: 基于湖北省水稻主产区的实证分析. 中国农村观察, 2020, (5): 73-92.
[
|
| [13] |
农业农村部农村合作经济指导司, 农业农村部政策与改革司. 中国农村经营管理统计年报. 北京: 中国农业出版社, 2014.
[ Department of Rural Cooperative Economic Guidance, Ministry of Agriculture and Rural Affairs, Department of Policy and Reform, Ministry of Agriculture and Rural Affairs. China Rural Management Statistics Annual Report. Beijing: China Agriculture Press, 2014.]
|
| [14] |
|
| [15] |
张悦悦, 李翠珍, 周德, 等. 乡村振兴视域下农村土地利用利益相关者分析. 自然资源学报, 2020, 35(5): 1132-1146.
[
|
| [16] |
康晨远. 因地制宜是农民合作社高质量发展的必然选择. 中国农民合作社, 2021-08-25.
[
|
| [17] |
徐旭初, 吴彬. 合作社是小农户和现代农业发展有机衔接的理想载体吗?. 中国农村经济, 2018, (11): 80-95.
[
|
| [18] |
|
| [19] |
张梦玲, 陈玖昭, 翁贞林, 等. 农业社会化服务对化肥减量施用的影响研究: 基于要素配置的调节效应分析. 农业技术经济, 2022, (3): 1-21.
[
|
| [20] |
冯燕, 吴金芳. 合作社组织、种植规模与农户测土配方施肥技术采纳行为: 基于太湖、巢湖流域水稻种植户的调查. 南京工业大学学报: 社会科学版, 2018, 17(6): 28-37.
[
|
| [21] |
|
| [22] |
|
| [23] |
潘劲. 中国农民专业合作社: 数据背后的解读. 中国农村观察, 2011, (6): 2-11.
[
|
| [24] |
幸家刚. 新型农业经营主体农产品质量安全认证行为研究. 杭州: 浙江大学, 2016.
[
|
| [25] |
杨建辉, 杨伦. 农产品质量安全内部协调度和耦合度测算及影响因素分析. 自然资源学报, 2022, 37(2): 494-507.
[
|
| [26] |
周洁红, 金宇, 王煜, 等. 质量信息公示、信号传递与农产品认证: 基于肉类与蔬菜产业的比较分析. 农业经济问题, 2020, (9): 76-87.
[
|
| [27] |
李晗, 陆迁. 产品质量认证能否提高农户技术效率: 基于山东、河北典型蔬菜种植区的证据. 中国农村经济, 2020, (5): 128-144.
[
|
| [28] |
万凌霄, 蔡海龙. 合作社参与对农户测土配方施肥技术采纳影响研究: 基于标准化生产视角. 农业技术经济, 2021, (3): 63-77.
[
|
| [29] |
陈吉平, 任大鹏. 合作社绿色生产何以可能: 来自四川案例的过程追踪. 农业经济问题, 2022, (5): 1-11.
[
|
| [30] |
|
| [31] |
|
| [32] |
国土资源部. 全国土地整治规划(2011—2015年). http://law168.com.cn/doc/view?id=163986 2012-03-27.
[ Ministry of Land and Resources. National Land Improvement Plan (2011—015). http://law168.com.cn/doc/view?id=163986 2012-03-27.]
|
| [33] |
|
| [34] |
|
| [35] |
|
| [36] |
|
| [37] |
张千友, 蒋和胜. 专业合作、重复博弈与农产品质量安全水平提升的新机制: 基于四川省西昌市鑫源养猪合作社品牌打造的案例分析. 农村经济, 2011, (10): 125-129.
[
|
| [38] |
薛宝飞. 组织支持对农户农产品质量控制行为影响研究. 杨凌: 西北农林科技大学, 2019.
[
|
| [39] |
|
/
| 〈 |
|
〉 |