
JOURNAL OF NATURAL RESOURCES >
Evolution characteristics and formation mechanism of spatial correlation network of ecological well-being performance in China
Received date: 2021-09-27
Revised date: 2021-12-28
Online published: 2022-12-28
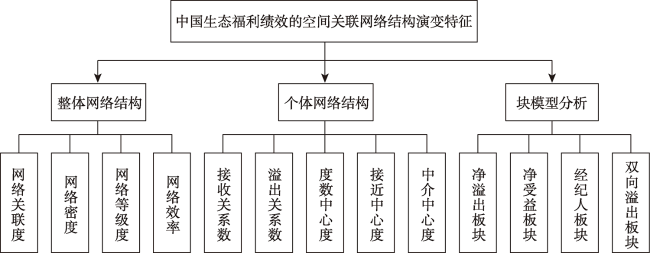
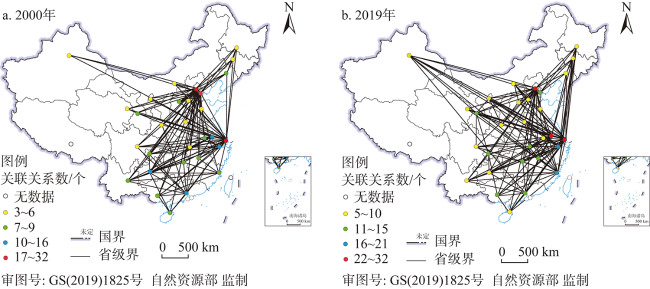
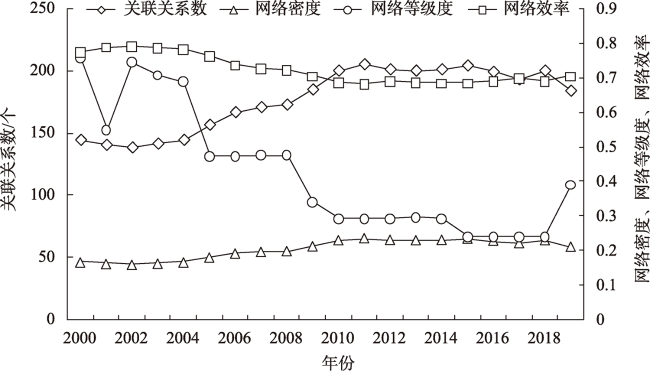
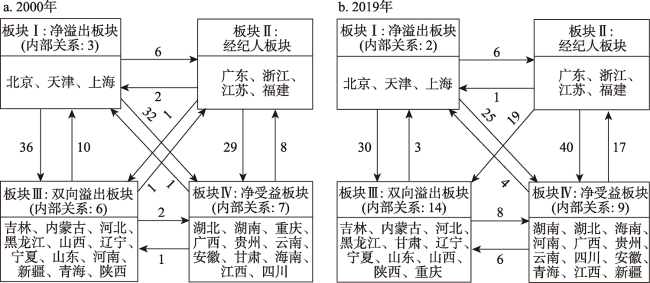
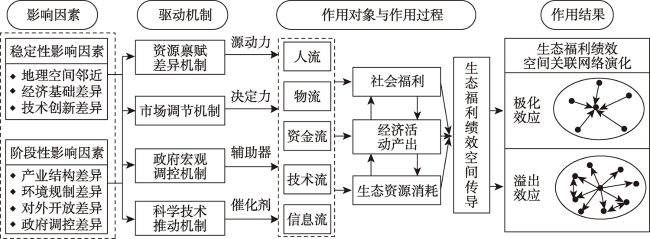
In this article, the ecological well-being performance of provincial-level regions in China from 2000 to 2019 is measured by using the super EBM model considering undesirable output. At the same time, with the help of the modified gravity model and social network analysis method, the evolution characteristics and formation mechanism of China's ecological well-being performance spatial correlation network are analyzed. The results show that: (1) The spatial correlation network of China's ecological well-being performance shows a spatial pattern of "dense in the east but sparse in the west". During the research period, the hierarchical network structure was gradually changed, and the associated network had a "flat" evolution trend. However, the compactness and stability of spatial association networks need to be improved. (2) The Beijing-Tianjin-Hebei region, Yangtze River Delta and Pearl River Delta are at the core of the spatial correlation network, showing obvious spillover effects, while the Northeast, Northwest and Southwest regions are located at the edge of the network. Guizhou and Gansu are the key nodes between the eastern region and the southwest and northwest provinces in the network. The transmission of ecological well-being performance among provinces is mostly realized through the mediating role of southern provinces. On the whole, the eastern coastal provinces are the "overflow highland" in the spatial correlation network, showing a significant "trickling-down effect" on the Northwest, Southwest and Northeast regions, and the benefit effect of the central provinces is not significant. (3) The results of block model analysis show that China's ecological well-being performance has significant spillover effects between provinces and regions, and the spillover effect between regions is the most important. Among them, Beijing, Tianjin and Shanghai play the role of "engine" in the correlation network, forming the net overflow plate. The Pearl River Delta and Jiangsu and Zhejiang belong to the broker plate, the middle and lower reaches of the Yangtze River and Southwest China are net overflow plates, and Northeast region, the middle and lower reaches of the Yellow River and Northwest region constitute two-way overflow plates. (4) Resource endowment difference, market regulation, government macro-control and science and technology progress are the main driving mechanisms for the evolution of spatial correlation network of ecological well-being performance in China. This study can provide an important reference for promoting the regional collaborative improvement of ecological well-being performance.
ZHAO Lin , CAO Nai-gang , HAN Zeng-lin , GAO Xiao-tong . Evolution characteristics and formation mechanism of spatial correlation network of ecological well-being performance in China[J]. JOURNAL OF NATURAL RESOURCES, 2022 , 37(12) : 3183 -3200 . DOI: 10.31497/zrzyxb.20221211
表1 生态福利绩效评价指标体系Table 1 The evaluation index system of ecological well-being performance |
表2 中国生态福利绩效测度结果Table 2 Measure result of ecological well-being performance in China |
| 省(市、自治区) | EWP指数 | 省(市、自治区) | EWP指数 | ||||||||
|---|---|---|---|---|---|---|---|---|---|---|---|
| 2000年 | 2006年 | 2012年 | 2019年 | 增长率 | 2000年 | 2006年 | 2012年 | 2019年 | 增长率 | ||
| 北京 | 0.690 | 0.456 | 0.743 | 1.002 | 1.983 | 湖南 | 0.529 | 0.458 | 0.636 | 0.969 | 3.241 |
| 天津 | 0.467 | 0.454 | 0.660 | 0.602 | 1.337 | 广东 | 0.381 | 0.314 | 0.460 | 0.620 | 2.597 |
| 河北 | 0.428 | 0.399 | 0.587 | 0.748 | 2.986 | 广西 | 0.341 | 0.411 | 0.577 | 0.714 | 3.968 |
| 山西 | 0.491 | 0.518 | 0.651 | 0.749 | 2.251 | 海南 | 0.658 | 0.461 | 0.603 | 0.685 | 0.217 |
| 内蒙古 | 0.387 | 0.322 | 0.482 | 0.565 | 2.010 | 重庆 | 0.384 | 0.265 | 0.439 | 0.627 | 2.609 |
| 辽宁 | 0.347 | 0.343 | 0.457 | 0.446 | 1.322 | 四川 | 0.339 | 0.338 | 0.602 | 0.702 | 3.904 |
| 吉林 | 0.396 | 0.356 | 0.414 | 0.470 | 0.907 | 贵州 | 0.132 | 0.200 | 0.536 | 0.704 | 9.188 |
| 黑龙江 | 0.328 | 0.295 | 0.404 | 0.469 | 1.899 | 云南 | 0.339 | 0.285 | 0.489 | 0.837 | 4.874 |
| 上海 | 0.616 | 0.583 | 0.721 | 0.956 | 2.339 | 陕西 | 0.561 | 0.571 | 0.804 | 0.941 | 2.761 |
| 江苏 | 0.442 | 0.374 | 0.518 | 0.698 | 2.435 | 甘肃 | 0.295 | 0.319 | 0.460 | 0.602 | 3.831 |
| 浙江 | 0.361 | 0.405 | 0.593 | 0.744 | 3.872 | 青海 | 0.413 | 0.375 | 0.667 | 0.635 | 2.296 |
| 安徽 | 0.252 | 0.352 | 0.497 | 0.667 | 5.249 | 宁夏 | 0.308 | 0.203 | 0.253 | 0.352 | 0.708 |
| 福建 | 0.441 | 0.393 | 0.558 | 0.779 | 3.045 | 新疆 | 0.410 | 0.356 | 0.408 | 0.415 | 0.068 |
| 江西 | 0.406 | 0.347 | 0.587 | 0.666 | 2.635 | 东部 | 0.479 | 0.412 | 0.583 | 0.713 | 2.121 |
| 山东 | 0.435 | 0.349 | 0.517 | 0.567 | 1.403 | 中部 | 0.408 | 0.403 | 0.544 | 0.686 | 2.774 |
| 河南 | 0.459 | 0.445 | 0.602 | 0.816 | 3.076 | 西部 | 0.355 | 0.331 | 0.520 | 0.645 | 3.187 |
| 湖北 | 0.404 | 0.452 | 0.562 | 0.685 | 2.814 | 全国 | 0.415 | 0.380 | 0.550 | 0.681 | 2.646 |
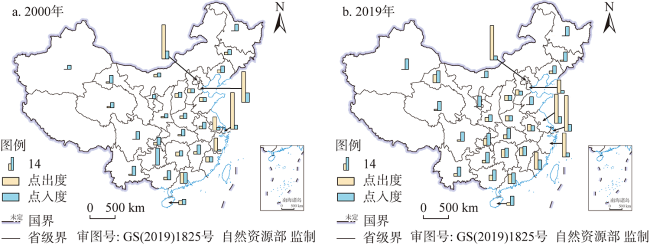
图4 中国生态福利绩效溢出和受益关系的空间格局Fig. 4 Spatial pattern of spillover and benefit relationship of ecological well-being performance in China |
表3 中国生态福利绩效空间关联网络的中心性特征Table 3 Centrality of spatial correlation network of ecological well-being performance in China |
| 省(市、自治区) | 网络中心性指标 | 省(市、自治区) | 网络中心性指标 | ||||
|---|---|---|---|---|---|---|---|
| 度数中心度 | 接近中心度 | 中介中心度 | 度数中心度 | 接近中心度 | 中介中心度 | ||
| 北京 | 89.655/89.655 | 87.879/90.625 | 9.113/7.681 | 湖北 | 20.690/31.034 | 3.448/37.662 | 0.000/0.252 |
| 天津 | 82.759/34.483 | 80.556/56.863 | 7.202/0.431 | 湖南 | 20.690/27.586 | 4.715/53.704 | 0.369/9.892 |
| 河北 | 13.793/17.241 | 49.153/50.877 | 0.059/3.038 | 广东 | 37.931/31.034 | 4.754/42.029 | 5.111/15.237 |
| 山西 | 17.241/24.138 | 49.153/50.877 | 0.100/1.790 | 广西 | 24.138/27.586 | 4.700/37.179 | 0.544/9.190 |
| 内蒙古 | 10.345/17.241 | 48.333/3.333 | 0.059/0.000 | 海南 | 17.241/24.138 | 4.708/32.955 | 0.062/0.059 |
| 辽宁 | 20.690/24.138 | 3.571/3.571 | 0.082/0.123 | 重庆 | 24.138/31.034 | 4.700/31.183 | 0.092/14.26 |
| 吉林 | 17.241/24.138 | 3.571/3.567 | 0.000/0.883 | 四川 | 20.690/24.138 | 3.333/23.967 | 0.000/0.038 |
| 黑龙江 | 17.241/24.138 | 3.333/3.333 | 0.000/0.000 | 贵州 | 44.828/27.586 | 3.333/32.955 | 0.000/2.704 |
| 上海 | 96.552/93.103 | 96.667/93.548 | 7.628/14.361 | 云南 | 27.586/24.138 | 3.448/32.955 | 0.000/2.509 |
| 江苏 | 34.483/79.310 | 60.417/76.316 | 0.510/8.291 | 陕西 | 13.793/24.138 | 4.915/21.014 | 0.021/0.185 |
| 浙江 | 34.483/62.069 | 59.184/69.048 | 0.000/1.901 | 甘肃 | 20.690/41.379 | 3.448/25.893 | 0.123/8.987 |
| 安徽 | 17.241/20.690 | 50.877/52.727 | 2.648/0.679 | 青海 | 13.793/24.138 | 3.448/20.714 | 0.000/0.000 |
| 福建 | 24.138/58.621 | 4.700/52.727 | 0.369/8.807 | 宁夏 | 10.345/27.586 | 3.333/3.333 | 0.000/0.000 |
| 江西 | 24.138/24.138 | 4.708/53.704 | 0.811/12.469 | 新疆 | 10.345/27.586 | 3.333/3.333 | 0.000/0.000 |
| 山东 | 13.793/20.690 | 49.153/3.333 | 0.059/0.000 | 均值 | 27.816/34.253 | 25.173/37.170 | 1.174/4.138 |
| 河南 | 13.793/20.690 | 48.333/51.786 | 0.261/0.372 | — | — | — | — |
注:分子和分母分别表示2000年和2019年数据。 |
表4 空间关联网络板块间的溢出效应Table 4 Spillover effects between the blocks of spatial correlation network |
| 板块类型 | 2000年 | 2019年 | ||||||||
|---|---|---|---|---|---|---|---|---|---|---|
| 板块Ⅰ | 板块Ⅱ | 板块Ⅲ | 板块Ⅳ | 板块Ⅰ | 板块Ⅱ | 板块Ⅲ | 板块Ⅳ | |||
| 接收关系 | 板块内 | 3 | 0 | 6 | 7 | 2 | 0 | 14 | 9 | |
| 板块外 | 13 | 15 | 38 | 63 | 8 | 23 | 55 | 73 | ||
| 溢出关系 | 板块内 | 3 | 0 | 6 | 7 | 2 | 0 | 14 | 9 | |
| 板块外 | 74 | 32 | 13 | 10 | 61 | 60 | 11 | 27 | ||
| 期望内部关系比例/% | 6.897 | 10.345 | 37.931 | 34.483 | 6.897 | 10.345 | 34.483 | 37.931 | ||
| 实际内部关系比例/% | 3.900 | 0 | 31.579 | 41.176 | 3.175 | 0 | 56.000 | 25.000 | ||
表5 空间关联网络的影响因素回归结果Table 5 Regression results of influencing factors of spatial correlation network |
| 变量 | 2000年 | 2002年 | 2004年 | 2006年 | 2008年 | 2010年 | 2012年 | 2014年 | 2016年 | 2019年 |
|---|---|---|---|---|---|---|---|---|---|---|
| dis | 0.189*** (0.000) | 0.187*** (0.000) | 0.192*** (0.000) | 0.248*** (0.000) | 0.259*** (0.000) | 0.279*** (0.000) | 0.274*** (0.000) | 0.242*** (0.000) | 0.255*** (0.000) | 0.246*** (0.000) |
| pgdp | 0.393*** (0.000) | 0.390*** (0.000) | 0.419*** (0.000) | 0.526*** (0.000) | 0.527*** (0.000) | 0.537*** (0.000) | 0.510*** (0.000) | 0.484*** (0.000) | 0.522*** (0.000) | 0.573*** (0.000) |
| inds | 0.144** (0.016) | 0.123** (0.029) | 0.103** (0.041) | 0.011 (0.363) | 0.008 (0.420) | -0.014 (0.265) | 0.015 (0.304) | 0.026 (0.159) | -0.017 (0.306) | -0.122*** (0.005) |
| open | 0.048* (0.084) | 0.098** (0.017) | 0.079** (0.044) | 0.042 (0.136) | 0.013 (0.265) | 0.010 (0.378) | 0.026 (0.206) | 0.039* (0.096) | 0.056* (0.070) | 0.042* (0.090) |
| env | 0.009 (0.348) | -0.002 (0.510) | -0.013 (0.373) | -0.008 (0.429) | 0.001 (0.476) | -0.019 (0.175) | -0.046** (0.020) | -0.036** (0.022) | -0.011 (0.340) | -0.080*** (0.002) |
| gov | -0.014 (0.365) | -0.001 (0.542) | 0.030 (0.179) | 0.038* (0.088) | 0.022 (0.196) | -0.016 (0.214) | -0.031* (0.085) | -0.017 (0.229) | 0.011 (0.369) | -0.008 (0.421) |
| tech | 0.074** (0.046) | 0.026 (0.191) | 0.058* (0.066) | 0.066** (0.034) | 0.086*** (0.002) | 0.084*** (0.000) | 0.047** (0.027) | 0.051** (0.021) | 0.059*** (0.007) | 0.012 (0.374) |
| R2 | 0.289 | 0.311 | 0.321 | 0.357 | 0.340 | 0.347 | 0.335 | 0.319 | 0.345 | 0.313 |
| Adj-R2 | 0.285 | 0.306 | 0.317 | 0.352 | 0.336 | 0.343 | 0.330 | 0.317 | 0.340 | 0.309 |
注:变量的系数为标准化回归系数,*、**、***分别表示10%、5%、1%水平上显著,括号内数值表示显著性概率。 |
| [1] |
周亮, 车磊, 周成虎. 中国城市绿色发展效率时空演变特征及影响因素. 地理学报, 2019, 74(10): 2027-2044.
[
|
| [2] |
王圣云, 韩亚杰, 任慧敏, 等. 中国省域生态福利绩效评估及其驱动效应分解. 资源科学, 2020, 42(5): 840-855.
[
|
| [3] |
胡美娟, 李在军, 丁正山, 等. 基于三维福利的城市生态福利强度及驱动模式: 以长三角地区为例. 自然资源学报, 2021, 36(2): 327-341.
[
|
| [4] |
诸大建, 张帅. 生态福利绩效与深化可持续发展的研究. 同济大学学报: 社会科学版, 2014, 25(5): 106-115.
[
|
| [5] |
邓远建, 杨旭, 马强文, 等. 中国生态福利绩效水平的地区差距及收敛性. 中国人口·资源与环境, 2021, 31(4): 132-143.
[
|
| [6] |
刘华军, 贾文星. 中国区域经济增长的空间网络关联及收敛性检验. 地理科学, 2019, 39(5): 726-733.
[
|
| [7] |
|
| [8] |
诸大建. 生态经济学: 可持续发展的经济学和管理学. 中国科学院院刊, 2008, 23(6): 520-530.
[
|
| [9] |
诸大建. 超越增长: 可持续发展经济学如何不同于新古典经济学. 学术月刊, 2013, 45(10): 79-89.
[
|
| [10] |
诸大建, 张帅. 生态福利绩效及其与经济增长的关系研究. 中国人口·资源与环境, 2014, 24(9): 59-67.
[
|
| [11] |
|
| [12] |
|
| [13] |
臧漫丹, 诸大建, 刘国平. 生态福利绩效: 概念、内涵及G20实证. 中国人口·资源与环境, 2013, 23(5): 118-124.
[
|
| [14] |
冯吉芳, 袁健红. 中国区域生态福利绩效及其影响因素. 中国科技论坛, 2016, (3): 100-105.
[
|
| [15] |
|
| [16] |
|
| [17] |
|
| [18] |
亓朋, 艾洪山, 徐昱东, 等. 中国各地区生态福利绩效评价及贸易开放影响效应研究. 北京: 经济管理出版社, 2020.
[
|
| [19] |
|
| [20] |
肖黎明, 张仙鹏. 强可持续理念下绿色创新效率与生态福利绩效耦合协调的时空特征. 自然资源学报, 2019, 34(2): 312-324.
[
|
| [21] |
徐维祥, 徐志雄, 刘程军. 黄河流域地级城市土地集约利用效率与生态福利绩效的耦合性分析. 自然资源学报, 2021, 36(1): 114-130.
[
|
| [22] |
龙亮军, 王霞, 郭兵. 生态福利绩效视角下的上海市可持续发展评价研究. 长江流域资源与环境, 2016, 25(1): 9-15.
[
|
| [23] |
龙亮军, 王霞, 郭兵. 基于改进DEA模型的城市生态福利绩效评价研究: 以我国35个大中城市为例. 自然资源学报, 2017, 32(4): 595-605.
[
|
| [24] |
臧漫丹, 娄子孟, 孔嘉婧. 中国省际水资源福利绩效时空分异分析. 长江流域资源与环境, 2019, 28(4): 805-816.
[
|
| [25] |
|
| [26] |
|
| [27] |
|
| [28] |
龙亮军. 基于两阶段Super-NSBM模型的城市生态福利绩效评价研究. 中国人口·资源与环境, 2019, 29(7): 1-10.
[
|
| [29] |
|
| [30] |
|
| [31] |
林木西, 耿蕊, 李国柱. 省域生态福利绩效水平的空间非均衡性研究: 基于MLD指数与分布动态学模型. 东岳论丛, 2019, 40(10): 73-83.
[
|
| [32] |
胡美娟. 综合福利视角下城市生态福利绩效演化过程、机制与路径优化. 南京: 南京师范大学, 2020.
[
|
| [33] |
|
| [34] |
|
| [35] |
孟雪, 狄乾斌, 季建文. 京津冀城市群生态绩效水平测度及影响因素. 经济地理, 2020, 40(1): 181-186.
[
|
| [36] |
李成宇, 张士强, 张伟, 等. 中国省际生态福利绩效测算及影响因素研究. 地理科学, 2019, 39(12): 1875-1883.
[
|
| [37] |
邓远建, 杨旭, 陈光炬, 等. 中国生态福利绩效水平的空间非均衡及动态演进. 中国地质大学学报: 社会科学版, 2020, 20(4): 115-127.
[
|
| [38] |
|
| [39] |
杜慧彬, 黄立军, 张辰, 等. 中国省级生态福利绩效区域差异性分解和收敛性研究. 生态经济, 2019, 35(3): 187-193.
[
|
| [40] |
|
| [41] |
郭炳南, 王宇, 姜彦彦, 等. 技术进步偏向对中国生态福利绩效的影响. 经济论坛, 2021, (6): 59-71.
[
|
| [42] |
方时姣, 肖权. 中国区域生态福利绩效水平及其空间效应研究. 中国人口·资源与环境, 2019, 29(3): 1-10.
[
|
| [43] |
|
| [44] |
肖黎明, 肖沁霖. 黄河流域城市生态福利绩效格局分异及空间收敛分析. 软科学, 2021, 35(2): 46-53.
[
|
| [45] |
郭炳南, 唐利, 张浩. 环境规制与长江经济带生态福利绩效的空间效应研究. 经济体制改革, 2021, (3): 73-79.
[
|
| [46] |
王喜平, 罗金芳. 京津冀生态福利绩效及时空演变研究. 科技管理研究, 2020, 40(21): 249-255.
[
|
| [47] |
|
| [48] |
赵林, 刘焱序, 曹乃刚, 等. 中国包容性绿色效率时空格局与溢出效应分析. 地理科学进展, 2021, 40(3): 382-396.
[
|
| [49] |
王兆峰, 刘庆芳. 中国省域旅游效率空间网络结构演化及其影响因素. 地理科学, 2021, 41(3): 397-406.
[
|
| [50] |
陈清怡, 千庆兰, 姚作林. 广东省城市创新发展水平及其网络结构演化. 经济地理, 2021, 41(4): 38-47.
[
|
| [51] |
孙才志, 马奇飞. 中国省际水资源绿色效率空间关联网络研究. 地理研究, 2020, 39(1): 53-63.
[
|
| [52] |
刘军. 整体网分析:UCINET 软件实用指南(第二版). 上海: 格致出版社, 2014.
[
|
| [53] |
联合国开发计划署. 中国人类发展报告 (2013). 北京: 中国对外翻译出版公司, 2013.
[ UNDP. China Human Development Report 2013. Beijing: China Translation & Publishing Corporation, 2013.]
|
/
| 〈 |
|
〉 |