
JOURNAL OF NATURAL RESOURCES >
The relationship between China's provincial carbon balance capacity and urbanization under carbon neutrality target
Received date: 2021-11-05
Revised date: 2022-04-04
Online published: 2022-12-28
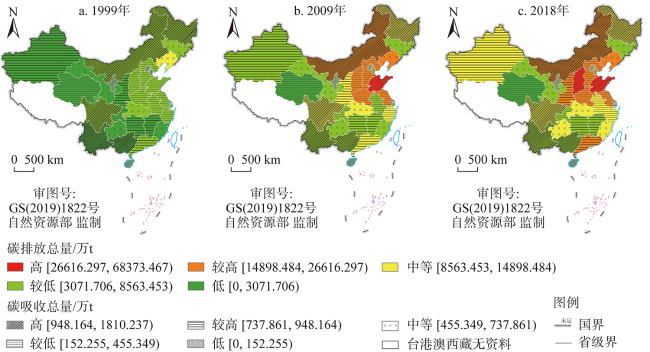
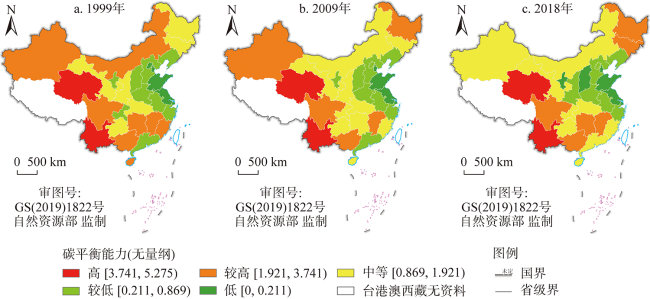
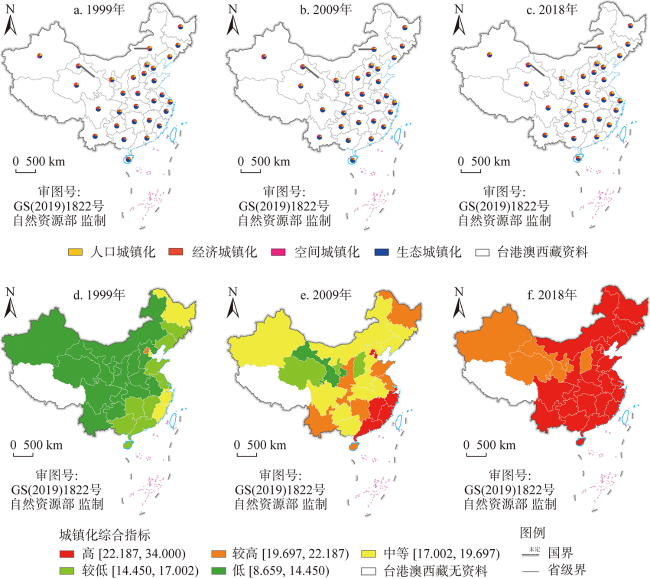
It has great theoretical value and practical significance to clarify the relationship between carbon balance capacity and urbanization for realizing the carbon neutrality target and the development of new urbanization. The greenhouse gas inventory method, carbon absorption inventory method, carbon balance index method and multiple urbanization measurement method were used to calculate the carbon balance capacity and urbanization indicators of various types of China's provincial-level regions from 1999 to 2018 respectively. The spatial natural breakpoint classification method and Granger causality test were used to analyze the spatio-temporal evolution and interaction between China's provincial carbon balance capacity and urbanization. Furthermore, the development paths of new urbanization in different types of regions were discussed. Main conclusions are as follows: Firstly, China's provincial carbon emissions continue to increase, carbon absorption continue to decline and carbon balance capacity showed four trends, namely, increasing, decreasing, decreasing first and then increasing, and increasing first and then decreasing. The spatial distribution of carbon emissions presented a pattern of "more in the east and less in the west", and the spatial distributions of carbon absorption and carbon balance capacity were "more in the west and less in the east" and "stronger in the west and weaker in the east", respectively. Secondly, the population, economy, space, ecological urbanization and urbanization comprehensive indexes of China's provinces were increasing continuously. In addition, the spatial urbanization showed a pattern of "high in the west and low in the east", while the other types of urbanization showed "high in the east and low in the west" distribution. Thirdly, except for spatial urbanization, the relationship between carbon balance capacity and various types of urbanization was feedback type, and the provincial growth and protection type was the most, followed by the reduction and destruction type, and the neutral type was the least. The development path of China's new urbanization can be divided into four types: growth and protection type, destruction and reduction type, feedback type and neutral type. Improving regional carbon balance capacity and enhancing the development path of new urbanization had important theoretical and practical significance for realizing regional sustainable development targets. Regional differences in population, economic, social and ecological development had an influence on the realization of "dual carbon" and new urbanization goals. Therefore, in designing carbon reduction action plans, regional differences should be considered to identify carbon reduction levels and adopt differentiated measures to form carbon reduction networks.
LI Zhu , WANG Zhao-feng , WU Wei , SHAO Hai-qin . The relationship between China's provincial carbon balance capacity and urbanization under carbon neutrality target[J]. JOURNAL OF NATURAL RESOURCES, 2022 , 37(12) : 3136 -3152 . DOI: 10.31497/zrzyxb.20221208
表1 城镇化发展指标体系Table 1 Urbanization development indicators system |
| 目标层 | 准则层(权重) | 指标(权重) | 代码(方向) |
|---|---|---|---|
| 城镇化综合指标C | Z1人口城镇化(0.139) | 城镇人口占比/%(0.033) | X1+ |
| 非农从业人员占比/%(0.105) | X2+ | ||
| Z2经济城镇化(0.558) | 人均GDP/万元(0.139) | X3+ | |
| 二产业产值占比/%(0.020) | X4+ | ||
| 三产业产值占比/%(0.071) | X5+ | ||
| 人均社会消费品零售额/万元(0.155) | X6+ | ||
| 人均社会固定资产投资额/万元(0.173) | X7+ | ||
| Z3空间城镇化(0.073) | 建成区面积占土地面积占比/%(0.073) | X8 + | |
| Z4生态城镇化(0.230) | 建成区绿化覆盖率/%(0.013) | X9+ | |
| 人均公园绿地面积/m2(0.043) | X10 + | ||
| 森林覆盖率/%(0.090) | X11+ | ||
| 工业固体废物综合利用率/%(0.040) | X12+ | ||
| 生活垃圾无害化处理率/%(0.043) | X13+ |
表2 1999—2018年中国省域碳平衡能力计算结果Table 2 Calculation results of provincial carbon balance capacity in China from 1999 to 2018 |
| 省级 | 年份 | 省级 | 年份 | 省级 | 年份 | ||||||
|---|---|---|---|---|---|---|---|---|---|---|---|
| 1999 | 2009 | 2018 | 1999 | 2009 | 2018 | 1999 | 2009 | 2018 | |||
| 上海↑ | 0.017 | 0.031 | 0.042 | 安徽∩ | 0.636 | 0.742 | 0.652 | 湖北↑ | 0.945 | 1.298 | 1.625 |
| 天津↑ | 0.053 | 0.063 | 0.076 | 浙江∪ | 0.690 | 0.638 | 0.730 | 甘肃↑ | 1.243 | 1.741 | 1.908 |
| 山东↓ | 0.201 | 0.153 | 0.135 | 陕西↓ | 1.854 | 1.481 | 0.810 | 湖南∪ | 2.018 | 1.832 | 2.474 |
| 山西↓ | 0.321 | 0.245 | 0.131 | 广东↑ | 0.790 | 0.842 | 0.892 | 吉林↑ | 1.255 | 1.681 | 2.490 |
| 江苏∪ | 0.153 | 0.150 | 0.160 | 海南↓ | 2.294 | 1.341 | 1.336 | 江西∪ | 2.899 | 2.255 | 2.767 |
| 宁夏↓ | 0.393 | 0.260 | 0.211 | 新疆∩ | 1.941 | 1.954 | 1.412 | 广西∪ | 3.554 | 3.088 | 3.210 |
| 北京↑ | 0.141 | 0.259 | 0.431 | 贵州∪ | 1.769 | 1.350 | 1.429 | 黑龙江↑ | 1.779 | 2.807 | 3.379 |
| 河北↑ | 0.328 | 0.343 | 0.447 | 重庆↑ | 0.728 | 0.960 | 1.473 | 四川↑ | 2.594 | 2.748 | 3.710 |
| 河南∪ | 0.469 | 0.332 | 0.461 | 福建↓ | 2.139 | 1.611 | 1.586 | 青海∪ | 4.571 | 4.346 | 4.375 |
| 辽宁↑ | 0.265 | 0.367 | 0.500 | 内蒙古↓ | 2.772 | 1.665 | 1.539 | 云南∪ | 4.580 | 3.772 | 5.274 |
注:符号“↑”“↓”“∪”和“∩”为各省域碳平衡能力变化趋势。表格数据呈“左小右大”顺序。因篇幅有限,仅展示1999年、2009年和2018年结果。 |
表3 面板单位根检验结果Table 3 Results of unit root test |
| 变量 | ESC | Z1 | Z2 | Z3 | Z4 | C |
|---|---|---|---|---|---|---|
| LLC检验 | -2.995 (0.001) | -2.120 (0.017) | -3.843 (0.000) | -3.208 (0.000) | -4.253 (0.000) | -2.821 (0.002) |
| Fisher-ADF检验Z值 | -7.155 (0.000) | -5.187 (0.000) | -8.880 (0.000) | -6.786 (0.000) | -8.107 (0.000) | -7.552 (0.000) |
| 检验结果 | 平稳 | 平稳 | 平稳 | 平稳 | 平稳 | 平稳 |
注:括号里的数值是显著性P值。 |
表4 碳平衡能力与人口城镇化的Granger因果检验Table 4 Granger cause and effect test of carbon balance capacity and population urbanization |
| 截面单位 | ESC→Z1 | Z1→ESC | 因果类型 | 截面单位 | ESC→Z1 | Z1→ESC | 因果类型 | 截面单位 | ESC→Z1 | Z1→ESC | 因果类型 |
|---|---|---|---|---|---|---|---|---|---|---|---|
| 中国 | 2.808*** | 6.354*** | 反馈 | 安徽 | 0.179 | -0.121** | 减少 | 甘肃 | 0.257** | 0.113 | 保护 |
| 上海 | 0.182* | -0.240 | 保护 | 浙江 | 0.487*** | 0.077*** | 反馈 | 湖南 | -0.310* | 0.238*** | 反馈 |
| 天津 | 0.487** | 0.414* | 反馈 | 陕西 | -0.334*** | -0.833*** | 反馈 | 吉林 | 0.027 | 0.470** | 增长 |
| 山东 | -0.093 | -0.046 | 中立 | 广东 | 0.205 | 0.218*** | 增长 | 江西 | 0.140 | 0.049 | 中立 |
| 山西 | 0.016 | -1.351*** | 减少 | 海南 | 0.006 | -0.965*** | 减少 | 广西 | -0.041 | -0.0002 | 中立 |
| 江苏 | 0.022 | 0.167*** | 增长 | 新疆 | -0.236 | -0.346*** | 减少 | 黑龙江 | 0.018 | 0.880** | 增长 |
| 宁夏 | -0.109 | -0.326* | 减少 | 贵州 | -0.357** | -0.041 | 破坏 | 四川 | -0.259 | 0.152*** | 增长 |
| 北京 | 0.011 | 1.760*** | 增长 | 重庆 | 0.024 | 0.250*** | 增长 | 青海 | -0.020 | -0.234 | 中立 |
| 河北 | 0.076 | 0.271*** | 增长 | 福建 | -0.109** | -0.038 | 破坏 | 云南 | -0.028 | 0.025 | 中立 |
| 河南 | -0.110*** | 0.210*** | 反馈 | 内蒙古 | -0.155*** | 0.068 | 破坏 | ||||
| 辽宁 | -0.020 | 0.706** | 增长 | 湖北 | -0.001 | 0.290** | 增长 |
注:*表示在10%水平下显著,**表示在5%水平下显著,***表示在1%水平下显著,下同。 |
表5 碳平衡能力与经济城镇化的Granger因果检验Table 5 Granger cause and effect test of carbon balance capacity and economic urbanization |
| 截面单位 | ESC→Z2 | Z2→ESC | 因果类型 | 截面单位 | ESC→Z2 | Z2→ESC | 因果类型 | 截面单位 | ESC→Z2 | Z2→ESC | 因果类型 |
|---|---|---|---|---|---|---|---|---|---|---|---|
| 中国 | 7.318*** | 7.689*** | 反馈 | 安徽 | -0.205*** | -0.177 | 破坏 | 甘肃 | 0.182 | -0.022 | 中立 |
| 上海 | 0.071 | -0.287 | 中立 | 浙江 | 0.070*** | 0.142*** | 反馈 | 湖南 | -0.002 | 0.491*** | 增长 |
| 天津 | 0.561*** | 0.437*** | 反馈 | 陕西 | -0.121** | -1.871*** | 反馈 | 吉林 | 0.145** | 0.484** | 反馈 |
| 山东 | -0.031 | -0.066 | 中立 | 广东 | 0.410*** | 0.449*** | 反馈 | 江西 | -0.163* | 0.199 | 破坏 |
| 山西 | -0.093*** | -0.682 | 破坏 | 海南 | -0.091*** | -0.931** | 反馈 | 广西 | -0.064 | 0.006 | 中立 |
| 江苏 | -0.226 | 0.266*** | 增长 | 新疆 | 0.058 | -0.425*** | 减少 | 黑龙江 | 0.087** | 0.244 | 保护 |
| 宁夏 | -0.117* | -0.355 | 破坏 | 贵州 | -0.157* | -0.262 | 破坏 | 四川 | 0.098 | 0.438*** | 增长 |
| 北京 | -0.069*** | 3.571*** | 反馈 | 重庆 | -0.033 | 0.737*** | 增长 | 青海 | -0.082*** | 0.015 | 破坏 |
| 河北 | 0.004 | 0.637*** | 增长 | 福建 | -0071*** | -0.063 | 破坏 | 云南 | 0.070*** | 0.170 | 保护 |
| 河南 | -0.058 | 0.295*** | 增长 | 内蒙古 | -0.151** | -0.166 | 破坏 | ||||
| 辽宁 | 0.105 | 0.565* | 增长 | 湖北 | 0.066 | 0.389** | 增长 |
表6 碳平衡能力与空间城镇化的Granger因果检验Table 6 Granger cause and effect test of carbon balance capacity and spatial urbanization |
| 截面单位 | ESC→Z3 | Z3→ESC | 因果类型 | 截面单位 | ESC→Z3 | Z3→ESC | 因果类型 | 截面单位 | ESC→Z3 | Z3→ESC | 因果类型 |
|---|---|---|---|---|---|---|---|---|---|---|---|
| 中国 | -0.251 | 6.576*** | 增长 | 安徽 | 0.082 | -0.137*** | 减少 | 甘肃 | 0.246 | 0.495*** | 增长 |
| 上海 | 0.190 | 0.116 | 中立 | 浙江 | -0.028 | 0.074*** | 增长 | 湖南 | 0.063 | 0.232 | 中立 |
| 天津 | 0.365 | 0.394** | 增长 | 陕西 | 0.051 | -0.789** | 减少 | 吉林 | -0.379 | 0.158*** | 增长 |
| 山东 | -0.046 | -0.006 | 中立 | 广东 | -0.097 | 0.154*** | 增长 | 江西 | 0.033 | 0.085 | 中立 |
| 山西 | -0.016 | -0.910** | 减少 | 海南 | 0.015 | -1.580*** | 减少 | 广西 | -0.036 | -0.009 | 中立 |
| 江苏 | -0.121 | 0.028 | 中立 | 新疆 | 0.380*** | -0.079 | 保护 | 黑龙江 | 0.142 | 0.349** | 增长 |
| 宁夏 | -0.096 | -0.224** | 减少 | 贵州 | -0.324 | -0.212 | 中立 | 四川 | 0.494 | 0.112 | 中立 |
| 北京 | -0.060 | 0.387 | 中立 | 重庆 | -0.011 | 0.209*** | 增长 | 青海 | -0.049 | -0.132 | 中立 |
| 河北 | 0.246** | 0.186** | 反馈 | 福建 | -0.179 | -0.052 | 中立 | 云南 | 0.046 | -0.055 | 中立 |
| 河南 | 0.036 | 0.189 | 中立 | 内蒙古 | -0.348** | -0.028 | 破坏 | ||||
| 辽宁 | 0.055 | 0.111 | 中立 | 湖北 | -0.217 | 0.229* | 增长 |
表7 碳平衡能力与生态城镇化的Granger因果检验Table 7 Granger cause and effect test of carbon balance capacity and ecological urbanization |
| 截面单位 | ESC→Z4 | Z4→ESC | 因果类型 | 截面单位 | ESC→Z4 | Z4→ESC | 因果类型 | 截面单位 | ESC→Z4 | Z4→ESC | 因果类型 |
|---|---|---|---|---|---|---|---|---|---|---|---|
| 中国 | 2.795*** | 8.760*** | 反馈 | 安徽 | 0.384*** | -0.200*** | 反馈 | 甘肃 | 0.618** | 0.030 | 保护 |
| 上海 | 0.344** | 0.022 | 保护 | 浙江 | -0.006 | 0.404*** | 增长 | 湖南 | 0.067 | 0.635*** | 增长 |
| 天津 | 0.443*** | 0.582** | 反馈 | 陕西 | 0.155 | -0.805** | 减少 | 吉林 | 0.233 | 0.323 | 中立 |
| 山东 | -0.046 | -0.005 | 中立 | 广东 | 0.079 | 0.405*** | 增长 | 江西 | -0.260*** | 0.152 | 破坏 |
| 山西 | 0.094 | -0.375** | 减少 | 海南 | 0.038 | -2.082*** | 减少 | 广西 | -0.289*** | 0.087 | 破坏 |
| 江苏 | -0.073 | 0.703*** | 增长 | 新疆 | -0.086 | -0.139** | 减少 | 黑龙江 | 0.074 | 0.426 | 中立 |
| 宁夏 | -0.147 | -0.283*** | 减少 | 贵州 | -0.249* | -0.176 | 破坏 | 四川 | -0.012 | 0.216** | 增长 |
| 北京 | -0.018 | 2.197*** | 增长 | 重庆 | 0.287*** | 0.288*** | 反馈 | 青海 | -0.031 | -0.194 | 中立 |
| 河北 | 0.272** | 0.224*** | 反馈 | 福建 | -0.298** | -0.298* | 反馈 | 云南 | -0.039 | 0.116 | 中立 |
| 河南 | -0.171* | 0.379*** | 反馈 | 内蒙古 | 0.045 | -0.390** | 减少 | ||||
| 辽宁 | -0.004 | 0.856*** | 增长 | 湖北 | -0.053 | 0.491** | 增长 |
表8 碳平衡能力与城镇化综合指标的Granger因果检验Table 8 Granger cause and effect test of carbon balance capacity and urbanization comprehensive indicator |
| 截面单位 | ESC→C | C→ESC | 因果类型 | 截面单位 | ESC→C | C→ESC | 因果类型 | 截面单位 | ESC→C | C→ESC | 因果类型 |
|---|---|---|---|---|---|---|---|---|---|---|---|
| 中国 | 2.890*** | 11.243*** | 反馈 | 安徽 | 0.182*** | -0.180** | 反馈 | 甘肃 | 0.284*** | 0.123 | 保护 |
| 上海 | 0.231*** | -0.215 | 保护 | 浙江 | 0.082** | 0.178*** | 反馈 | 湖南 | 0.009 | 0.516*** | 增长 |
| 天津 | 0.381*** | 0.554*** | 反馈 | 陕西 | -0.053 | -1.290*** | 减少 | 吉林 | -0.236** | 0.733*** | 反馈 |
| 山东 | -0.033 | -0.060 | 中立 | 广东 | 0.046 | 0.374*** | 增长 | 江西 | -0.111** | 0.133 | 破坏 |
| 山西 | 0.033 | -0.712*** | 减少 | 海南 | 0.015 | -1.760*** | 减少 | 广西 | -0.191*** | 0.038 | 破坏 |
| 江苏 | -0.053 | 0.328*** | 增长 | 新疆 | 0.052 | -0.250*** | 减少 | 黑龙江 | 0.057 | 0.442* | 增长 |
| 宁夏 | -0.092 | -0.420*** | 减少 | 贵州 | -0.177* | -0.204 | 破坏 | 四川 | -0.054 | 0.196** | 增长 |
| 北京 | -0.039** | 2.705*** | 反馈 | 重庆 | 0.144** | 0.341*** | 反馈 | 青海 | -0.024 | -0.171 | 中立 |
| 河北 | 0.175** | 0.294*** | 反馈 | 福建 | -0.097 | -0.117 | 中立 | 云南 | -0.001 | 0.068 | 中立 |
| 河南 | -0.043 | 0.324*** | 增长 | 内蒙古 | -0.112* | -0.250 | 破坏 | ||||
| 辽宁 | -0.080 | 1.478*** | 增长 | 湖北 | -0.122 | 0.460** | 增长 |
| [1] |
习近平. 继往开来,开启全球应对气候变化新征程: 在气候雄心峰会上的讲话. 北京: 人民日报, 2020-12-13(2).
[
|
| [2] |
陆大道, 陈明星. 关于“国家新型城镇化规划(2014—2020)”编制大背景的几点认识. 地理学报, 2015, 70(2): 179-185.
[
|
| [3] |
王鑫静, 程钰. 城镇化对碳排放效率的影响机制研究: 基于全球118个国家面板数据的实证分析. 世界地理研究, 2020, 29(3): 503-511.
[
|
| [4] |
王锋, 秦豫徽, 刘娟, 等. 多维度城镇化视角下的碳排放影响因素研究: 基于中国省域数据的空间杜宾面板模型. 中国人口·资源与环境, 2017, 27(9): 151-161.
[
|
| [5] |
王磊, 郭灿, 李慧明. 天津城市系统碳通量与碳平衡测度研究. 干旱区资源与环境, 2016, 30(11): 30-36.
[
|
| [6] |
郭海湘, 杨钰莹, 左芝鲤. 中国城市群碳平衡仿真模拟研究. 中国地质大学学报: 社会科学版, 2018, 18(2): 114-125.
[
|
| [7] |
余光英, 员开奇. 基于碳平衡适宜性评价的城市圈土地利用结构优化. 水土保持研究, 2014, 21(5): 179-184, 192.
[
|
| [8] |
|
| [9] |
胡剑波, 王青松. 基于碳平衡的民族地区生态补偿量化研究. 广西民族研究, 2019, 35(6): 145-154.
[
|
| [10] |
|
| [11] |
葛汝冰, 吝涛, 刘晓芳, 等. 基于城市功能分区的碳收支平衡时空分异研究. 气候变化研究进展, 2016, 12(2): 101-111.
[
|
| [12] |
|
| [13] |
王渊刚, 罗格平, 赵树斌, 等. 新疆耕地变化对区域碳平衡的影响. 地理学报, 2014, 69(1): 110-120.
[
|
| [14] |
程分生, 尤龙辉, 叶功富, 等. 亚热带红壤侵蚀区马尾松不同套种模式生态系统碳平衡. 应用生态学报, 2021, 32(4): 1163-1174.
[
|
| [15] |
|
| [16] |
岳冬冬, 王鲁民, 方海, 等. 基于碳平衡的中国海洋渔业产业发展对策探析. 中国农业科技导报, 2016, 18(4): 1-8.
[
|
| [17] |
赵荣钦, 张帅, 黄贤金, 等. 中原经济区县域碳收支空间分异及碳平衡分区. 地理学报, 2014, 69(10): 1425-1437.
[
|
| [18] |
李璐, 董捷, 徐磊, 等. 功能区土地利用碳收支空间分异及碳补偿分区: 以武汉城市圈为例. 自然资源学报, 2019, 34(5): 1003-1015.
[
|
| [19] |
黄华, 蔡克光, 邢谷锐. 基于碳平衡视角的广东省城市低碳发展特征及对策研究. 城市发展研究, 2015, 22(11): 12-18.
[
|
| [20] |
彭文英, 马思瀛, 张丽亚, 等. 基于碳平衡的城乡生态补偿长效机制研究: 以北京市为例. 生态经济, 2016, 32(9): 162-166.
[
|
| [21] |
沈杨, 汪聪聪, 高超, 等. 基于城市化的浙江省湾区经济带碳排放时空分布特征及影响因素分析. 自然资源学报, 2020, 35(2): 329-342.
[
|
| [22] |
|
| [23] |
国家统计局. 中国统计年鉴. 北京: 中国统计出版社, 2000—2019.
[ National Bureau of Statistics. China Statistical Yearbook. Beijing: China Statistics Press, 2000—2019.]
|
| [24] |
国家统计局. 中国能源统计年鉴. 北京: 中国统计出版社, 2000—2019.
[ National Bureau of Statistics. China Energy Statistical Yearbook. Beijing: China Statistics Press, 2000—2019.]
|
| [25] |
付超, 于贵瑞, 方华军, 等. 中国区域土地利用/覆被变化对陆地碳收支的影响. 地理科学进展, 2012, 31(1): 88-96.
[
|
| [26] |
鲁丰先, 张艳, 秦耀辰, 等. 中国省级区域碳源汇空间格局研究. 地理科学进展, 2013, 32(12): 1751-1759.
[
|
| [27] |
陶波, 葛全胜, 李克让, 等. 陆地生态系统碳循环研究进展. 地理研究, 2001, 20(5): 564-575.
[
|
| [28] |
义白璐, 韩骥, 周翔, 等. 区域碳源碳汇的时空格局: 以长三角地区为例. 应用生态学报, 2015, 26(4): 973-980.
[
|
| [29] |
刘英, 赵荣钦, 焦士兴. 河南省土地利用碳源/汇及其变化分析. 水土保持研究, 2010, 17(5): 154-157, 162.
[
|
| [30] |
王子超, 熊灵, 王子岚. 陆地边疆省份旅游发展与经济增长的互动效应研究: 基于面板数据的Granger因果检验. 中国软科学, 2016, 31(12): 172-181.
[
|
| [31] |
刘晓婷, 陈闻君. 基于ESDA-GIS的新疆能源碳排放空间差异动态演化分析. 干旱区地理, 2016, 39(3): 678-685.
[
|
| [32] |
范建双, 虞晓芬, 周琳. 南京市土地利用结构碳排放效率增长及其空间相关性. 地理研究, 2018, 37(11): 2177-2192.
[
|
| [33] |
IPCC. IPCC Guidelines for National Green Gas Inventories: Volume Ⅱ. Japan: IGES. http://www.ipcc.eh/ipccreports/Methodology-reports.htm 2006-07-01.
|
| [34] |
王刚, 张华兵, 薛菲, 等. 成都市县域土地利用碳收支与经济发展关系研究. 自然资源学报, 2017, 32(7): 1170-1182.
[
|
| [35] |
卢俊宇, 黄贤金, 戴靓, 等. 基于时空尺度的中国省级区域能源消费碳排放公平性分析. 自然资源学报, 2012, 27(12): 2006-2017.
[
|
| [36] |
尹鹏, 王富喜, 段佩利. 中国基本公共服务效率与城镇化质量的时空耦合关系研究. 地理科学, 2021, 41(4): 571-579.
[
|
| [37] |
|
| [38] |
杜强, 陈乔, 杨锐. 基于Logistic模型的中国各省碳排放预测. 长江流域资源与环境, 2013, 22(2): 143-151.
[
|
| [39] |
王怡睿, 黄煌, 石培基. 中国城镇化质量时空演变研究. 经济地理, 2017, 37(1): 90-97.
[
|
/
| 〈 |
|
〉 |