
JOURNAL OF NATURAL RESOURCES >
Quantifying food waste from photos: Taking Beijing typical cafeterias as an example
Received date: 2022-03-28
Revised date: 2022-06-28
Online published: 2022-12-28
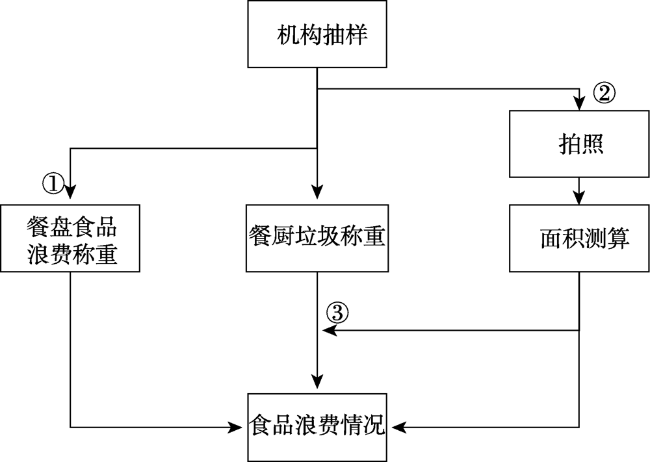
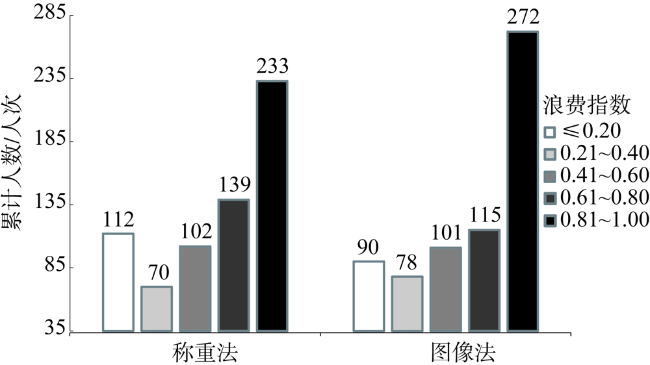
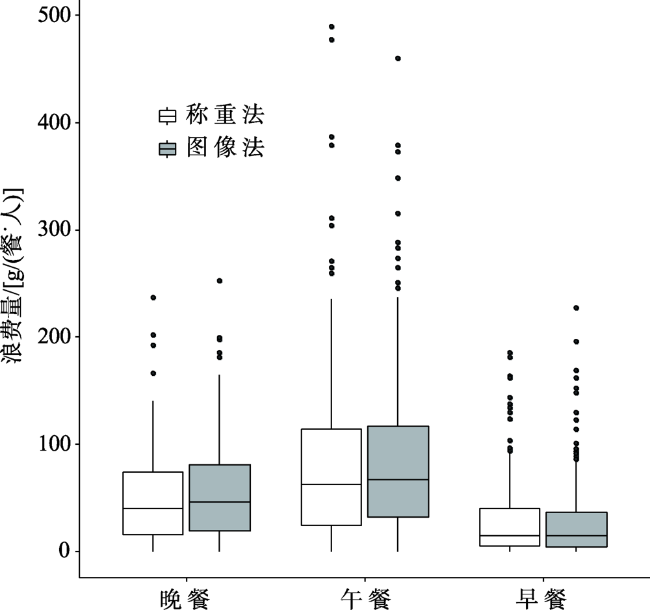
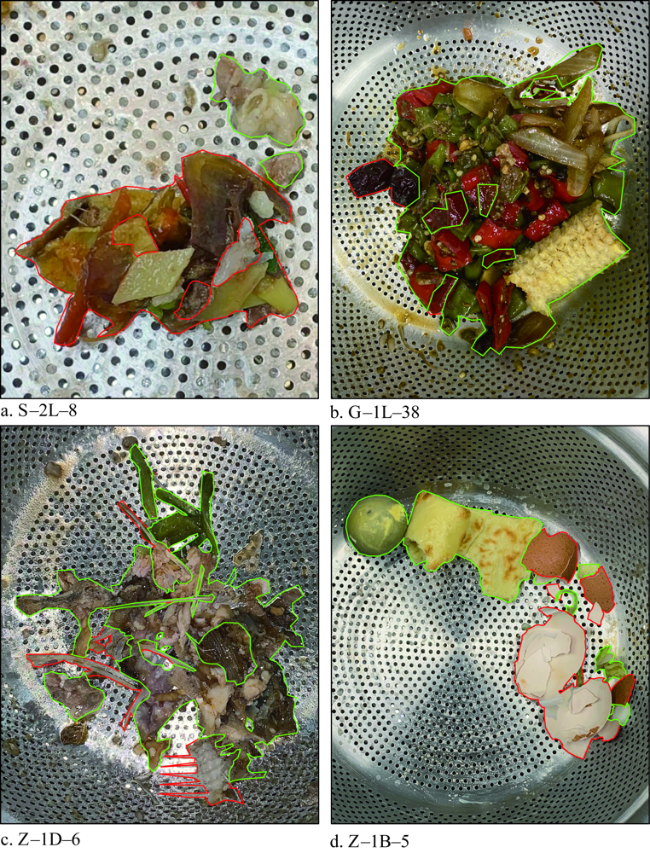
The Anti-food Waste Law of the People's Republic of China was issued and came into force on April 29, 2021. Monitoring and evaluation of food waste is the major part and the important basis for the implementation of the Law. Based on the principles and requirements of the Anti-food Waste Law, this study proposes a new quantification method from photos for food waste, and tests the validity and the feasibility based on 656 observations from four typical cafeterias in Beijing. The main conclusions of this study are as follows: (1) Based on the image method, the food waste index in the typical cafeterias was 0.64, 0.02 lower than that obtained by weight method, and the average plate waste generated by consumers in the typical cafeterias was 58.62 g/cap/meal in 2021, which was 2.40 g/cap/meal higher than that obtained by the weight method. (2) There is a significant correlation between the food waste rate obtained by the image method and that obtained by the weight method (Pearson cor=0.76, p<0.01), and the agreement between two sets of measurements has a good consistency (CCC=0.757, p<0.01), which confirmed the validity and the feasibility of the image method. (3) When using the image method to carry out monitoring and evaluation, we find that the results that include kitchen waste weight data are more reliable. This study explores a scientific, reliable, simple and feasible quantitative monitoring and evaluation method of food waste, and provides effective scientific and technological support for the enforcement of Anti-food Waste Law.
Key words: image method; monitoring and investigation; food waste; Beijing; typical cafeterias
ZHANG Dan , WU Liang . Quantifying food waste from photos: Taking Beijing typical cafeterias as an example[J]. JOURNAL OF NATURAL RESOURCES, 2022 , 37(10) : 2572 -2582 . DOI: 10.31497/zrzyxb.20221008
表1 样本食堂特征Table 1 Characteristics of selected cafeterias |
| 样本食堂 | 样本人数/人 | 就餐形式 | 就餐单位数量/家 | 是否外包经营 | 调研日就餐人数/人 |
|---|---|---|---|---|---|
| 食堂1 | 166 | 自助餐 | 1 | 否 | 1008 |
| 食堂2 | 160 | 自助餐 | 3 | 是 | 798 |
| 食堂3 | 164 | 自助餐 | 1 | 否 | 761 |
| 食堂4 | 166 | 自助餐 | 8 | 是 | 1689 |
表2 两种方法食品浪费总量对比Table 2 Comparison of total food waste obtained by two methods |
| 项目 | 食堂浪费指数 | 食堂每日浪费量/(kg/天) | |||||
|---|---|---|---|---|---|---|---|
| 图像法 | 排序 | 称重法 | 排序 | 图像法 | 称重法 | ||
| 食堂1 | 0.73 | 2 | 0.77 | 1 | 63.88 | 68.95 | |
| 食堂2 | 0.84 | 1 | 0.66 | 2 | 54.16 | 46.84 | |
| 食堂3 | 0.63 | 4 | 0.49 | 4 | 23.61 | 19.99 | |
| 食堂4 | 0.70 | 3 | 0.66 | 3 | 136.23 | 133.12 | |
| [1] |
|
| [2] |
|
| [3] |
|
| [4] |
张丹, 成升魁, 高利伟, 等. 城市餐饮业食物浪费的生态足迹: 以北京市为例. 资源科学, 2016, 38(1): 10-18.
[
|
| [5] |
张丹, 伦飞, 成升魁, 等. 城市餐饮食物浪费的磷足迹及其环境排放: 以北京市为例. 自然资源学报, 2016, 31(5): 812-821.
[
|
| [6] |
|
| [7] |
|
| [8] |
|
| [9] |
|
| [10] |
|
| [11] |
|
| [12] |
|
| [13] |
|
| [14] |
|
| [15] |
|
| [16] |
张丹, 成升魁, 高利伟, 等. 城市餐饮业食物浪费碳足迹: 以北京市为例. 生态学报, 2016, 36(18): 5937-5948.
[
|
| [17] |
|
| [18] |
United Nations Environment Programme. Food Waste Index Report 2021. Nairobi. https://wedocs.unep.org/bitstream/handle/20.500.11822/35280/FoodWaste.pdf?sequence=3&isAllowed=y. 2021-12-12].
|
| [19] |
高利伟, 成升魁, 曹晓昌, 等. 食物损失和浪费研究综述及展望. 自然资源学报, 2015, 30(3): 523-536.
[
|
| [20] |
|
| [21] |
|
| [22] |
何丽. 膳食调查方法的特点与应用. 国外医学: 卫生学分册, 2003, (6): 368-371.
[
|
| [23] |
|
| [24] |
|
| [25] |
北京市城市管理委员会. 关于加强本市非居民厨余垃圾计量收费管理工作的通知. http://www.beijing.gov.cn/zhengce/zhengcefagui/202109/t20210901_2481900.html 2021-09-01].
[Beijing Municipal Commission of Urban Management. Notice on strengthening the administration of metering and charging of Municipal Non-resident kitchen Waste. http://www.beijing.gov.cn/zhengce/zhengcefagui/202109/t20210901_2481900.html 2021-09-01].]
|
| [26] |
|
| [27] |
|
| [28] |
|
| [29] |
杨月欣. 中国食物成分表标准版(第六版/第一册). 北京: 北京大学医学出版社, 2018:VI-VII.
[
|
| [30] |
闵巍庆, 刘林虎, 刘宇昕, 等. 食品图像识别方法综述. 计算机学报, 2022, 45(3): 542-566.
[
|
/
| 〈 |
|
〉 |
