
JOURNAL OF NATURAL RESOURCES >
Water-saving technology, rebound effect of irrigation water consumption and regional heterogeneity in North China Plain: Based on Malmquist and LMDI Index analysis
Received date: 2021-06-07
Revised date: 2021-09-26
Online published: 2022-10-28
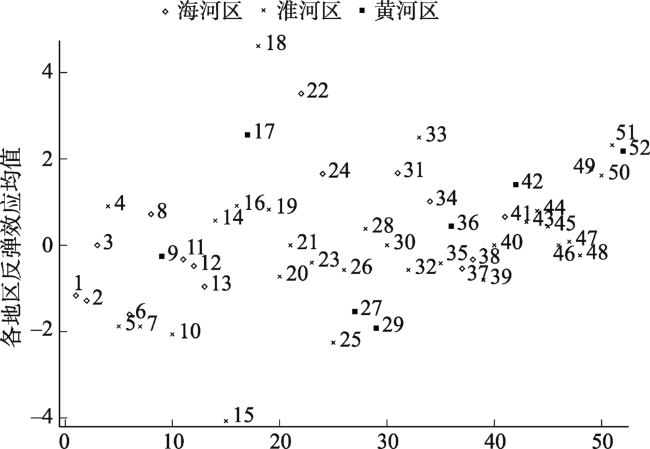
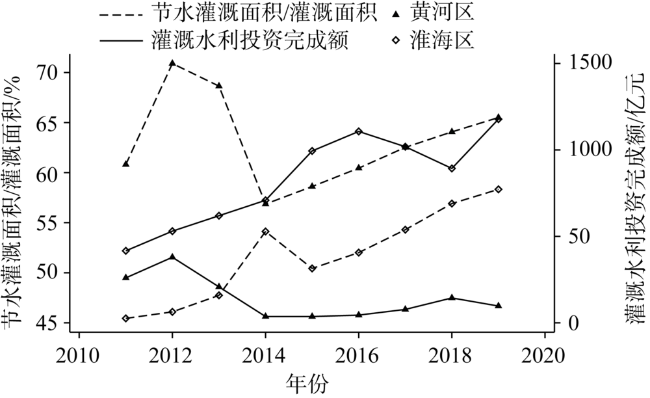
The application of water-saving technology is an important measure to save agricultural water resources. However, agricultural irrigation water consumption in many areas has not decreased with the application of such technology. By applying the panel data of 52 cities at prefecture level or above in China's main grain producing areas from 2000 to 2018, and using Malmquist index and LMDI index, we calculated the rebound amount of agricultural irrigation water brought by water-saving technology and the expected agricultural water-saving consumption. The results of the study show that the average rebound effect of irrigation water consumption in the North China Plain was 15.02% during the study period, which means that the North China Plain has not fully achieved the expected result brought by the application of water-saving technology. The application of technology relaxes the constraints of water resources. Farmers will expand the irrigated area or increase planting of high-water-consumption and high-yield crops. The effect of water-saving technology is weakened. There are different rebound degrees of irrigation water consumption in the Yellow River, Huaihe River and Haihe River basins. The average value of the overall rebound effect in the Yellow River is 41.39%, and the degree of the rebound effect is the greatest, while the overall rebound effect in the Huaihe River is the least. From the perspective of administrative region, the rebound effect of agricultural irrigation water was mainly found in Shandong, Henan and Hebei provinces. The overall average value of the rebound effect in Henan Province is 49.89%, followed by Shandong Province (29.98%), and Hebei Province (23.89%). The increase in water-saving irrigation area is the direct cause for the rebound effect of agricultural water-saving. The increase in investment in farmland irrigation water conservancy construction and the imperfect construction of water rights market are the root causes. The regional heterogeneity of rebound effect is caused by the differences in the application level of water-saving technology and the construction of water rights trading system. However, this heterogeneity will be gradually eliminated with the increase of investment in farmland irrigation conservancy construction and the improvement of water rights trading system. The research conclusion is of great significance for the adjustment of water-saving technology and irrigation policy in the North China Plain.
CHEN Jie , XU Lang , WU Dong-li . Water-saving technology, rebound effect of irrigation water consumption and regional heterogeneity in North China Plain: Based on Malmquist and LMDI Index analysis[J]. JOURNAL OF NATURAL RESOURCES, 2022 , 37(8) : 2181 -2194 . DOI: 10.31497/zrzyxb.20220817
表1 研究区节水灌溉面积状况Table 1 Area of regional water-saving irrigation, 2008-2019 |
| 年份 | 节水灌溉 面积/千hm2 | 非节水灌溉 面积/千hm2 | 节水/ 非节水 |
|---|---|---|---|
| 2008 | 8010.26 | 12539.64 | 0.64 |
| 2009 | 8247.63 | 12402.37 | 0.67 |
| 2010 | 8631.71 | 12166.89 | 0.71 |
| 2011 | 9048.37 | 11899.50 | 0.76 |
| 2012 | 9644.13 | 11330.77 | 0.85 |
| 2013 | 10181.72 | 10863.79 | 0.94 |
| 2014 | 10719.29 | 10396.79 | 1.03 |
| 2015 | 10204.30 | 11253.50 | 0.91 |
| 2016 | 10699.86 | 11043.49 | 0.97 |
| 2017 | 11271.86 | 10673.75 | 1.06 |
| 2018 | 11869.57 | 8841.53 | 1.34 |
| 2019 | 12245.82 | 8602.43 | 1.42 |
注:根据水资源统计公报和中国水利统计年鉴整理得到。 |
表2 分地区反弹效应均值和灌溉用水强度变化的因素分解Table 2 Factor decomposition of mean rebound effect and variation of irrigation water intensity in sub-regions |
| 序号 | 城市 | R | TE | ST | 序号 | 城市 | R | TE | ST |
|---|---|---|---|---|---|---|---|---|---|
| 1 | 安阳 | -1.1660 | -3.2413 | 4.2413 | 27 | 洛阳 | -1.5307 | -0.1898 | 1.1898 |
| 2 | 保定 | -1.2836 | 1.0958 | -0.0958 | 28 | 平顶山 | 0.3822 | 0.8792 | 0.1208 |
| 3 | 北京 | 0.0000 | 1.6495 | -0.6495 | 29 | 濮阳 | -1.9143 | 1.6550 | -0.6550 |
| 4 | 蚌埠 | 0.9026 | 2.0086 | -1.0086 | 30 | 青岛 | 0.0000 | 1.3513 | -0.3513 |
| 5 | 滨州 | -1.8796 | 0.8922 | 0.1078 | 31 | 秦皇岛 | 1.6726 | -0.1073 | 1.1073 |
| 6 | 沧州 | -1.6039 | 0.6623 | 0.3417 | 32 | 日照 | -0.5725 | 3.6602 | -2.6602 |
| 7 | 滁州 | -1.8834 | 1.1087 | -0.1086 | 33 | 商丘 | 2.4977 | 0.3263 | 0.6737 |
| 8 | 德州 | 0.7218 | 0.9316 | 0.0684 | 34 | 石家庄 | 1.0159 | 1.1468 | -0.1468 |
| 9 | 东营 | -0.2582 | 0.7662 | 0.2338 | 35 | 宿州 | -0.4176 | 2.1822 | -1.1822 |
| 10 | 阜阳 | -2.0641 | 1.5251 | -0.5251 | 36 | 泰安 | 0.4476 | 1.1648 | -0.1648 |
| 11 | 邯郸 | -0.3267 | -0.6933 | 1.6933 | 37 | 唐山 | -0.5407 | 5.3116 | -4.3116 |
| 12 | 鹤壁 | -0.4811 | 3.8449 | -2.7002 | 38 | 天津 | -0.3306 | 0.4097 | 0.5903 |
| 13 | 衡水 | -0.9576 | 0.1222 | 0.8778 | 39 | 潍坊 | -0.8055 | 1.4317 | -0.4263 |
| 14 | 菏泽 | 0.5711 | 0.5624 | 0.4376 | 40 | 威海 | 0.0000 | 0.6322 | 0.3678 |
| 15 | 淮北 | -4.0746 | 0.9792 | 0.0191 | 41 | 邢台 | 0.6596 | -0.1391 | 1.1391 |
| 16 | 淮南 | 0.9124 | 0.7177 | 0.2823 | 42 | 新乡 | 1.4059 | -0.9818 | 1.9818 |
| 17 | 焦作 | 2.5632 | 1.0211 | -0.0211 | 43 | 信阳 | 0.5399 | 1.4007 | -0.4007 |
| 18 | 济南 | 4.6136 | 5.5810 | -4.5810 | 44 | 许昌 | 0.7949 | 1.0989 | -0.0989 |
| 19 | 济宁 | 0.8276 | -1.0011 | 2.0011 | 45 | 徐州 | 0.4356 | 0.0510 | 0.9490 |
| 20 | 开封 | -0.7256 | 14.5512 | -13.5512 | 46 | 盐城 | 0.0000 | 1.7013 | -0.7013 |
| 21 | 莱芜 | 0.0000 | -2.4746 | 3.3670 | 47 | 烟台 | 0.0835 | 0.7594 | 0.2406 |
| 22 | 廊坊 | 3.5152 | 11.7098 | -10.6303 | 48 | 枣庄 | -0.2352 | -2.3193 | 3.3193 |
| 23 | 连云港 | -0.4033 | 1.0810 | -0.0810 | 49 | 郑州 | 1.7579 | 1.5344 | -0.5353 |
| 24 | 聊城 | 1.6566 | 0.6581 | 0.3419 | 50 | 周口 | 1.6147 | -0.0291 | 1.0291 |
| 25 | 临沂 | -2.2585 | 0.6257 | 0.3743 | 51 | 驻马店 | 2.3196 | 0.8247 | 0.1753 |
| 26 | 漯河 | -0.5737 | 0.8318 | 0.1546 | 52 | 淄博 | 2.1839 | 1.9740 | -0.9740 |
表3 反弹效应均值的分组统计Table 3 Grouping statistics of the mean of rebound effect |
| 反弹效应均值 | 地区数量/个 | 均值 | 方差 | 最小值 | 最大值 |
|---|---|---|---|---|---|
| R ≤ 0 | 28 | -0.9389 | 0.9408 | -4.0746 | 0 |
| 0<R<1 | 12 | 0.6066 | 0.2460 | 0.0835 | 0.9124 |
| R ≥ 1 | 12 | 2.2347 | 0.9964 | 1.0159 | 4.6136 |
表4 农业全要素生产率增长与分解Table 4 Growth and decomposition of agricultural total factor productivity |
| 时间段/年 | Techch | Pech | Sech | TFP |
|---|---|---|---|---|
| 2000—2001 | 0.979 | 0.995 | 0.982 | 0.957 |
| 2001—2002 | 1.046 | 0.971 | 0.991 | 1.007 |
| 2002—2003 | 1.012 | 1.037 | 0.992 | 1.041 |
| 2003—2004 | 0.977 | 1.073 | 1.011 | 1.060 |
| 2004—2005 | 1.033 | 1.012 | 0.987 | 1.031 |
| 2005—2006 | 1.053 | 1.004 | 0.993 | 1.051 |
| 2006—2007 | 0.978 | 1.015 | 0.982 | 0.975 |
| 2007—2008 | 0.990 | 1.007 | 1.073 | 1.070 |
| 2008—2009 | 0.962 | 1.020 | 0.998 | 0.979 |
| 2009—2010 | 1.025 | 1.012 | 1.034 | 1.073 |
| 2010—2011 | 1.021 | 0.991 | 1.008 | 1.019 |
| 2011—2012 | 0.997 | 1.001 | 1.007 | 1.004 |
| 2012—2013 | 1.186 | 0.957 | 0.962 | 1.091 |
| 2013—2014 | 1.003 | 1.003 | 1.002 | 1.008 |
| 2014—2015 | 0.871 | 1.044 | 1.056 | 0.960 |
| 2015—2016 | 1.181 | 0.958 | 1.014 | 1.148 |
| 2016—2017 | 0.996 | 0.941 | 0.996 | 0.933 |
| 2017—2018 | 1.044 | 0.997 | 0.984 | 1.024 |
| 均值 | 1.017 | 1.002 | 1.004 | 1.023 |
| [1] |
|
| [2] |
|
| [3] |
|
| [4] |
|
| [5] |
|
| [6] |
|
| [7] |
王哲, 陈煜. 技术进步一定会带来一个区域农业用水总量下降吗?基于河北省面板数据实证分析. 农业技术经济, 2020, (6): 81-89.
[
|
| [8] |
李贵芳, 周丁扬, 石敏俊. 西北干旱区作物灌溉技术效率及影响因素. 自然资源学报, 2019, 34(4): 853-866.
[
|
| [9] |
罗文哲, 蒋艳灵, 王秀峰, 等. 华北地下水超采区农户节水灌溉技术认知分析: 以河北省张家口市沽源县为例. 自然资源学报, 2019, 34(11): 2469-2480.
[
|
| [10] |
|
| [11] |
|
| [12] |
|
| [13] |
|
| [14] |
|
| [15] |
肖序, 万红艳. 技术进步对中国电解铝能源消费回弹效应的影响: 基于二级镶嵌式CES函数的实证研究. 中国人口·资源与环境, 2012, 22(10): 144-150.
[
|
| [16] |
夏婷, 陈林. 技术创新与能源回弹效应之探讨: 以中国工业为例. 科学决策, 2014, (4): 41-57.
[
|
| [17] |
|
| [18] |
李凯杰, 董丹丹, 韩亚峰. 绿色创新的环境绩效研究: 基于空间溢出和回弹效应的检验. 中国软科学, 2020, (7): 112-121.
[
|
| [19] |
|
| [20] |
|
| [21] |
|
| [22] |
|
| [23] |
胡东兰, 申颢, 刘自敏. 中国城市能源回弹效应的时空演变与形成机制研究. 中国软科学, 2019, (11): 96-108.
[
|
| [24] |
赵丹丹, 周宏, 高富雄. 农户分化、技术约束与耕地保护技术选择差异: 基于不同约束条件下的农户技术采纳理论分析框架. 自然资源学报, 2020, 35(12): 2956-2967.
[
|
| [25] |
|
| [26] |
|
| [27] |
|
| [28] |
|
| [29] |
|
| [30] |
|
| [31] |
|
| [32] |
李强, 魏巍, 徐康宁. 技术进步和结构调整对能源消费回弹效应的估算. 中国人口·资源与环境, 2014, 24(10): 64-67.
[
|
| [33] |
|
| [34] |
|
| [35] |
|
| [36] |
|
| [37] |
何培培, 张俊飚, 何可, 等. 农业生产何以存在低碳效率幻觉? 来自1997—2016年31个省份面板数据的证据. 自然资源学报, 2020, 35(9): 2205-2217.
[
|
| [38] |
国涓, 凌煜, 郭崇慧. 中国工业部门能源消费反弹效应的估算: 基于技术进步视角的实证研究. 资源科学, 2010, 32(10): 1839-1845.
[
|
| [39] |
|
| [40] |
|
| [41] |
|
| [42] |
|
/
| 〈 |
|
〉 |