
JOURNAL OF NATURAL RESOURCES >
Accounting of gains and losses of ecological assets in counties of key ecological function regions in Yangtze River Delta
Received date: 2021-08-23
Revised date: 2021-11-19
Online published: 2022-10-28
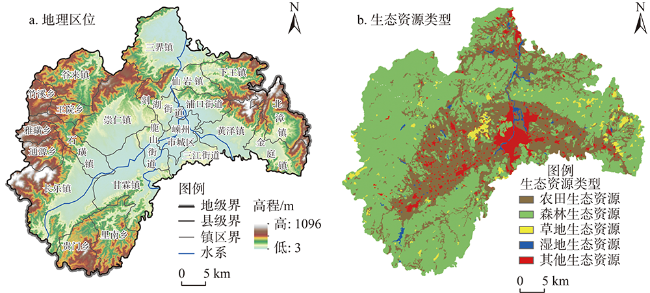
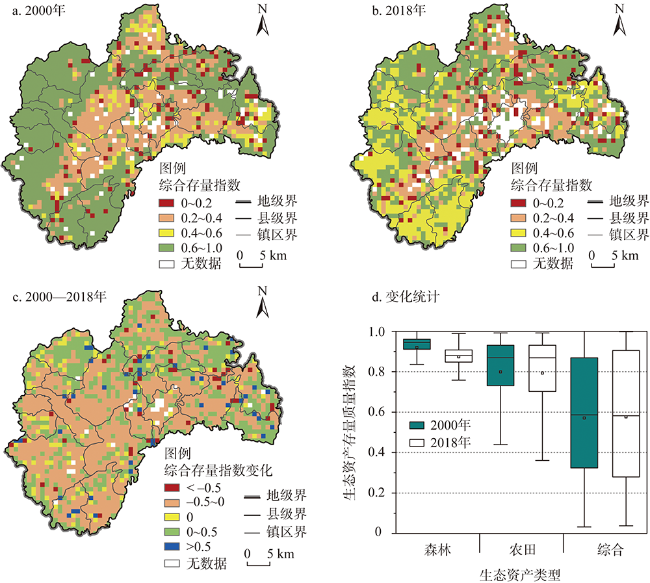
Key ecological function counties with limited development undertake the dual mission of ecological protection and economic development. Accounting of gains and losses of ecological assets is an effective way to quantify the paid use of regional resources, ecosystem protection and restoration and ecological performance appraisals. Taking Shengzhou city of Zhejiang province as a typical county-level unit of important ecological barrier function area, the spatiotemporal dynamic changes of ecological stock and flow assets in recent 20 years were evaluated based on a grid scale, and the driving factors of gains and losses of ecological assets were evaluated based on Geodetector and the monitoring of human activity types. The results showed that from 2000 to 2018, due to the reduction of quality and areas of forest ecological assets, the ecological stock assets in nearly 60% of Shengzhou city showed a decreasing trend, while the total value and the value per unit area of ecological flow assets gained by more than 10%. Compared with natural factors, socio-economic factors contributed more to the change of ecological assets in Shengzhou city, with a contribution rate of 17%. Urbanization led to a slight reduction in grain supply at the county level, and ecological assets in more than 70% of the township gained, especially Shihuang town, which showed a good result in ecological protection, with gains in the value per unit area of ecological flow assets of more than 20 million yuan/km2. Therefore, more attention should be paid to the protection of forest resources, strict design of basic farmland protection redlines, and reasonable land use planning in the process of urbanization in the future.
LI Jia-hui , HUANG Lin , CAO Wei , WU Dan . Accounting of gains and losses of ecological assets in counties of key ecological function regions in Yangtze River Delta[J]. JOURNAL OF NATURAL RESOURCES, 2022 , 37(8) : 1946 -1960 . DOI: 10.31497/zrzyxb.20220802
表1 数据来源与预处理Table 1 The sources and preprocessing of data |
| 数据类型 | 数据来源 |
|---|---|
| 统计数据 | 2000—2018年农产品、畜产品、林产品等产量与市场价格数据、旅游业收入等产业数据来自《嵊州年鉴》;湖泊、水库库容数据来自绍兴市人民政府网(http://www.sx.gov.cn/)。水资源总量数据来自2000—2018年的《绍兴市水资源公报》。污水处理成本数据来自于2018年《全国65个城市(地区)水价专题报告》 |
| 气象数据 | 2000—2018年降水、气温数据来自中国气象数据网(http://data.cma.cn/),经处理后通过ANUSPLIN插值而成,空间分辨率为1 km |
| 土地利用变化数据 | 2000—2018年土地利用数据来自资源环境科学与数据中心(http://www.resdc.cn/),基于Landsat TM/ETM数据通过人工目视解译生成,空间分辨率100 m |
| 生态系统类型数据 | 将土地利用现状类型重分类转换为生态系统类型,包括农田、森林、草原、湿地以及其他等类型 |
| ET数据 | 来源于2000—2018年的年尺度MOD16/ET数据,空间分辨率为500 m。MOD16产品的ET是由植被覆盖率、反照率等遥感数据以及气压、气温、相对湿度等实测气象信息,计算得到植被与土壤的净辐射量,再以Penman-Monteith公式为基础计算得到[29] |
| NPP数据 | 2000—2018年逐年NPP数据,由MOD17A3产品(https://Ipdaac.usgs.gov/)经过镶嵌与投影转换处理并裁剪出研究区范围内影像,空间分辨率为500 m |
| 生物量数据 | 根据地面实测数据建立NPP与地上生物量的关系模型[28],通过NPP数据反演得到 |
| DEM数据 | 通过地理空间数据云平台(http://www.gscloud.cn/)下载ASTER GDEM V2数据,空间分辨率30 m,对覆盖研究区的2景影像进行拼接并用嵊州市矢量边界数据裁剪得到 |
| 社会经济数据 | 2000—2018年人口密度数据与GDP密度数据来自资源环境科学与数据中心(http://www.resdc.cn/),空间分辨率1 km |
表2 嵊州市生态资源资产价值评估指标体系与核算方法Table 2 Evaluation index systems and accounting methods of ecological assets in Shengzhou city |
| 一级指标 | 二级指标 | 计算公式 | 参数说明 |
|---|---|---|---|
| 生态供给 | 食物 | 是粮食作物、蔬菜、食用菌、果用瓜、林产品(茶叶、香榧)等产量(kg); 为其相应市场价格(元/kg) | |
| 生产原 材料 | 是油料、棉花、麻类、药材类、毛竹篙竹、蚕桑等产量(kg); 为其相应市场价格(元/kg) | ||
| 水 | 为地表、地下与其他水源供给量(m3); 为当年水价(元/m3) | ||
| 生态调节 | 洪水调蓄 | | 为植被拦蓄降水量(m3/a); 为年降水量(mm); 为暴雨径流量(mm); 为植被蒸散量(mm); 为第 类生态资源面积(m2); 为湖泊、水库总库容(m3); 为水库单位库容成本(元/m3),取值6.1107元/m3[17] |
| 水质净化 | 为植被水质净化量(m3/a); 为污水处理价格(元/t),取值0.95元/t | ||
| 侵蚀调节 | 为土壤保持量(t/a),采用RUSLE模型[29]计算得到;λ为泥沙淤积系数[12]; 为土壤容重(t/m3)[16]; 为挖取单位面积土方的费用,取12.6元/m3[17]; 为土壤中第 类养分含量[6,22]; 为第 种养分化肥市场价格(元/t)[30]; | ||
| 气候变化减缓 | 为植被 (g C·m-2·a-1); 为生物量与碳含量转换系数,取国际通用标准0.45 g C/g; 为瑞典碳税替代价格,取值1200元/t[17] | ||
| 微气候 调节 | | 为增加空气湿度量(kg·a-1); 为第 类生态资源蒸散发量(m); 为人类活动高度,取值100 m; 为标准状况下水的密度,取1000 kg·m-3; 为大气混合层高度(m)[17]; 为降温吸热量(kJ·a-1); 为20 ℃时水的汽化热,取2453 kJ·kg-1[17]; 为一年日数; 为一年中夏季日数; 与 分别为加湿器(280 w)与空调输入功率(4800 w);ηh与ηt分别为加湿器增湿效率(6 kg·h-1)与空调制冷效率(50400 kJ·h-1)[17]; 为当年电费单价(元·kw-1·h-1) | |
| 空气质量调节 | 为工业制氧价格,取1000元·t-1; 为第 类生态资源(森林、草地生态资源)单位面积吸收 类大气污染物的量(t·km-2·a-1)[31⇓-33]; 为第 类大气污染物治理成本(元·t-1) | ||
| 生态文化 | 景观游憩 | 为森林康养、生态旅游收入(元·a-1) |
表3 2000—2018年嵊州市生态资源资产流量总价值量、单位面积价值量统计Table 3 County-level statistics of the total value and value per unit area of ecological flow assets in Shengzhou city from 2000 to 2018 |
| 生态资产类型 | 2000年 | 2018年 | 变化量 | 变幅 | |||||||||
|---|---|---|---|---|---|---|---|---|---|---|---|---|---|
| 一级指标 | 二级指标 | 单位面积价值/(万元/km2) | 总价值 /亿元 | 单位面积价值/(万元/km2) | 总价值/亿元 | 单位面积价值/(万元/km2) | 总价值 /亿元 | 单位面积价值/% | 总价值/% | ||||
| 生态供给 | 食物供给 | 252.58 | 44.03 | 251.84 | 42.36 | -0.74 | -1.67 | -0.29 | -3.78 | ||||
| 生产原材料供给 | 105.04 | 17.70 | 115.10 | 18.83 | 10.05 | 1.13 | 9.57 | 6.38 | |||||
| 水供给 | 263.20 | 45.88 | 340.31 | 57.24 | 77.11 | 11.37 | 29.30 | 24.77 | |||||
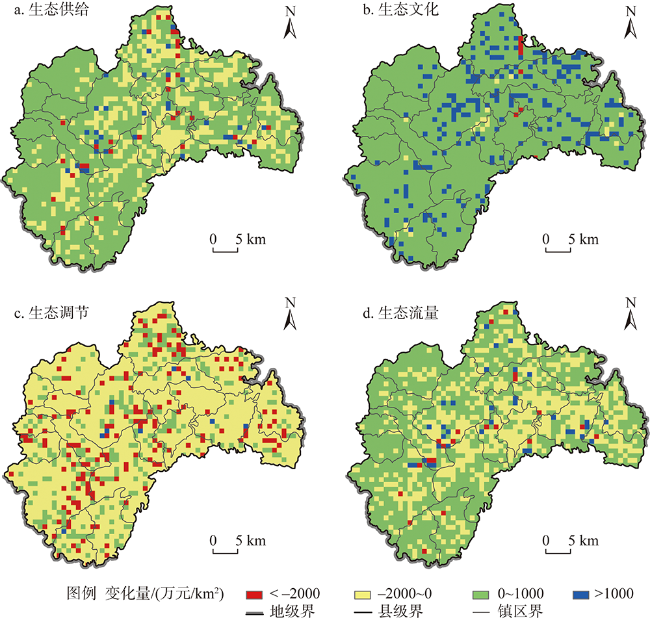
| 生态文化 | 景观游憩 | 218.86 | 24.95 | 320.10 | 53.84 | 268.89 | 44.92 | 525.13 | 503.25 | ||||
| 生态调节 | 洪水调蓄 | 52.41 | 5.98 | 258.53 | 29.86 | 39.67 | 4.91 | 18.13 | 19.68 | ||||
| 水质净化 | 132.88 | 22.98 | 64.07 | 7.40 | 11.66 | 1.43 | 22.24 | 23.85 | |||||
| 侵蚀调节 | 188.76 | 32.90 | 85.67 | 14.29 | -47.21 | -8.69 | -35.53 | -37.80 | |||||
| 气候变化减缓 | 328.03 | 57.18 | 111.41 | 18.74 | -77.34 | -14.16 | -40.97 | -43.04 | |||||
| 微气候调节 | 114.79 | 12.93 | 341.08 | 57.37 | 13.06 | 0.19 | 3.98 | 0.34 | |||||
| 空气质量调节 | 218.86 | 24.95 | 33.92 | 3.87 | -80.87 | -9.06 | -70.45 | -70.06 | |||||
| 合计 | 1568.70 | 273.43 | 1806.18 | 303.80 | 237.48 | 30.38 | 15.14 | 11.11 | |||||
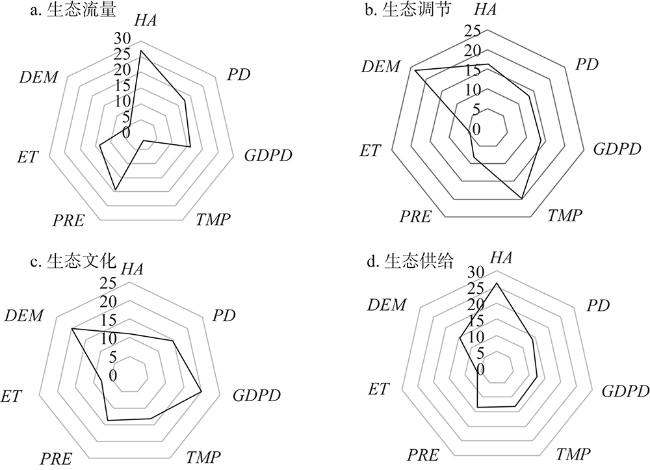
图5 社会经济因素、自然因素对嵊州市生态资源资产流量价值的相对贡献度雷达图(%)Fig. 5 Radar charts of relative contribution degree of socio-economic and natural factors to ecological flow assets in Shengzhou city |
表4 社会经济因素、自然因素与嵊州市生态资源资产流量价值的相关性Table 4 Pearson correlation among socio-economic factors, natural factors and the value of ecological flow assets in Shengzhou city |
| 生态资产类型 | LUI | PD | GDPD | TMP | PRE | ET | DEM |
|---|---|---|---|---|---|---|---|
| 生态流量 | 0.17** | 0.07* | 0.11** | 0.11** | -0.02 | 0.05 | -0.10** |
| 生态调节 | -0.30** | -0.10** | -0.14** | -0.26** | 0.13** | 0.05 | 0.32** |
| 生态文化 | 0.12** | 0.08** | 0.11** | 0.13** | -0.05 | -0.05 | -0.15** |
| 生态供给 | 0.22** | 0.09** | 0.13** | 0.15** | -0.04 | 0.04 | -0.15** |
注:*、**分别表示在0.05、0.01水平上(双侧)相关性显著。 |
表5 2000—2018年嵊州市县域及乡镇人类活动类型监测Table 5 Monitoring of human activity types in Shengzhou city and counties from 2000 to 2018 (km2) |
| 乡镇 | 农业开发 | 森林恢复 | 草地恢复 | 湿地恢复 | 城镇化 |
|---|---|---|---|---|---|
| 崇仁镇 | 4.38 | 4.04 | 0.28 | 0.21 | 3.16 |
| 石璜镇 | 1.10 | 1.09 | — | 0.02 | 1.73 |
| 剡湖街道 | 0.89 | 0.64 | 0.09 | 0.20 | 3.14 |
| 黄泽镇 | 1.80 | 1.50 | — | 0.32 | 4.23 |
| 竹溪乡 | 0.17 | 0.16 | — | — | — |
| 金庭镇 | 1.38 | 1.48 | 0.08 | 0.02 | 1.38 |
| 仙岩镇 | 2.21 | 2.32 | 0.07 | 0.24 | 0.13 |
| 北漳镇 | 2.32 | 2.58 | 0.25 | 0.04 | 0.73 |
| 雅璜乡 | 0.15 | 0.37 | 0.01 | — | — |
| 谷来镇 | 1.01 | 1.45 | 0.02 | — | 0.32 |
| 三界镇 | 5.36 | 5.36 | 0.02 | 0.71 | 5.73 |
| 通源乡 | 0.16 | 0.30 | — | — | 0.03 |
| 里南乡 | 1.63 | 1.82 | — | — | — |
| 甘霖镇 | 3.74 | 3.04 | 0.10 | — | 6.22 |
| 三江街道 | 0.96 | 1.37 | — | 0.02 | 3.23 |
| 浦口街道 | 0.83 | 0.42 | — | 0.22 | 2.27 |
| 鹿山街道 | 1.41 | 0.92 | 0.30 | — | 1.48 |
| 长乐镇 | 4.19 | 4.45 | 0.11 | 0.54 | 3.81 |
| 王院乡 | 0.59 | 0.79 | 0.01 | — | — |
| 下王镇 | 2.71 | 2.75 | — | — | 0.41 |
| 贵门乡 | 1.46 | 4.42 | — | — | — |
| 嵊州市城区 | 0.73 | 0.35 | — | 0.24 | 16.34 |
| 嵊州市总计 | 39.18 | 41.62 | 1.34 | 2.78 | 54.34 |
表6 2000—2018年嵊州市乡镇生态资源资产总价值量、单位面积价值量统计Table 6 Township-level statistics of the total value and value per unit area of ecological flow assets in Shengzhou city from 2000 to 2018 |
| 乡镇 | 总价值量/亿元 | 单位面积价值量/(万元/km2) | |||||
|---|---|---|---|---|---|---|---|
| 2000年 | 2018年 | 变化量 | 2000年 | 2018年 | 变化量 | ||
| 崇仁镇 | 10.88 | 36.68 | 9.47 | 621.96 | 2083.91 | 529.01 | |
| 石璜镇 | 4.61 | 15.35 | 3.83 | 697.86 | 2475.39 | 730.73 | |
| 剡湖街道 | 1.36 | 5.51 | 2.10 | 440.23 | 1619.97 | 519.41 | |
| 黄泽镇 | 5.24 | 16.28 | 3.18 | 523.80 | 1713.63 | 404.13 | |
| 竹溪乡 | 1.46 | 4.50 | 0.84 | 430.41 | 1406.50 | 330.47 | |
| 金庭镇 | 4.37 | 13.46 | 2.55 | 597.99 | 1795.24 | 300.28 | |
| 仙岩镇 | 4.80 | 14.26 | 2.26 | 705.85 | 2036.83 | 272.20 | |
| 北漳镇 | 4.49 | 13.54 | 2.33 | 534.00 | 1593.47 | 258.47 | |
| 雅璜乡 | 1.34 | 4.33 | 0.97 | 480.11 | 1396.23 | 195.96 | |
| 谷来镇 | 5.13 | 14.61 | 1.79 | 498.13 | 1418.87 | 173.56 | |
| 三界镇 | 10.59 | 28.45 | 1.97 | 649.74 | 1777.84 | 153.50 | |
| 通源乡 | 2.47 | 6.96 | 0.79 | 548.73 | 1513.15 | 141.32 | |
| 里南乡 | 5.33 | 14.06 | 0.74 | 554.80 | 1495.76 | 108.76 | |
| 甘霖镇 | 6.56 | 18.37 | 1.97 | 443.05 | 1192.57 | 84.95 | |
| 三江街道 | 1.94 | 4.75 | -0.11 | 498.54 | 1320.47 | 74.13 | |
| 浦口街道 | 3.15 | 8.03 | 0.15 | 594.53 | 1515.15 | 28.83 | |
| 鹿山街道 | 3.12 | 8.10 | 0.29 | 762.15 | 1928.29 | 22.93 | |
| 长乐镇 | 12.49 | 30.74 | -0.50 | 583.78 | 1456.63 | -2.82 | |
| 王院乡 | 2.03 | 5.20 | 0.12 | 615.24 | 1528.26 | -9.85 | |
| 下王镇 | 4.74 | 11.25 | -0.61 | 600.49 | 1354.96 | -146.28 | |
| 贵门乡 | 4.30 | 9.52 | -1.23 | 661.52 | 1400.51 | -253.30 | |
| 嵊州市城区 | 2.06 | 1.83 | -3.33 | 412.86 | 390.21 | -641.94 | |
| [1] |
国务院. 国务院关于印发全国主体功能区规划的通知. http://www.gov.cn/zhengce/content/2011-06/08/content_1441.htm, 2011-06-08.
[ The State Council of the People's Republic of China. Notice of the State Council on printing and distributing the National Main Functional Areas. http://www.gov.cn/zhengce/content/2011-06/08/content_1441.htm, 2011-06-08.]
|
| [2] |
高吉喜. 区域生态资产评估:理论, 方法与应用. 北京: 科学出版社, 2013: 137-143.
[
|
| [3] |
陈妍, 侯鹏, 王媛, 等. 生态保护地协同管控成效评估. 自然资源学报, 2020, 35(4): 779-787.
[
|
| [4] |
欧阳志云, 郑华, 谢高地, 等. 生态资产、生态补偿及生态文明科技贡献核算理论与技术. 生态学报, 2016, 36(22): 7136-7139.
[
|
| [5] |
许闯胜, 刘伟, 宋伟, 等. 差异化开展国土空间生态修复的思考. 自然资源学报, 2021, 36(2): 384-394.
[
|
| [6] |
白杨, 李晖, 王晓媛, 等. 云南省生态资产与生态系统生产总值核算体系研究. 自然资源学报, 2017, 32(7): 1100-1112.
[
|
| [7] |
|
| [8] |
谢高地. 生态资产评价: 存量、质量与价值. 环境保护, 2017, 45(11): 18-22.
[
|
| [9] |
刘焱序, 傅伯杰, 赵文武, 等. 生态资产核算与生态系统服务评估: 概念交汇与重点方向. 生态学报, 2018, 38(23): 8267-8276.
[
|
| [10] |
陈梅, 纪荣婷, 刘溪, 等. “两山”基地生态系统生产总值核算与“两山”转化分析: 以浙江省宁海县为例. 生态学报, 2021, 41(14): 5899-5907.
[
|
| [11] |
张婕, 刘玉洁, 潘韬, 等. 自然资源资产负债表编制中生态损益核算. 自然资源学报, 2020, 35(4): 755-766.
[
|
| [12] |
欧阳志云, 朱春全, 杨广斌, 等. 生态系统生产总值核算: 概念、核算方法与案例研究. 生态学报, 2013, 33(21): 6747-6761.
[
|
| [13] |
|
| [14] |
谢高地, 甄霖, 鲁春霞, 等. 一个基于专家知识的生态系统服务价值化方法. 自然资源学报, 2008, 23(5): 911-919.
[
|
| [15] |
潘耀忠, 史培军, 朱文泉, 等. 中国陆地生态系统生态资产遥感定量测量. 中国科学D辑: 地球科学, 2004, 34(4): 375-384.
[
|
| [16] |
朱文泉, 张锦水, 潘耀忠, 等. 中国陆地生态系统生态资产测量及其动态变化分析. 应用生态学报, 2007, 18(3): 586-594.
[
|
| [17] |
北京市质量技术监督局. DB11/T 659-2018森林资源资产价值评估技术规范.
[ Beijing Municipal Bureau of Quality and Technical Supervision. DB11/T 659-2018 Technical specifications for valuation of forest resource assets.]
|
| [18] |
宋昌素, 欧阳志云. 面向生态效益评估的生态系统生产总值GEP核算研究: 以青海省为例. 生态学报, 2020, 40(10): 3207-3217.
[
|
| [19] |
李真, 潘竟虎, 胡艳兴. 甘肃省生态资产价值和生态-经济协调度时空变化格局. 自然资源学报, 2017, 32(1): 64-75.
[
|
| [20] |
苏常红, 王亚璐. 汾河上游流域生态系统服务变化及驱动因素. 生态学报, 2018, 38(22): 7886-7898.
[
|
| [21] |
朱青, 周自翔, 刘婷, 等. 黄土高原植被恢复与生态系统土壤保持服务价值增益研究: 以延河流域为例. 生态学报, 2021, 41(7): 2557-2570.
[
|
| [22] |
白玛卓嘎, 肖燚, 欧阳志云, 等. 基于生态系统生产总值核算的习水县生态保护成效评估. 生态学报, 2020, 40(2): 499-509.
[
|
| [23] |
游旭, 何东进, 肖燚, 等. 县域生态保护成效评估方法: 以峨山县为例. 生态学报, 2019, 39(9): 3051-3061.
[
|
| [24] |
靳乐山, 刘晋宏, 孔德帅. 将GEP纳入生态补偿绩效考核评估分析. 生态学报, 2019, 39(1): 24-36.
[
|
| [25] |
游旭, 何东进, 肖燚, 等. 县域生态资产核算研究: 以云南省屏边县为例. 生态学报, 2020, 40(15): 5220-5229.
[
|
| [26] |
方精云, 刘国华, 徐嵩龄. 我国森林植被的生物量和净生产量. 生态学报, 1996, 16(5): 497-508.
[
|
| [27] |
王永琪, 马姜明. 基于县域尺度珠江—西江经济带广西段土地利用变化对生态系统服务价值的影响研究. 生态学报, 2020, 40(21): 7826-7839.
[
|
| [28] |
傅伯杰, 于丹丹, 吕楠. 中国生物多样性与生态系统服务评估指标体系. 生态学报, 2017, 37(2): 341-348.
[
|
| [29] |
|
| [30] |
韩永伟, 高吉喜, 王宝良, 等. 黄土高原生态功能区土壤保持功能及其价值. 农业工程学报, 2012, 28(17): 78-85.
[
|
| [31] |
马新辉, 孙根年, 任志远. 西安市植被净化大气物质量的测定及其价值评价. 干旱区资源与环境, 2002, 16(4): 83-86.
[
|
| [32] |
袁正科, 田大伦, 袁穗波. 森林生态系统净化大气SO2能力及吸S潜力研究. 湖南林业科技, 2005, 32(1): 1-4.
[
|
| [33] |
赵勇, 李树人, 阎志平. 城市绿地的滞尘效应及评价方法. 华中农业大学学报, 2002, 21(6): 582-586.
[
|
| [34] |
胡畔, 陈波, 史培军. 中国暴雨洪涝灾情时空格局及影响因素. 地理学报, 2021, 76(5): 1148-1162.
[
|
| [35] |
徐勇, 孙晓一, 汤青. 陆地表层人类活动强度: 概念、方法及应用. 地理学报, 2015, 70(7): 1068-1079.
[
|
| [36] |
王劲峰, 徐成东. 地理探测器: 原理与展望. 地理学报, 2017, 72(1): 116-134.
[
|
| [37] |
张玥, 许端阳, 王子玉, 等. 2000—2015年锡林郭勒盟防风固沙服务功能变化驱动因素分析. 生态学报, 2021, 41(2): 603-614.
[
|
| [38] |
李睿倩, 李永富, 胡恒. 生态系统服务对国土空间规划体系的理论与实践支撑. 地理学报, 2020, 75(11): 2417-2430.
[
|
/
| 〈 |
|
〉 |