
JOURNAL OF NATURAL RESOURCES >
Balanced characteristics and obstacle factors of high-quality green development in Yangtze River Delta Urban Agglomeration
Received date: 2021-06-14
Revised date: 2021-09-19
Online published: 2022-08-28
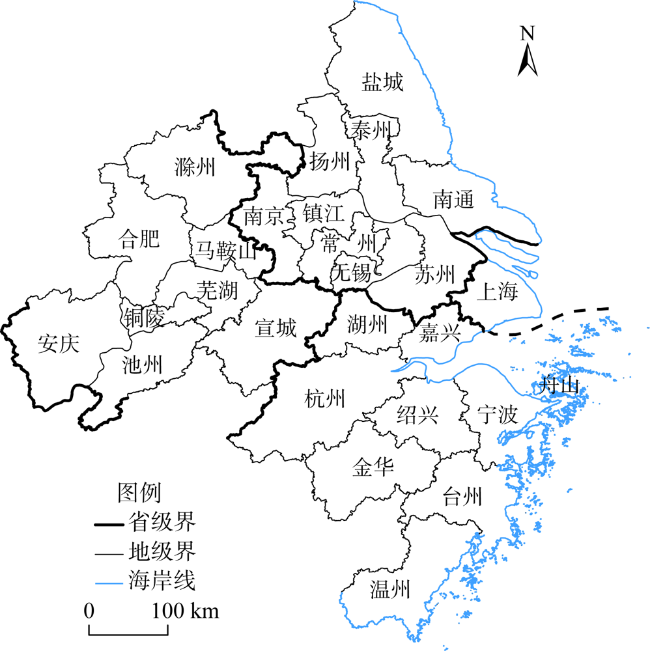
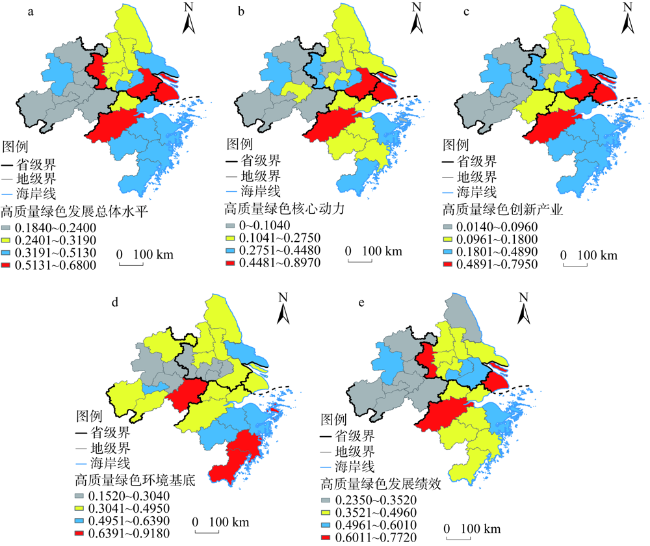
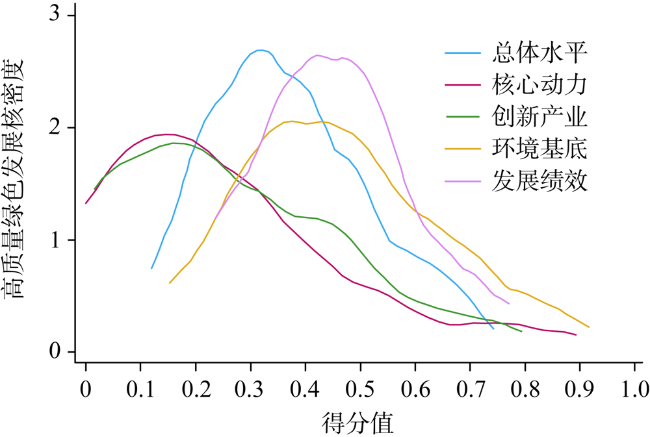
Under the strategic background of high-quality integration of Yangtze River Delta and ecological priority and green development of Yangtze River Economic Belt, it is of great significance to explore the high-quality green development of Yangtze River Delta Urban Agglomeration. This paper constructs a high-quality green development evaluation system from four dimensions of green core power, green innovation industry, green environment base and green development performance. Based on the methods of critical weighting, kernel density estimation, center of gravity standard deviation ellipse and other methods, the equilibrium state, equilibrium degree and equilibrium entropy of high-quality green development of 27 cities in Yangtze River Delta Urban Agglomeration are discussed. The results show that: (1) Generally, the high-quality green development level of the urban agglomeration presents a northwest-southeast pattern and the gravity is located in the east of the center of the region. There are obvious spatial differences in the high-quality green development, but there is no spatial polarization. (2) From the regional perspective, the overall level of high-quality green development is relatively balanced, but with relatively low innovative dimension. From the perspective of city, there is obvious provincial differentiation in the degree of equilibrium, and Shanghai and the cities in Jiangsu and Zhejiang are obviously better than Anhui province. Equilibrium entropy shows that most cities have advantages in coordination degree of high-quality green development and have certain development potential. (3) Innovation level, environmental quality, land intensification and modern industry are common obstacles to high-quality green development. Based on this, the main obstacle types of cities are summarized and their specific obstacles are defined too. Adhering to innovation driven development, building a modern industrial system, strengthening the governance of land space, promoting the intensive, efficient and sustainable use of land, and maintaining a reasonable degree of balance and coordination are the urgent tasks to further promote the high-quality green development in the Yangtze River Delta Urban Agglomeration in the future.
WANG Shu-jing , LI Jun-feng . Balanced characteristics and obstacle factors of high-quality green development in Yangtze River Delta Urban Agglomeration[J]. JOURNAL OF NATURAL RESOURCES, 2022 , 37(6) : 1540 -1554 . DOI: 10.31497/zrzyxb.20220612
表1 高质量绿色发展评价指标体系Table 1 The evaluation index system of high-quality green development |
| 评价维度 | 评价指标 | 解释性指标及代理变量 |
|---|---|---|
| 高质量绿色核心动力A1 | 创新人才B1 | 研究与试验发展(R&D)人员数量/人 C1 |
| 技术水平B2 | 专利申请授权数量/件 C2 | |
| 高质量绿色创新产业A2 | 农业新业态B3 | 都市休闲农业接待游客人次/万人 C3 |
| 绿色制造业B4 | 高新技术产业产值/亿元 C4 | |
| 现代服务业B5 | 新兴服务业增加值/亿元 C5 | |
| 高质量绿色环境基底A3 | 城市绿化B6 | 人均公园绿地面积/m2 C6 |
| 空气质量B7 | 年空气质量良好天数/天 C7 | |
| 高质量绿色发展绩效A4 | 经济发展绩效B8 | 城市人均GDP/元 C8 |
| 城市GDP总量/亿元 C9 | ||
| 第三产业增加值占GDP比例/% C10 | ||
| 资源环境绩效B9 | 万元GDP能耗/吨标准煤 C11 | |
| 工业二氧化硫去除量与产生量之比 C12 | ||
| 工业烟尘去除量与产生量之比 C13 | ||
| 一般工业固体废物综合利用率/% C14 | ||
| 单位土地产出值/(万元/km2) C15 | ||
| 社会发展绩效B10 | 城市居民家庭年均可支配收入/元 C16 | |
| 每千人拥有医生/人 C17 | ||
| 万人大学生人数/人 C18 |
注:新兴服务业增加值是指信息传输软件和信息技术服务业、科学研究和技术服务业、租赁和商务服务业三大类服务行业增加值之和。单位土地产出值为市GDP与市土地面积的比值。 |
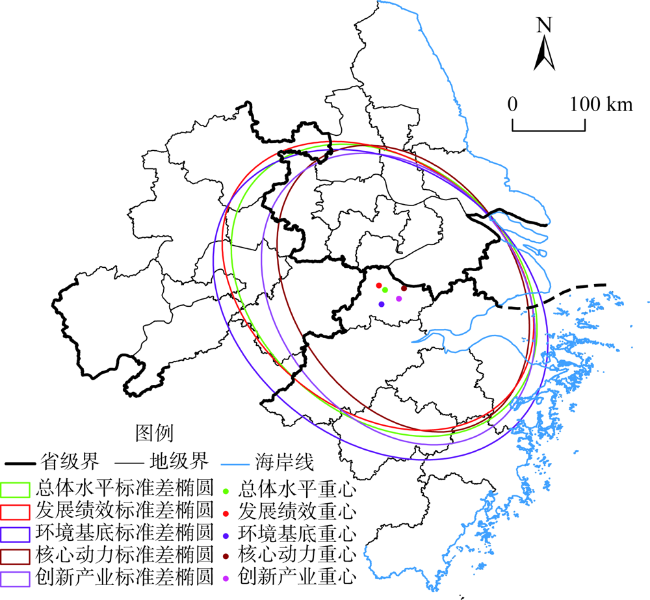
图2 高质量绿色发展重心—标准差椭圆Fig. 2 Standard deviation ellipse of high-quality green development |
表2 长三角城市群高质量绿色发展的重心—标准差椭圆参数Table 2 Center of gravity standard deviation ellipse parameter of high-quality green development in Yangtze River Delta Urban Agglomeration |
| 评价维度 | X轴标准差 | Y轴标准差 | 转角/(°) | 重心坐标 |
|---|---|---|---|---|
| 总体水平 | 2.067 | 1.583 | 129.55 | 119.92°E,30.88°N |
| 核心动力 | 1.905 | 1.414 | 146.89 | 120.12°E,30.91°N |
| 创新产业 | 1.962 | 1.527 | 141.24 | 120.06°E,30.78°N |
| 环境基底 | 2.250 | 1.720 | 126.37 | 119.84°E,30.70°N |
| 发展绩效 | 2.075 | 1.565 | 126.39 | 119.87°E,30.96°N |
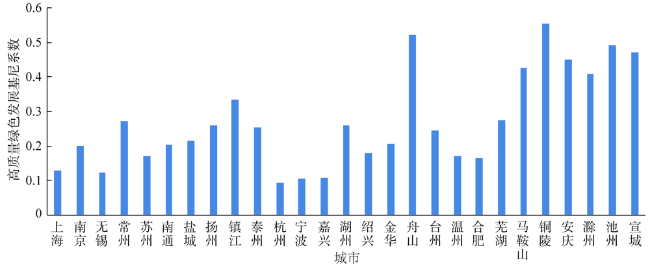
表3 长三角城市群高质量绿色发展基尼系数Table 3 Gini coefficient of high-quality green development in Yangtze River Delta Urban Agglomeration |
| 评价维度 | 总体水平 | 核心动力 | 创新产业 | 环境基底 | 发展绩效 |
|---|---|---|---|---|---|
| 长三角城市群 | 0.2309 | 0.4761 | 0.3859 | 0.2156 | 0.2332 |
表4 长三角城市群高质量绿色发展均衡熵类型Table 4 Equilibrium entropy types of high-quality green development in Yangtze River Delta Urban Agglomeration |
| 均衡熵值 | 城市分类 | 城市分类 |
|---|---|---|
| 均衡熵>1 | 高水平协调优势型: 无锡、苏州、南通、杭州、宁波、嘉兴、绍兴、金华、台州、温州 | 低水平协调优势型: 盐城、扬州、湖州、芜湖、滁州、宣城 |
| 均衡熵<1 | 高水平但协调优势不突出: 上海、南京、合肥、舟山 | 低水平且协调无优势: 常州、镇江、泰州、马鞍山、铜陵、安庆、池州 |
表5 高质量绿色发展维度层障碍度Table 5 Obstacle degree of high-quality green development dimension (%) |
| 衡量维度 | 核心动力 | 创新产业 | 环境基底 | 发展绩效 |
|---|---|---|---|---|
| 障碍度 | 21.00 | 39.22 | 14.21 | 25.57 |
表6 高质量绿色发展指标障碍度Table 6 Obstacle degree of high-quality green development index (%) |
| 指标名称 | 障碍度 | 指标名称 | 障碍度 |
|---|---|---|---|
| R&D人员数量C1 | 7.64 | 第三产业增加值占GDP比例C10 | 6.60 |
| 专利申请授权数量C2 | 6.26 | 万元GDP能耗C11 | 0.86 |
| 都市休闲农业接待游客人次C3 | 5.33 | 工业二氧化硫去除量与产生量之比C12 | 3.79 |
| 高新技术产业产值C4 | 8.63 | 工业烟尘去除量与产生量之比C13 | 0.57 |
| 新兴服务业增加值C5 | 11.98 | 一般工业固体废物综合利用率C14 | 1.48 |
| 人均公园绿地面积C6 | 2.16 | 单位土地产出值C15 | 10.39 |
| 年空气质量良好天数C7 | 7.24 | 城市居民家庭年均可支配收入C16 | 2.77 |
| 城市人均GDP C8 | 3.42 | 每千人拥有医生C17 | 6.49 |
| 城市GDP总量C9 | 3.47 | 万人大学生人数C18 | 10.92 |
表7 高质量绿色发展障碍类型Table 7 Types of obstacles to high-quality green development |
| 类型序号 | 类型名称 | 城市 |
|---|---|---|
| 类型Ⅰ | 服务均等化水平与环境质量障碍型 | 上海 |
| 类型Ⅱ | 环境质量、土地集约与现代产业障碍型 | 南京、苏州、杭州、合肥、芜湖、马鞍山、滁州 |
| 类型Ⅲ | 创新、土地集约与产业结构障碍型 | 南通、盐城、泰州、宁波、嘉兴、湖州、绍兴、金华、台州、宣城 |
| 类型Ⅳ | 创新与环境质量障碍型 | 无锡、常州、扬州、镇江 |
| 类型Ⅴ | 创新与土地集约障碍型 | 温州、舟山、铜陵、安庆、池州 |
| [1] |
邓宏兵. 以绿色发展理念推进长江经济带高质量发展. 区域经济评论, 2018, 6: 4-7.
[
|
| [2] |
大卫·皮尔斯, 等. 绿色经济蓝图. 何晓军译, 北京: 北京师范大学出版社, 1996.
[
|
| [3] |
金乐琴. 高质量绿色发展的新理念与实现路径. 河北经贸大学学报, 2018, 39(6): 22-30.
[
|
| [4] |
丁任重. 经济增长: 资源、环境和极限问题的理论争论与人类面临的选择. 经济学家, 2005, (4): 11-19.
[
|
| [5] |
UNEP. Towards a Green Economy: Pathways to a Sustainable Development and Poverty Eradication. Nairobi Kenya Unep, 2011.
|
| [6] |
尹向飞. 新框架核算下中国省级绿色GDP增长时空演变及驱动研究. 经济地理, 2021, 41(1): 49-57.
[
|
| [7] |
窦睿音, 刘学敏, 张昱. 基于能值分析的陕西省榆林市绿色GDP动态研究. 自然资源学报, 2016, 31(6): 994-1003.
[
|
| [8] |
谭卫华, 舒银燕. 新金融发展与工业绿色转型: 基于系统GMM模型的实证分析. 经济地理, 2020, 40(11): 149-157.
[
|
| [9] |
|
| [10] |
|
| [11] |
康鹏辉, 茹少峰. 环境规制的绿色创新双边效应. 中国人口·资源与环境, 2020, 30(10): 93-104.
[
|
| [12] |
肖黎明, 张仙鹏. 强可持续理念下绿色创新效率与生态福利绩效耦合协调的时空特征. 自然资源学报, 2019, 34(2): 312-324.
[
|
| [13] |
|
| [14] |
曹靖, 张文忠. 不同时期城市创新投入对绿色经济效率的影响: 以粤港澳大湾区为例. 地理研究, 2020, 39(9): 1987-1999.
[
|
| [15] |
郭付友, 佟连军, 仇方道, 等. 鲁南经济带城乡绿色发展效率时空分异及驱动因素识别. 自然资源学报, 2020, 35(8): 1972-1985.
[
|
| [16] |
张国俊, 邓毛颖, 姚洋洋, 等. 广东省产业绿色发展的空间格局及影响因素分析. 自然资源学报, 2019, 34(8): 1593-1605.
[
|
| [17] |
周亮, 车磊, 周成虎. 中国城市绿色发展效率时空演变特征及影响因素. 地理学报, 2019, 74(10): 2027-2044.
[
|
| [18] |
张乐勤. 基于基尼系数方法的长三角区域绿色发展状况均衡性探析. 环境与可持续发展, 2021, 46(1): 102-108.
[
|
| [19] |
刘杨, 杨建梁, 梁媛. 中国城市群绿色发展效率评价及均衡特征. 经济地理, 2019, 39(2): 110-117.
[
|
| [20] |
周小亮. 高质量发展新旧动能转换机制与路径: 学术梳理的视角. 东南学术, 2020, (4): 157-168.
[
|
| [21] |
白谨豪, 刘儒, 刘启农. 基于空间均衡视角的区域高质量发展的内涵界定与状态评价. 人文地理, 2020, 35(3): 123-130.
[
|
| [22] |
樊杰, 周侃, 陈东. 生态文明建设中优化国土空间开发格局的经济地理学研究创新与应用实践. 经济地理, 2013, 33(1): 1-8.
[
|
| [23] |
祝志川, 张国超, 张君妍. 基于改进CRITIC的修正G2赋权方法及实证. 统计与决策, 2018, (18): 33-38.
[
|
| [24] |
胡碧霞, 李菁, 匡兵. 绿色发展理念下城市土地利用效率差异的演进特征及影响因素. 经济地理, 2018, 38(12): 183-189.
[
|
| [25] |
|
| [26] |
未良莉, 李超. 长江经济带经济高质量发展非均衡性研究: 基于Dagum基尼系数与空间统计方法. 合肥工业大学学报: 社会科学版, 2020, 34(3): 15-21.
[
|
| [27] |
黄和平. 基于多角度基尼系数的江西省资源环境公平性研究. 生态学报, 2012, 32(20): 6431-6439.
[
|
| [28] |
王枫, 董玉祥. 基于灰色关联投影法的土地利用多功能动态评价及障碍因子诊断: 以广州市为例. 自然资源学报, 2015, 30(10): 1698-1713.
[
|
| [29] |
张彦淑, 李立异. 陕西省绿色发展水平评价及其提升对策分析. 兰州工业学院学报, 2020, 27(6): 111-116.
[
|
| [30] |
李琳, 楚紫穗. 我国区域产业绿色发展指数评价及动态比较. 经济问题探索, 2015, (1): 68-75.
[
|
| [31] |
郭付友, 吕晓, 于伟, 等. 山东省绿色发展水平绩效评价与驱动机制: 基于17地市面板数据. 地理科学, 2020, 40(2): 200-210.
[
|
| [32] |
高红贵, 赵路. 长江经济带产业绿色发展水平测度及空间差异分析. 科技进步与对策, 2019, 36(12): 46-53.
[
|
/
| 〈 |
|
〉 |