
JOURNAL OF NATURAL RESOURCES >
Study on spatio-temporal pattern of conservation tillage on net carbon sink in China
Received date: 2021-11-01
Revised date: 2022-01-24
Online published: 2022-07-28
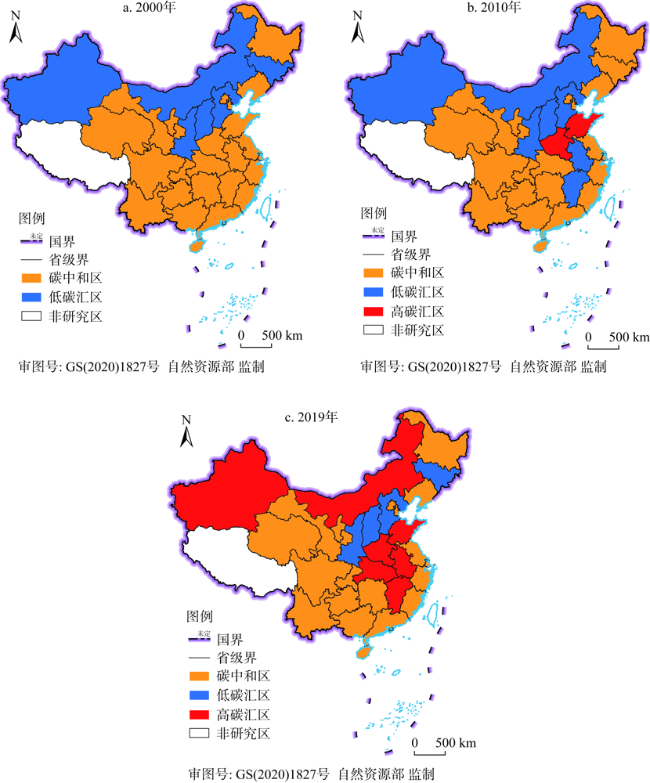
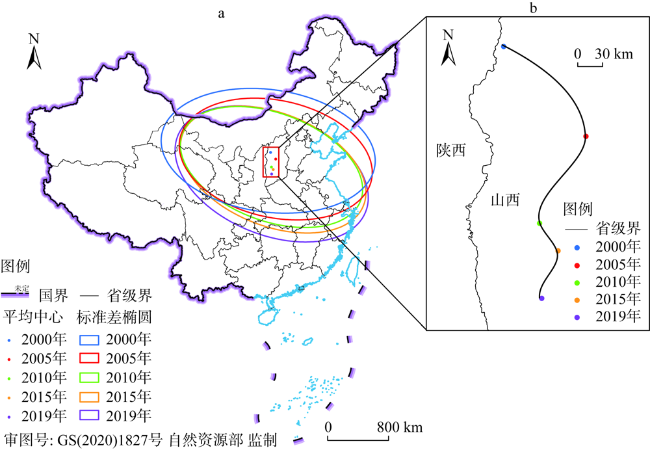
Studying the spatio-temporal patterns of net carbon sinks under conservation tillage is of great significance to the formulation of policies. Based on the analysis of the mechanism of carbon sink and emissions and the construction of its measurement method under conservation tillage, this paper analyzed the spatio-temporal pattern of net carbon sink and predicted its potential under conservation tillage from 2000 to 2019 in the provinces (autonomous regions and municipalities, hereafter provinces) of China. The results showed that: first, the carbon sink under conservation tillage is about twice the carbon emissions, soil carbon sequestration accounts for more than 2/3 of carbon sink, and biological carbon sink accounts for less than 1/3. Second, from 2000 to 2019, the net carbon sink under conservation tillage in China showed an increasing trend year by year, and the net carbon sink in North, Northwest and Southeast China increased significantly. The net carbon sink showed a trend of expansion-agglomeration-expansion in space, with the center of gravity shifting from north to south. Third, the net carbon sink under conservation tillage in the whole country had the characteristics of obvious spatial imbalance. In 2019, there was a "three-legged" pattern in North, Northwest and Southeast China. The seven provinces of Henan, Shandong, Inner Mongolia, Xinjiang, Anhui, Hubei and Jiangxi belong to high-carbon sink areas, Hebei, Jilin, Shaanxi, and Shanxi belong to low-carbon sink areas, and other provinces belong to carbon-neutrality areas. Fourth, the net carbon sink potential under conservation tillage from 2020 to 2030 will continue to increase, and the peak value will be between 57943800 t C and 79629300 t C in 2030.
XUE Cai-xia , LI Yuan-yuan , HU Chao , YAO Shun-bo . Study on spatio-temporal pattern of conservation tillage on net carbon sink in China[J]. JOURNAL OF NATURAL RESOURCES, 2022 , 37(5) : 1164 -1182 . DOI: 10.31497/zrzyxb.20220505
表1 中国农田区域划分及作物类型Table 1 China's farmland division and crop types |
| 区域 | 省(市、自治区) | 主要作物类型 |
|---|---|---|
| 东北 | 黑龙江、吉林、辽宁、内蒙古东北部 | 玉米、大豆、春小麦一熟 |
| 华北 | 北京、天津、河北、河南、山东、安徽北部、江苏北部 | 冬小麦与玉米、水稻等两熟 |
| 西北 | 山西、甘肃、陕西、宁夏、内蒙古非东北部、新疆、青海 | 冬小麦与玉米等一熟(两熟) |
| 东南 | 上海、福建、江西、浙江、湖北、湖南、广东、广西、安徽中南部、江苏中南部、海南 | 冬小麦、油菜与水稻两熟(三熟) |
| 西南 | 四川、云南、重庆、贵州 | 冬小麦、油菜与水稻两熟(三熟) |
表2 不同区域保护性耕作碳汇碳排的主要参数及来源Table 2 Parameters and sources of conservation tillage on carbon sinks and emissions in different regions |
| 区域 | 土壤固碳 | 生物固碳 | 碳排 | |||||||
|---|---|---|---|---|---|---|---|---|---|---|
| 免耕/[t C/(hm2·a)] | 秸秆还田/ [t C/(hm2·a)] | 反协同 效应系数 | 免耕/[t C/(hm2·a)] | 秸秆还田/[t C/(hm2·a)] | 减缓效 应系数 | 免耕/[t C/(hm2·a)] | 秸秆还田/[t C/(hm2·a)] | |||
| 东北 | 0.39 | 0.53 | 0.24 | -0.0179 | 0.0486 | 0.0952 | -0.1289 | 0.7725 | ||
| 华北 | 0.76 | 0.68 | -0.0309 | 0.0184 | 0.6732 | |||||
| 西北 | 0.91 | 0.41 | 0.0053 | 0.0726 | -0.0709 | |||||
| 东南 | 0.97 | 0.73 | -0.0059 | 0.0481 | 0.8873 | |||||
| 西南 | 0.88 | 0.63 | -0.0045 | 0.0323 | 0.5698 | |||||
| 数据 来源 | 高旺盛[56] | 据田康等[2]的研究结果计算 | 据张雄智等[34],李克让[54],田云等[55]的研究结果计算 | 据赵鑫[33]的研究结果计算 | 据胡立峰等[27]的研究结果计算 | 据张国等[57]的研究结果计算 | ||||
| 原始文献数/篇 | 104 | 157 | 61 | 164 | — | 52 | ||||
| 实验数据/对 | 158 | 303 | 1162 | 1006 | — | — | ||||
| 实验 类型 | 田间长期位点 | 田间长期 位点 | 大田长期位点 | — | 大田长期位点 | 大田长期位点 | ||||
表3 中国保护性耕作净碳汇的总量与结构Table 3 Quantity and structure of conservation tillage on net carbon sinks in China |
| 年份 | 土壤固碳 | 生物固碳 | 总碳汇 /万t C | 碳排 /万t C | 净碳汇 | 碳汇 /碳排 | ||||
|---|---|---|---|---|---|---|---|---|---|---|
| 总量/万t C | 占比/% | 总量/万t C | 占比/% | 总量/万t C | 增速/% | |||||
| 2000 | 1077.98 | 67.22 | 525.61 | 32.78 | 1603.58 | 808.58 | 795.00 | — | 1.98 | |
| 2001 | 1107.33 | 67.12 | 542.49 | 32.88 | 1649.82 | 849.25 | 800.57 | 0.70 | 1.94 | |
| 2002 | 1137.69 | 70.05 | 486.36 | 29.95 | 1624.05 | 783.75 | 840.30 | 4.96 | 2.07 | |
| 2003 | 1163.99 | 70.59 | 484.94 | 29.41 | 1648.93 | 798.70 | 850.23 | 1.18 | 2.06 | |
| 2004 | 1503.70 | 72.61 | 567.29 | 27.39 | 2070.99 | 1033.59 | 1037.40 | 22.01 | 2.00 | |
| 2005 | 1589.64 | 73.29 | 579.45 | 26.71 | 2169.09 | 1101.04 | 1068.05 | 2.95 | 1.97 | |
| 2006 | 1757.02 | 74.52 | 600.63 | 25.48 | 2357.66 | 1204.76 | 1152.90 | 7.94 | 1.96 | |
| 2007 | 2024.04 | 80.37 | 494.28 | 19.63 | 2518.31 | 1215.08 | 1303.24 | 13.04 | 2.07 | |
| 2008 | 2039.88 | 77.92 | 577.98 | 22.08 | 2617.87 | 1239.15 | 1378.72 | 5.79 | 2.11 | |
| 2009 | 2276.07 | 79.50 | 587.01 | 20.50 | 2863.09 | 1400.87 | 1462.21 | 6.06 | 2.04 | |
| 2010 | 2575.81 | 78.10 | 722.41 | 21.90 | 3298.22 | 1600.53 | 1697.69 | 16.10 | 2.06 | |
| 2011 | 2852.57 | 76.61 | 870.82 | 23.39 | 3723.39 | 1775.19 | 1948.19 | 14.76 | 2.10 | |
| 2012 | 3122.82 | 78.29 | 866.21 | 21.71 | 3989.03 | 1969.03 | 2020.00 | 3.69 | 2.03 | |
| 2013 | 3202.95 | 74.98 | 1068.73 | 25.02 | 4271.68 | 2099.03 | 2172.65 | 7.56 | 2.04 | |
| 2014 | 3609.11 | 72.67 | 1357.08 | 27.33 | 4966.19 | 2431.81 | 2534.38 | 16.65 | 2.04 | |
| 2015 | 3854.83 | 72.33 | 1474.48 | 27.67 | 5329.31 | 2612.12 | 2717.19 | 7.21 | 2.04 | |
| 2016 | 4031.24 | 72.20 | 1552.41 | 27.80 | 5583.65 | 2741.05 | 2842.60 | 4.62 | 2.04 | |
| 2017 | 4236.25 | 71.18 | 1715.25 | 28.82 | 5951.51 | 2849.53 | 3101.97 | 9.12 | 2.09 | |
| 2018 | 4339.29 | 70.71 | 1797.63 | 29.29 | 6136.92 | 2897.30 | 3239.63 | 4.44 | 2.12 | |
| 2019 | 4472.77 | 69.65 | 1949.11 | 30.35 | 6421.88 | 3049.83 | 3372.05 | 4.09 | 2.11 | |
表4 中国保护性耕作净碳汇的标准差椭圆参数Table 4 Standard deviation ellipse parameters of conservation tillage on net carbon sink in China |
| 年份 | 重心经度/(°) | 重心纬度/(°) | 长半轴 /km | 短半轴 /km | 椭圆面积 /万km2 | 旋转角/(°) | 密度 /(t C/km2) | 形状指数 (短轴/长轴) |
|---|---|---|---|---|---|---|---|---|
| 2000 | 110.85 | 38.64 | 1413.53 | 803.13 | 356.62 | 97.90 | 2.23 | 0.57 |
| 2005 | 111.90 | 37.66 | 1285.75 | 767.90 | 310.15 | 102.39 | 3.44 | 0.60 |
| 2010 | 111.11 | 36.79 | 1250.00 | 705.76 | 277.13 | 110.59 | 6.13 | 0.56 |
| 2015 | 111.33 | 36.49 | 1275.99 | 739.05 | 296.24 | 111.68 | 9.17 | 0.58 |
| 2019 | 111.06 | 36.00 | 1329.63 | 797.83 | 333.24 | 112.17 | 10.12 | 0.60 |
表5 不同情境下中国保护性耕作的发展Table 5 Development of conservation tillage in different situations in China |
| 情景设置 | 情景I | 情景II | ||||
|---|---|---|---|---|---|---|
| 时间段/年 | 2020—2025 | 2016—2030 | 2020—2025 | 2016—2030 | ||
| 东北地区 | 至期末达到70% | 保持70% | 至期末达到70% | 保持70% | ||
| 北方其他地区及苏北皖北 | 自然增长 | 自然增长 | 自然增长 | 至期末达到70% | ||
| 南方其他地区 | 自然增长 | 自然增长 | 自然增长 | 自然增长 | ||
表6 中国保护性耕作净碳汇潜力预测Table 6 Prediction of conservation tillage on net carbon sink potential in China (万t C) |
| 年份 | 情景I | 情景II | |||||
|---|---|---|---|---|---|---|---|
| 碳汇 | 碳排 | 净碳汇 | 碳汇 | 碳排 | 净碳汇 | ||
| 2020 | 6291.39 | 2860.98 | 3430.41 | 6291.39 | 2860.98 | 3430.41 | |
| 2021 | 7038.15 | 3193.48 | 3844.67 | 7038.15 | 3193.48 | 3844.67 | |
| 2022 | 7732.43 | 3511.81 | 4220.61 | 7732.43 | 3511.81 | 4220.61 | |
| 2023 | 8289.48 | 3793.14 | 4496.34 | 8289.48 | 3793.14 | 4496.34 | |
| 2024 | 8846.54 | 4074.46 | 4772.08 | 8846.54 | 4074.46 | 4772.08 | |
| 2025 | 9403.88 | 4355.71 | 5048.17 | 9403.88 | 4355.71 | 5048.17 | |
| 2026 | 9666.47 | 4470.29 | 5196.18 | 9684.06 | 4384.31 | 5399.75 | |
| 2027 | 9930.67 | 4584.93 | 5345.74 | 10295.29 | 4407.78 | 5887.51 | |
| 2028 | 10194.83 | 4699.57 | 5495.27 | 10959.90 | 4453.34 | 6506.56 | |
| 2029 | 10459.02 | 4814.20 | 5644.81 | 11721.33 | 4508.53 | 7212.80 | |
| 2030 | 10723.22 | 4928.84 | 5794.38 | 12521.36 | 4558.43 | 7962.93 | |
| [1] |
IPCC. Climate Change 2007:The physical science basis. Contribution of Working Group I to the Fourth Assessment Report of the Intergovernmental Panel on Climate Change. Cambridge: Cambridge University Press, 2007: 1-18.
|
| [2] |
田康, 赵永存, 邢喆, 等. 中国保护性耕作农田土壤有机碳变化速率研究: 基于长期试验点的Meta分析. 土壤学报, 2013, 50(3): 433-440.
[
|
| [3] |
|
| [4] |
田成诗, 陈雨. 中国省际农业碳排放测算及低碳化水平评价: 基于衍生指标与TOPSIS法的运用. 自然资源学报, 2021, 36(2): 395-410.
[
|
| [5] |
|
| [6] |
|
| [7] |
|
| [8] |
|
| [9] |
|
| [10] |
|
| [11] |
|
| [12] |
|
| [13] |
|
| [14] |
王海候, 金梅娟, 陆长婴, 等. 秸秆还田模式对农田土壤碳库特性及产量的影响. 自然资源学报, 2017, 32(5): 755-764.
[
|
| [15] |
|
| [16] |
|
| [17] |
|
| [18] |
|
| [19] |
|
| [20] |
|
| [21] |
|
| [22] |
|
| [23] |
|
| [24] |
|
| [25] |
|
| [26] |
张冉, 赵鑫, 濮超, 等. 中国农田秸秆还田土壤N2O排放及其影响因素的Meta分析. 农业工程学报, 2015, 31(22): 1-6.
[
|
| [27] |
胡立峰, 李洪文, 高焕文. 保护性耕作对温室效应的影响. 农业工程学报, 2009, 25(5): 308-312.
[
|
| [28] |
|
| [29] |
|
| [30] |
|
| [31] |
|
| [32] |
|
| [33] |
赵鑫. 基于Meta-analysis对我国保护性耕作农田土壤固碳减排效应及其潜力的研究. 北京: 中国农业大学, 2017.
[
|
| [34] |
张雄智, 李帅帅, 刘冰洋, 等. 免耕与秸秆还田对中国农田固碳和作物产量的影响. 中国农业大学学报, 2020, 25(5): 1-12.
[
|
| [35] |
|
| [36] |
何培培, 张俊飚, 何可, 等. 农业生产何以存在低碳效率幻觉? 来自1997-2016年31个省份面板数据的证据. 自然资源学报, 2020, 35(9): 2205-2217.
[
|
| [37] |
|
| [38] |
陈罗烨, 薛领, 雪燕. 中国农业净碳汇时空演化特征分析. 自然资源学报, 2016, 31(4): 596-607.
[
|
| [39] |
|
| [40] |
|
| [41] |
|
| [42] |
|
| [43] |
|
| [44] |
|
| [45] |
|
| [46] |
|
| [47] |
|
| [48] |
|
| [49] |
|
| [50] |
|
| [51] |
|
| [52] |
|
| [53] |
|
| [54] |
李克让. 土地利用变化和温室气体净排放与陆地生态系统碳循环. 北京: 气象出版社, 2002: 260-261.
[
|
| [55] |
田云, 张俊飚, 吴贤荣, 等. 中国种植业碳汇盈余动态变化及地区差异分析: 基于31个省(市、区)2000-2012年的面板数据. 自然资源学报, 2015, 30(11): 1885-1895.
[
|
| [56] |
高旺盛. 中国保护性耕作制. 北京: 中国农业大学出版社, 2011: 199-200.
[
|
| [57] |
张国, 王效科. 我国保护性耕作对农田温室气体排放影响研究进展. 农业环境科学学报, 2020, 39(4): 872-881.
[
|
| [58] |
|
| [59] |
|
| [60] |
易中懿, 曹光乔, 张宗毅, 等. 中国农业机械化年鉴. 北京: 中国农业科学技术出版社, 2011: 1-14.
[
|
| [61] |
赵敏娟. 兼顾农业现代化和低碳发展有多难. 经济日报, 2021-11-03( 11).
[
|
| [62] |
王艳, 施六林, 王川. 安徽省保护性耕作与节水农业技术研究. 节水灌溉, 2010, (11): 53-55.
[
|
| [63] |
黄国勤. 江西农田保护性耕作的发展. 耕作与栽培, 2011, (4): 39-41.
[
|
| [64] |
赵作权. 地理空间分布整体统计研究进展. 地理科学进展, 2009, 28(1): 1-8.
[
|
| [65] |
|
| [66] |
|
/
| 〈 |
|
〉 |


