
JOURNAL OF NATURAL RESOURCES >
The measurement and its distribution dynamic evolution of grain production efficiency in China under the goal of reducing pollution emissions and increasing carbon sink
Received date: 2021-05-24
Revised date: 2021-08-08
Online published: 2022-05-28
Copyright
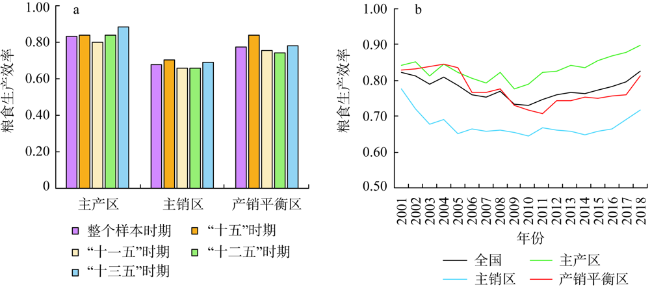
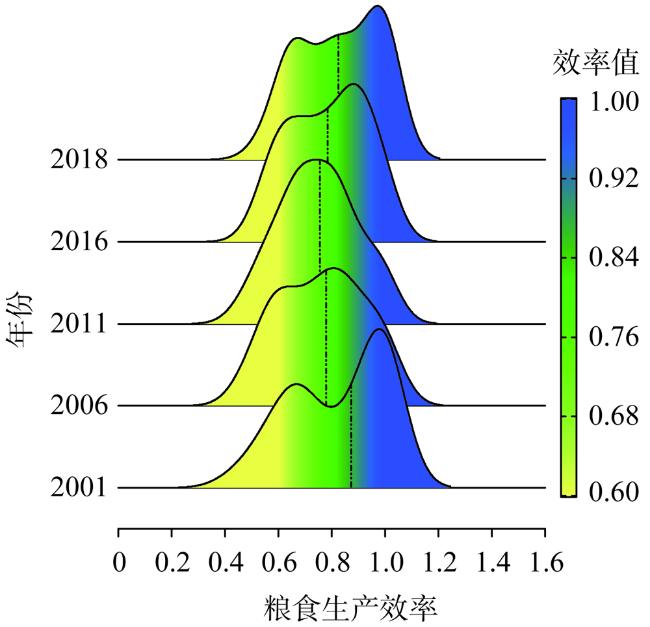
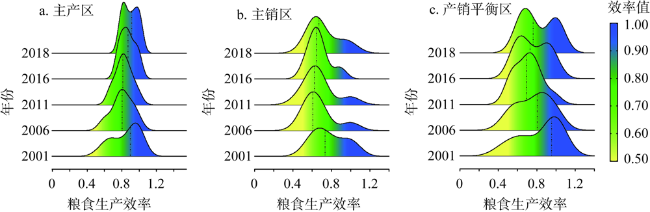
Considering the net carbon sink and non-point source pollution emissions in grain production, this paper constructs a global EBM model to calculate the grain production efficiency of 30 provincial-level regions and three functional areas in China from 2001 to 2018, and investigates the dynamic evolution trend of China's grain production efficiency with the help of dynamic distribution model. The results show that: (1) The overall level of grain production efficiency in China is not high, showing a trend of first decreasing and then increasing during the sample period, and the grain production efficiency in the main producing areas is higher than that in the main selling areas and the production and marketing balance areas. (2) There are differences in the distribution dynamics of grain production efficiency among the three functional areas. The main production areas change to "two-level differentiation" from "multi-level differentiation", and the regional gap is gradually narrowing. The differentiation degree of the main sales areas has been intensified. The "multi-level differentiation" in the production and marketing balance area has been gradually strengthened. (3) China's grain production efficiency has a trend of gathering to medium and high levels. Compared with the provinces with high efficiency, those with low efficiency have obvious "poverty trap", and the vicious circle of low-level food development is not easy to break.
YANG Qian , SI Xiang-hui , WANG Jue . The measurement and its distribution dynamic evolution of grain production efficiency in China under the goal of reducing pollution emissions and increasing carbon sink[J]. JOURNAL OF NATURAL RESOURCES, 2022 , 37(3) : 600 -615 . DOI: 10.31497/zrzyxb.20220304
表1 碳排放系数Table 1 Carbon emission coefficient |
| 碳排放源 | 碳排放系数 |
|---|---|
| 化肥 | 0.8956 kg C·kg-1 |
| 农药 | 4.9341 kg C·kg-1 |
| 农膜 | 5.18 kg C·kg-1 |
| 柴油 | 0.5927 kg C·kg-1 |
| 灌溉 | 266.48 kg C·hm-2 |
| 翻耕 | 312.6 kg C·hm-2 |
注:根据IPCC(2006)发布的碳排放系数整理所得。 |
表3 变量描述性统计Table 3 Descriptive statistics of variables |
| 变量 | 单位 | 观测数/个 | 均值 | 标准差 | 最大值 | 最小值 |
|---|---|---|---|---|---|---|
| 粮食作物播种面积 | 千hm2 | 540 | 3678.566 | 2885.305 | 14283.080 | 55.640 |
| 粮食种植业劳动人数 | 万人 | 540 | 352.739 | 268.611 | 1480.159 | 9.411 |
| 机械总动力 | 万kW | 540 | 1967.423 | 2008.370 | 9863.674 | 39.686 |
| 农药使用量 | 万t | 540 | 3.568 | 2.901 | 11.641 | 0.088 |
| 化肥施用折纯量 | 万t | 540 | 120.251 | 99.617 | 538.312 | 3.397 |
| 农用塑料薄膜使用量 | 万t | 540 | 47216.500 | 43448.287 | 229174.530 | 380.645 |
| 粮食种植业用水量 | 亿m3 | 540 | 79.284 | 59.644 | 304.555 | 2.252 |
| 粮食产量 | 万t | 540 | 1856.103 | 1553.349 | 7615.780 | 34.140 |
| 净碳汇 | 万t | 540 | 1360.501 | 1285.996 | 6251.572 | 24.264 |
| 面源污染指数 | — | 540 | 0.033 | 0.006 | 0.049 | 0.027 |
注:根据各省统计年鉴、《中国水资源公报》和《中国统计年鉴》整理计算所得。 |
表4 2001—2018年全国及各个省份的粮食生产效率Table 4 Grain production efficiency of China and its provincial-level regions in 2001-2018 |
| 地区 | 2001年 | 2004年 | 2007年 | 2010年 | 2013年 | 2016年 | 2018年 | 均值 | 变化率/% | 排名 |
|---|---|---|---|---|---|---|---|---|---|---|
| 北京 | 0.570 | 0.521 | 0.591 | 0.599 | 0.684 | 0.681 | 0.669 | 0.613 | 0.945 | 25 |
| 天津 | 0.653 | 0.640 | 0.603 | 0.617 | 0.642 | 0.702 | 0.878 | 0.661 | 1.761 | 23 |
| 河北 | 0.549 | 0.553 | 0.592 | 0.625 | 0.706 | 0.743 | 0.798 | 0.640 | 2.233 | 24 |
| 山西 | 0.446 | 0.648 | 0.535 | 0.527 | 0.595 | 0.607 | 0.657 | 0.575 | 2.307 | 28 |
| 内蒙古 | 0.899 | 1.000 | 0.866 | 0.828 | 0.891 | 0.939 | 1.000 | 0.918 | 0.630 | 7 |
| 辽宁 | 0.655 | 0.802 | 0.751 | 0.697 | 0.856 | 0.844 | 0.811 | 0.766 | 1.267 | 18 |
| 吉林 | 1.000 | 1.000 | 0.868 | 0.869 | 0.989 | 1.000 | 0.924 | 0.958 | -0.461 | 3 |
| 黑龙江 | 0.940 | 0.919 | 0.855 | 0.981 | 1.000 | 1.000 | 1.000 | 0.954 | 0.362 | 4 |
| 上海 | 1.000 | 1.000 | 0.948 | 1.000 | 0.963 | 0.886 | 1.000 | 0.963 | 0.000 | 1 |
| 江苏 | 0.847 | 0.805 | 0.762 | 0.749 | 0.773 | 0.786 | 0.831 | 0.783 | -0.117 | 16 |
| 浙江 | 0.734 | 0.689 | 0.667 | 0.679 | 0.640 | 0.644 | 0.675 | 0.676 | -0.490 | 21 |
| 安徽 | 0.694 | 0.678 | 0.673 | 0.663 | 0.723 | 0.779 | 0.794 | 0.711 | 0.791 | 20 |
| 福建 | 0.657 | 0.616 | 0.595 | 0.585 | 0.598 | 0.592 | 0.628 | 0.604 | -0.269 | 26 |
| 江西 | 1.000 | 0.827 | 0.798 | 0.783 | 0.881 | 0.881 | 1.000 | 0.858 | 0 | 11 |
| 山东 | 0.648 | 0.703 | 0.726 | 0.772 | 0.821 | 0.884 | 0.914 | 0.773 | 2.045 | 17 |
| 河南 | 0.791 | 0.875 | 0.958 | 0.882 | 0.894 | 0.962 | 1.000 | 0.899 | 1.392 | 8 |
| 湖北 | 1.000 | 1.000 | 0.766 | 0.741 | 0.774 | 0.784 | 0.818 | 0.830 | -1.177 | 13 |
| 湖南 | 1.000 | 0.850 | 0.816 | 0.822 | 0.818 | 0.836 | 0.865 | 0.850 | -0.850 | 12 |
| 广东 | 0.827 | 0.700 | 0.697 | 0.600 | 0.603 | 0.628 | 0.638 | 0.668 | -1.514 | 22 |
| 广西 | 1.000 | 0.906 | 0.836 | 0.713 | 0.712 | 0.653 | 0.664 | 0.785 | -2.382 | 15 |
| 海南 | 1.000 | 0.670 | 0.503 | 0.443 | 0.492 | 0.528 | 0.545 | 0.553 | -3.507 | 29 |
| 重庆 | 1.000 | 1.000 | 0.869 | 0.832 | 0.864 | 0.902 | 1.000 | 0.898 | 0 | 10 |
| 四川 | 0.950 | 0.988 | 0.881 | 0.858 | 0.849 | 0.872 | 0.929 | 0.898 | -0.132 | 9 |
| 贵州 | 1.000 | 1.000 | 0.910 | 0.855 | 0.864 | 0.993 | 1.000 | 0.923 | 0 | 5 |
| 云南 | 0.681 | 0.628 | 0.576 | 0.529 | 0.571 | 0.565 | 0.633 | 0.591 | -0.427 | 27 |
| 陕西 | 0.692 | 0.824 | 0.788 | 0.756 | 0.732 | 0.757 | 0.771 | 0.757 | 0.641 | 19 |
| 甘肃 | 0.553 | 0.548 | 0.455 | 0.509 | 0.566 | 0.587 | 0.649 | 0.549 | 0.941 | 30 |
| 青海 | 1.000 | 0.930 | 0.961 | 0.668 | 0.663 | 0.704 | 0.752 | 0.809 | -1.666 | 14 |
| 宁夏 | 0.913 | 1.000 | 0.907 | 0.826 | 0.869 | 0.926 | 1.000 | 0.921 | 0.538 | 6 |
| 新疆 | 1.000 | 0.971 | 0.848 | 0.960 | 1.000 | 0.889 | 1.000 | 0.959 | 0 | 2 |
| 主产区 | 0.844 | 0.846 | 0.793 | 0.790 | 0.844 | 0.870 | 0.899 | 0.834 | 0.370 | 1 |
| 主销区 | 0.777 | 0.691 | 0.658 | 0.646 | 0.660 | 0.666 | 0.719 | 0.677 | -0.457 | 3 |
| 平衡区 | 0.828 | 0.846 | 0.769 | 0.718 | 0.744 | 0.758 | 0.813 | 0.777 | -0.114 | 2 |
| 全国 | 0.823 | 0.810 | 0.753 | 0.732 | 0.768 | 0.785 | 0.828 | 0.778 | 0.034 | — |
注:限于篇幅,没有列出全部年份数据备索。 |
表5 中国粮食生产效率的马尔科夫链转移概率矩阵Table 5 Markov chain transfer probability matrix of grain production efficiency in China |
| 时间跨度 | 类型 | 低 | 中低 | 中高 | 高 |
|---|---|---|---|---|---|
| T=1 | 低 | 0.831 | 0.169 | 0.000 | 0.000 |
| 中低 | 0.081 | 0.721 | 0.191 | 0.007 | |
| 中高 | 0.000 | 0.059 | 0.684 | 0.257 | |
| 高 | 0.000 | 0.029 | 0.353 | 0.618 | |
| T=2 | 低 | 0.820 | 0.172 | 0.008 | 0.000 |
| 中低 | 0.078 | 0.688 | 0.227 | 0.008 | |
| 中高 | 0.000 | 0.125 | 0.625 | 0.250 | |
| 高 | 0.010 | 0.063 | 0.323 | 0.604 | |
| T=3 | 低 | 0.800 | 0.183 | 0.017 | 0.000 |
| 中低 | 0.100 | 0.642 | 0.242 | 0.017 | |
| 中高 | 0.000 | 0.158 | 0.575 | 0.267 | |
| 高 | 0.000 | 0.056 | 0.400 | 0.544 | |
| T=4 | 低 | 0.750 | 0.232 | 0.018 | 0.000 |
| 中低 | 0.125 | 0.607 | 0.259 | 0.009 | |
| 中高 | 0.000 | 0.170 | 0.527 | 0.304 | |
| 高 | 0.012 | 0.071 | 0.417 | 0.500 | |
| T=5 | 低 | 0.731 | 0.250 | 0.019 | 0.000 |
| 中低 | 0.154 | 0.558 | 0.279 | 0.010 | |
| 中高 | 0.000 | 0.183 | 0.490 | 0.327 | |
| 高 | 0.013 | 0.128 | 0.333 | 0.526 |
| [1] |
陈秧分, 王介勇, 张凤荣, 等. 全球化与粮食安全新格局. 自然资源学报, 2021,36(6):1362-1380.
[
|
| [2] |
陈秧分, 王介勇. 对外开放背景下中国粮食安全形势研判与战略选择. 自然资源学报, 2021,36(6):1616-1630.
[
|
| [3] |
杨锦英, 韩晓娜, 方行明. 中国粮食生产效率实证研究. 经济学动态, 2013, (6):47-53.
[
|
| [4] |
刘立涛, 刘晓洁, 伦飞, 等. 全球气候变化下的中国粮食安全问题研究. 自然资源学报, 2018,33(6):927-939.
[
|
| [5] |
成升魁, 李云云, 刘晓洁, 等. 关于新时代我国粮食安全观的思考. 自然资源学报, 2018,33(6):911-926.
[
|
| [6] |
李谷成, 范丽霞, 闵锐. 资源, 环境与农业发展的协调性: 基于环境规制的省级农业环境效率排名. 数量经济技术经济研究, 2011, (10):21-36.
[
|
| [7] |
闵锐, 李谷成. “两型”视角下我国粮食生产技术效率的空间分异. 经济地理, 2013,33(3):144-149.
[
|
| [8] |
张利国, 鲍丙飞. 我国粮食主产区粮食全要素生产率时空演变及驱动因素. 经济地理, 2016,36(3):147-152.
[
|
| [9] |
赵丽平, 王雅鹏, 何可. 我国粮食生产的环境技术效率测度. 华南农业大学学报: 社会科学版, 2016,15(3):28-37.
[
|
| [10] |
钱宸, 李凡, 李先德, 等. 基于农户经济和环境“双优”目标的粮食主产区化肥施用优化模拟分析: 以邯郸地区小麦生产为例. 自然资源学报, 2021,36(6):1481-1493.
[
|
| [11] |
田云, 张俊飚. 中国农业生产净碳效应分异研究. 自然资源学报, 2013,28(8):1298-1309.
[
|
| [12] |
陈罗烨, 薛领, 雪燕. 中国农业净碳汇空间集聚与分异. 生态环境学报, 2015,24(11):1777-1784.
[
|
| [13] |
杨果, 陈瑶. 中国农业源碳汇估算及其与农业经济发展的耦合分析. 中国人口·资源与环境, 2016,26(12):171-176.
[
|
| [14] |
刘允芬. 农业生态系统碳循环研究. 自然资源学报, 1995,10(1):1-8.
[
|
| [15] |
谢淑娟, 匡耀求, 黄宁生. 中国发展碳汇农业的主要路径与政策建议. 中国人口·资源与环境, 2010,20(12):46-51.
[
|
| [16] |
丁文斌, 徐通, 王雅鹏. 粮食主产省粮食生产投入要素效率DEA分析: 基于1990—2004年湖北省投入要素的实证分析. 西北农林科技大学学报: 社会科学版, 2007,7(4):56-60.
[
|
| [17] |
魏丹, 王雅鹏. 粮食主产省粮食生产要素配置效率评价. 统计与决策, 2011, (2):60-63.
[
|
| [18] |
杨林, 许丹. 基于粮食生产效率的财政补贴政策地区差异化研究. 经济学动态, 2011, (12):81-84.
[
|
| [19] |
肖红波, 王济民. 新世纪以来我国粮食综合技术效率和全要素生产率分析. 农业技术经济, 2012, (1):36-46.
[
|
| [20] |
|
| [21] |
曾福生, 高鸣. 我国粮食生产效率核算及其影响因素分析: 基于SBM-Tobit模型二步法的实证研究. 农业技术经济, 2012, (7):63-70.
[
|
| [22] |
陈宝珍, 任金政. 粮食生产生态效率测算与改善路径. 江苏农业学报, 2019,35(1):211-218.
[
|
| [23] |
李思勉, 何蒲明. 我国粮食绿色生产效率及影响因素研究: 基于粮食功能区的比较分析. 生态经济, 2020,36(9):116-120.
[
|
| [24] |
|
| [25] |
杨国涛, 张特, 东梅. 中国农业生产效率与减贫效率研究. 数量经济技术经济研究, 2020,37(4):46-65.
[
|
| [26] |
|
| [27] |
师博, 沈坤荣. 城市化、产业集聚与EBM能源效率. 产业经济研究, 2012, (6):10-16.
[
|
| [28] |
李兰冰, 刘秉镰. 中国高技术产业的效率评价与成因识别. 经济学动态, 2014, (9):56-65.
[
|
| [29] |
刘华军, 郭立祥, 乔列成, 等. 中国物流业效率的时空格局及动态演进. 数量经济技术经济研究, 2021,38(5):57-74.
[
|
| [30] |
田旭, 王善高. 中国粮食生产环境效率及其影响因素分析. 资源科学, 2016,38(11):2106-2116.
[
|
| [31] |
乔世君. 中国粮食生产技术效率的实证研究: 随机前沿面生产函数的应用. 数理统计与管理, 2004, (3):11-16.
[
|
| [32] |
马林静, 王雅鹏, 吴娟. 中国粮食生产技术效率的空间非均衡与收敛性分析. 农业技术经济, 2015, (4):4-12.
[
|
| [33] |
谭忠昕, 郭翔宇. 基于超效率DEA方法的中国粮食生产效率评价分析. 农业现代化研究, 2019,40(3):431-440.
[
|
| [34] |
王美知, 魏凤. 哈萨克斯坦粮食生产效率动态演进及区域差异. 自然资源学报, 2021,36(3):594-605.
[
|
| [35] |
|
| [36] |
|
| [37] |
|
| [38] |
范丽霞. 中国粮食全要素生产率的分布动态与趋势演进: 基于1978—2012年省级面板数据的实证. 农村经济, 2017, (3):49-54.
[
|
| [39] |
李波, 张俊飚, 李海鹏. 中国农业碳排放时空特征及影响因素分解. 中国人口·资源与环境, 2011,21(8):80-86.
[
|
| [40] |
刘华军, 鲍振, 杨骞. 中国农业碳排放的地区差距及其分布动态演进: 基于Dagum基尼系数分解与非参数估计方法的实证研究. 农业技术经济, 2013, (3):72-81.
[
|
| [41] |
李波, 王春妤, 张俊飚. 中国农业净碳汇效率动态演进与空间溢出效应. 中国人口·资源与环境, 2019,29(12):68-76.
[
|
| [42] |
田云, 张俊飚, 罗小锋. 中国种植业净碳效益与经济效益协调性区域比较研究. 经济地理, 2014,34(3):142-148.
[
|
| [43] |
尚杰, 杨滨键. 种植业碳源、碳汇测算与净碳汇影响因素动态分析: 山东例证. 改革, 2019, (6):123-134.
[
|
| [44] |
赖斯芸, 杜鹏飞, 陈吉宁. 基于单元分析的非点源污染调查评估方法. 清华大学学报: 自然科学版, 2004,44(9):1184-1187.
[
|
| [45] |
陈敏鹏, 陈吉宁, 赖斯芸. 中国农业和农村污染的清单分析与空间特征识别. 中国环境科学, 2006, (6):751-755.
[
|
| [46] |
葛鹏飞, 王颂吉, 黄秀路. 中国农业绿色全要素生产率测算. 中国人口·资源与环境, 2018,28(5):66-74.
[
|
/
| 〈 |
|
〉 |