
JOURNAL OF NATURAL RESOURCES >
New approach of sustainability evaluation: A Chinese case study of the "Doughnut Theory"
Received date: 2020-12-01
Request revised date: 2021-04-12
Online published: 2022-02-16
Copyright
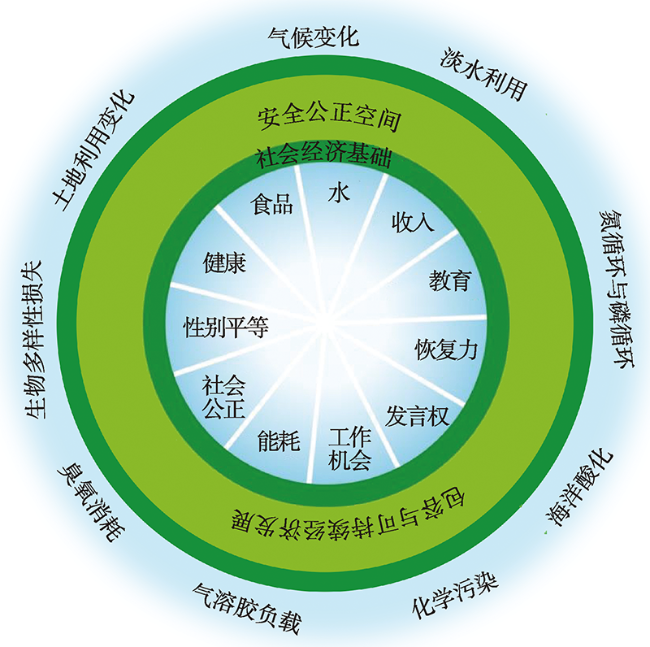
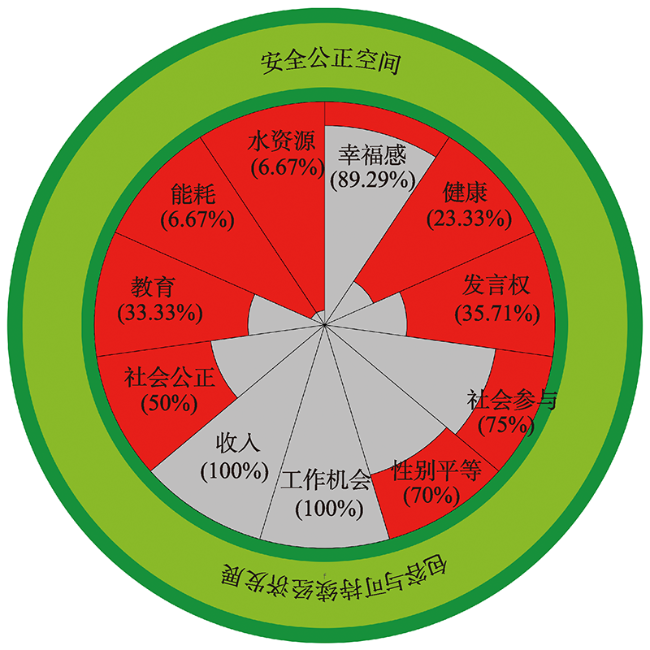
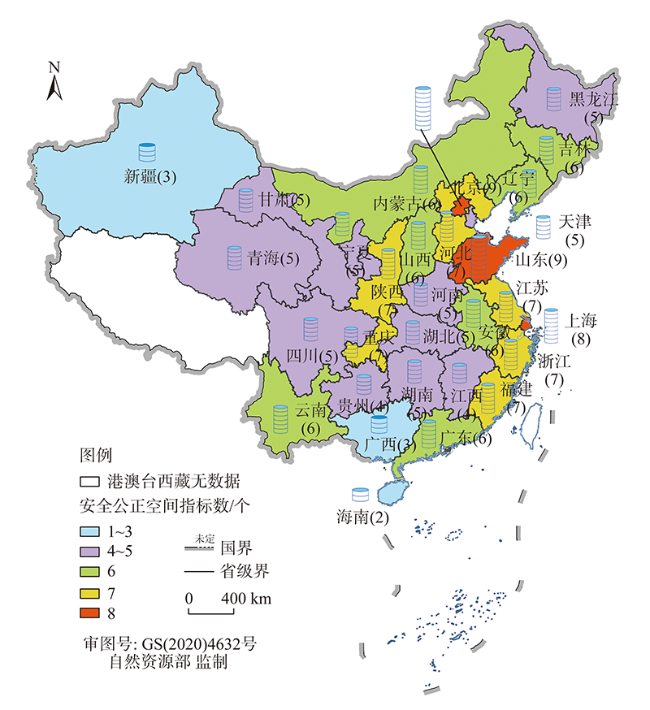
The socio-economic sphere is an indispensable part of Planetary Boundary (PB) sustainability evaluation system. In this context, this article makes a comprehensive review of theoretical and empirical literature regarding the existing socio-economic sphere. First, an evaluation has been made for a total of 15 socio-economic sphere dimensions proposed by the "Doughnut Theory". Second, based on the different types of research samples in terms of industrial, national, and cross-country aspects, we illustrated and analyzed one or more specific indicators corresponding to each dimension. Finally, we summarize the indicator threshold setting methods, including the continuation of conventions, the reference of experiences and the reference of typical samples. On the basis of summarizing and evaluating previous research results, this article takes 30 provinces, autonomous regions, and municipalities in China as samples for the first time, using statistical yearbooks and the Chinese General Social Survey (CGSS) data to compare the corresponding indicators in the "Twelfth Five-Year Plan" (2011-2015) official document as the threshold, so that the sustainability status of China's socio-economic sphere under the PB framework has been evaluated. The results show that China has reached the optimal state in terms of income level and job opportunities, and the poverty problem has been partially alleviated, but the performance of water resources and energy consumption is not good. In terms of the improvement of sustainability level, Southern China shows a trend of "from west to east", while Northern China presents a trend of "from north to south". The socio-economic sphere needs to be further improved in terms of content enrichment, theoretical deepening, and objective setting of thresholds.
SHAO Qing-long , LI Mo , KANG Peng , GUO Hai-nan . New approach of sustainability evaluation: A Chinese case study of the "Doughnut Theory"[J]. JOURNAL OF NATURAL RESOURCES, 2022 , 37(2) : 334 -347 . DOI: 10.31497/zrzyxb.20220205
表1 行星边界体系下社会经济系统维度的选取Table 1 Selection of socio-economic dimensions under the planetary boundary framework |
| 作者 | 社会经济系统维度 | ||||||||||||||
|---|---|---|---|---|---|---|---|---|---|---|---|---|---|---|---|
| 水资源 | 收入 | 教育 | 恢复力 | 发言权 | 工作 机会 | 能耗 | 社会 公正 | 性别 平等 | 健康 | 食品 | 幸福感 | 社会 参与 | 流动与 联通 | 公共 安全 | |
| Raworth[20] | √ | √ | √ | √ | √ | √ | √ | √ | √ | √ | √ | ||||
| Dearing等[27] | √ | √ | √ | √ | √ | √ | √ | ||||||||
| Cole等[28] | √ | √ | √ | √ | √ | √ | √ | √ | √ | √ | |||||
| Hoornweg等[25] | √ | √ | √ | √ | √ | √ | √ | √ | √ | ||||||
| O'Neill等[26] | √ | √ | √ | √ | √ | √ | √ | √ | √ | √ | |||||
表2 社会经济系统指标阈值的设定Table 2 Threshold setting for socio-economic sphere indicators |
| 指标 | 阈值的设定 | 文献来源 |
|---|---|---|
| 水资源 | 100%家庭在200 m范围内可以用到自来水 | Cole等[28] |
| 收入 | 国家贫困线(每人每月577兰特)以上的人口占比 | Cole等[28] |
| 95%的人口每天收入高于1.90美元 | O'Neill等[26] | |
| 教育 | 拥有7年以上教育经历的成人(20岁以上) | Cole等[28] |
| 95%的适龄人口初中入学率 | O'Neill等[26] | |
| 发言权 | 0.8以上 | O'Neill等[26] |
| 工作机会 | 15~64岁成人就业率 | Cole等[28] |
| 年轻人失业率低于12.8% | Hoornweg等[25] | |
| 失业率低于6% | Hoornweg等[25] O'Neill等[26] | |
| 能耗 | 100%的家庭可以用到电 | Cole等[28] |
| 能源强度低于8.9 | Hoornweg等[25] | |
| 95%的人口可以用到电 | O'Neill等[26] | |
| 社会公正 | 100%家庭有产权房或电冰箱 | Cole等[28] |
| 基尼系数在0.2以下;居住在贫民窟的人口占比在18%以内 | Hoornweg等[25] | |
| 基尼系数在0.3以下 | O'Neill等[26] | |
| 性别平等 | 女性入学率在95%以上 | Hoornweg等[25] |
| 健康 | 1岁以下婴儿的疫苗接种率;100%家庭有马桶或通风坑厕 | Cole等[28] |
| 5岁以下婴儿死亡率低于17% | Hoornweg等[25] | |
| 人均预期寿命65岁以上;95%的人口可获得优质的医疗设备和条件 | O'Neill等[26] | |
| 食品 | 100%家庭拥有充足食物 | Cole等[28] |
| 每人每天2700 cal以上 | O'Neill等[26] | |
| 幸福感 | 坎特里尔阶梯表(0~10之间)6.5以上 | O'Neill等[26] |
| 社会参与 | 90%以上的人口可以获得家人和朋友的支持 | O'Neill等[26] |
| 流动与联通 | 人均家庭汽车拥有量高于0.2;人均每天乘载公共交通的次数高于0.35;使用互联网的人口比例高于50%;每十万人中交通事故死亡人数低于8.6 | Hoornweg等[25] |
| 公共安全 | 晚上在家附近散步时的安全感程度 | Cole等[28] |
| 每十万人中火灾死亡人数低于0.5;每十万人中凶杀案死亡人数低于3.05 | Hoornweg等[25] |
表3 2015年中国社会经济系统指标的定义、选取标准、阈值以及数据来源Table 3 Definitions, selection criteria, thresholds, and data sources for the socio-economic sphere indicators in China in 2015 |
| 社会经济指标 | 单位 | 指标选取标准 | 阈值 | 数据来源 |
|---|---|---|---|---|
| 幸福感 | % | 问题A36:“总的来说,您觉得您的生活是否幸福?” 将选择“比较幸福”和“非常幸福”的受访者比例作为幸福标准 | 各省/自治区/直辖市70% 以上人口占比 | CGSS2015 |
| 发言权 | % | 问题A44:“上次居委会选举/村委会选举,您是否参加了投票?” 将回答“是”的受访者比率作为拥有发言权的标准 | 49.6%以上的居民参与过上次的居委会或村委会选举 | |
| 社会参与 | % | 问题A61:“您目前是否参加了城市/农村基本养老保险?” 将回答“参加了”的受访者比例作为社会参与标准 | 59%以上的居民参与养老保险 | |
| 健康 | % | 参与基本医疗险的人口比率,即基本医疗险覆盖人口除以城镇总人口的值 | 80%以上的城镇基本医疗保险参与率 | 2016年 中国统 计年鉴 |
| 性别平等 | — | 女性人口除以男性人口的值 | 0.9346以上的比率(女性/男性) | |
| 工作机会 | % | 各省、自治区和直辖市的2015年就业率 | 95%以上的城镇登记就业率 | |
| 收入 | $ | 2015年的日人均可支配收入 | 100%的人口每天收入超过1.90美元 | |
| 社会公正 | % | 1-1/2(农村恩格尔系数+城市恩格尔系数) | 70%以上(恩格尔系数低于0.30) | |
| 教育 | ‱ | 每万人专利数,即专利总数除以当地人口数 | 3.3(每万人发明专利数) | |
| 能耗 | % | 燃气普及率 | 94%以上的城镇燃气普及率 | |
| 水资源 | % | 城镇用水普及率 | 95%以上的城镇用水普及率 |
| [1] |
吴大放, 胡悦, 刘艳艳, 等. 城市开发强度与资源环境承载力协调分析: 以珠三角为例. 自然资源学报, 2020,35(1):82-94.
[
|
| [2] |
毕明丽, 谢高地, 姚翠友. 人类可持续发展指数的改进及国际比较. 自然资源学报, 2020,35(5):1017-1029.
[
|
| [3] |
FAO. Millennium Development Goals. URL:http://www.fao.org/sustainable-development-goals/mdg/goal-1/en/(accessed 17.01.21.
|
| [4] |
UNDP. Sustainable Development Goals. URL: https://www.undp.org/content/undp/en/home/sustainable-development-goals.html(accessed 17.01.21).
|
| [5] |
|
| [6] |
|
| [7] |
|
| [8] |
陈先鹏, 方恺, 彭建, 等. 资源环境承载力评估新视角: 行星边界框架的源起、发展与展望. 自然资源学报, 2020,35(3):513-531.
[
|
| [9] |
张军泽, 王帅, 赵文武, 等. 地球界限概念框架及其研究进展. 地理科学进展, 2019,38(4):465-476.
[
|
| [10] |
诸大建. 在“行星边界”内追求可持续发展目标的实现. 可持续发展经济导刊, 2019, (7):53-56.
[
|
| [11] |
诸大建. 用国际可持续发展研究的新成果和通用语言解读生态文明. 中国环境管理, 2019, (3):5-12.
[
|
| [12] |
方恺. 基于足迹家族和行星边界的主要国家环境可持续性多维评价. 生态环境学报, 2014,23(11):1868-1875.
[
|
| [13] |
|
| [14] |
|
| [15] |
|
| [16] |
|
| [17] |
|
| [18] |
|
| [19] |
|
| [20] |
|
| [21] |
|
| [22] |
|
| [23] |
|
| [24] |
邵庆龙. 无增长的繁荣: 基于蒂姆·杰克逊思想的评述. 经济资料译丛, 2018, (2):92-97.
[
|
| [25] |
|
| [26] |
|
| [27] |
|
| [28] |
|
| [29] |
国家统计局. 2016. 2016年中国统计年鉴,http://www.stats.gov.cn/tjsj/ndsj/2016/indexch.htm.
[ NBS. China Statistical Yearbook 2016,http://www.stats.gov.cn/tjsj/ndsj/2016/indexch.htm.]
|
| [30] |
中国人民大学中国调查与数据中心. 中国综合社会调查, http://cgss.ruc.edu.cn/(accessed 22.11.20.
[ National Survey Research Center. Chinese General Social Survey, http://cgss.ruc.edu.cn/(accessed 22.11.20).]
|
| [31] |
ONS. Personal well-being in the UK: 2015 to 2016, Office for National Statistics. London, 2016.
|
| [32] |
|
| [33] |
郑磊, 朱志勇. 教育是否促进了中国公民的政治选举投票参与: 来自CGSS2006调查数据的证据. 北京大学教育评论, 2013,11(2):165-185.
[
|
| [34] |
WB. World Development Indicators Database. 2020, http://data.worldbank.org/news/new-country-classifications (accessed 11.10.20.
|
| [35] |
|
| [36] |
罗翔, 李崇明, 万庆, 等. 贫困的“物以类聚”: 中国的农村空间贫困陷阱及其识别. 自然资源学报, 2020,35(10):2460-2472.
[
|
| [37] |
李小云, 徐进. 消除贫困:中国扶贫新实践的社会学研究. 社会学研究, 2020,35(6):20-43.
[
|
| [38] |
许可. 外交部:中国对世界减贫贡献率超过70%. 新华社, 2020-10-20, http://www.gov.cn/xinwen/2020-10/20/content_5552568.htm(accessed 13.11.20.
[
|
| [39] |
和音. 为加速全球减贫进程贡献智慧和力量. 人民日报, 2020-12-16, 第003版,http://www.gov.cn/xinwen/2020-12/16/content_5569717.htm.
[
|
| [40] |
张扬, 秦川申. 基本养老保险与居民主观幸福感: 基于广义精确匹配方法 (CEM) 的实证研究. 实证社会科学, 2020,7(1):40-56.
[
|
| [41] |
蒲晓红, 赵海堂. 基本养老保险对居民幸福感的影响及其机制研究. 社会保障研究, 2020, (3):24-33.
[
|
| [42] |
施美程. 天津人口增长变化特征及其影响研究. 城市, 2019, (11):45-53.
[
|
| [43] |
广东省统计局. 2020. 2020广东统计年鉴,http://stats.gd.gov.cn/gdtjnj/content/post_3098041.html.
[ GSB. Guangdong Statistical Yearbook 2020, http://stats.gd.gov.cn/gdtjnj/content/post_3098041.html.]
|
| [44] |
海南省统计局. 2020. 2020海南统计年鉴,http://stats.hainan.gov.cn/tjj/tjsu/ndsj/.
[ HSB. Hainan Statistical Yearbook 2020, http://stats.hainan.gov.cn/tjj/tjsu/ndsj/.]
|
| [45] |
秦德君. 上海治理70年: 从民主建政到“卓越的全球城市”: 上海超大型城市基层治理进程与线路. 上海行政学院学报, 2020,21(5):41-50.
[
|
| [46] |
易成栋, 任建宇, 高璇. 房价、住房不平等与居民幸福感: 基于中国综合社会调查2005年、2015年数据的实证研究. 中央财经大学学报, 2020, (6):105-117.
[
|
| [47] |
陈惠雄. 通往幸福之路: 全面建成小康社会的结构逻辑与公共政策涵义. 财经论丛, 2021, (4):106-112.
[
|
| [48] |
|
| [49] |
|
| [50] |
|
| [51] |
|
/
| 〈 |
|
〉 |