
JOURNAL OF NATURAL RESOURCES >
Co-evolution of water-energy-food nexus in arid areas: Take Northwest China as an example
Received date: 2020-12-07
Request revised date: 2021-05-06
Online published: 2022-02-16
Copyright
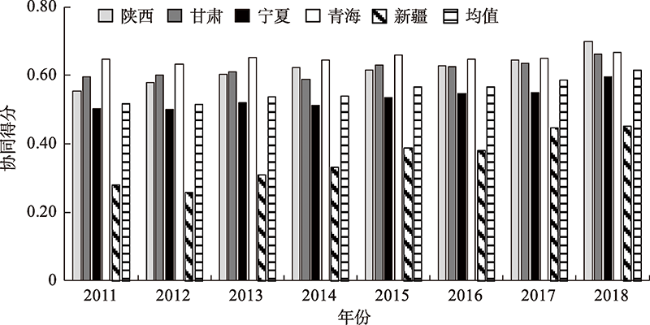
Northwest China is the core area of the Silk Road Economic Belt and an important gateway for China to open up to Central Asia and Europe. With the strategic support of the "Western Development", Northwest China has gone through four "Five-Year Plans" (2001-2020) planning and development. With the rapid economic and social development, it has also taken advantage of basic conditions such as water resources, energy and food resources. Based on the self-organization theory and the Haken model, this paper, taking Northwest China as an example, constructs a collaborative evaluation index system for the water-energy-food nexus. It examines the internal driving factors of the water-energy-food nexus in stages, and analyzes the spatial and temporal differentiation of the water-energy-food nexus synergy score. The results show that: (1) From 2000 to 2010, the sequence parameter of the coordinated development and evolution of the water-energy-food nexus in Northwest China was the water resources subsystem. This shows that the water resources subsystem dominates the development and evolution of the entire system in this stage, while the energy subsystem and the food subsystem are in a subordinate position. During this period, the water-energy-food nexus in the study area was still in an early stage of development and evolution. The development of the entire system relied on the support of a single element, and it had not yet formed a new and orderly structure driven by multiple elements. In terms of the spatial and temporal variations of synergy scores, there is a large gap between the five provinces in the region. The scores of Qinghai, Shaanxi, and Gansu are higher than the average of the region, but the trend of change is relatively stable. The score in Ningxia is lower than the average in the region, and the trend of change is more tortuous. Xinjiang has the lowest synergy score, but its growth is the fastest, and the upward trend is the most obvious. (2) From 2011 to 2018, the sequence parameters of the coordinated development and evolution of the water-energy-food nexus in Northwest China are the water resources subsystem and the energy subsystem. The two together dominate the co-evolution of the water-energy-food nexus. The various elements of the water-energy-food nexus are more closely linked and the system is more stable. However, the food subsystem in this stage is still in a subordinate position. In terms of the temporal and spatial changes, the gap in synergy scores among the five provinces has been significantly reduced. Among them, the scores of Shaanxi, Qinghai, and Gansu are still higher than the average of the Northwest, and the upward trend is more obvious than that in the first stage. Ningxia's synergy score gradually approaches the average of the five provinces. Although Xinjiang's synergy score is still the lowest, it has grown rapidly, and the gap with other provinces has narrowed significantly.
SUN Cai-zhi , WEI Ya-qiong , ZHAO liang-shi . Co-evolution of water-energy-food nexus in arid areas: Take Northwest China as an example[J]. JOURNAL OF NATURAL RESOURCES, 2022 , 37(2) : 320 -333 . DOI: 10.31497/zrzyxb.20220204
表1 中国西北地区水—能源—粮食纽带系统协同评价指标体系Table 1 Cooperative evaluation index system of water-energy-food nexus in Northwest China |
| 目标层 | 准则层 | 指标层 | 指标计算方法或来源 | 指标性质 | 权重 |
|---|---|---|---|---|---|
| 水资源子系统 | 社会安全 | 人均水资源量/(m3/人) | 统计数据 | 正 | 0.168 |
| 地区生活用水量占总用水量比/% | 地区生活用水量/总用水量 | 负 | 0.039 | ||
| 有效灌溉面积比例/% | 有效实灌面积/耕地面积 | 正 | 0.130 | ||
| 经济安全 | 万元工业产值耗水量/ (m3/万元) | 工业总用水量/工业总产值 | 负 | 0.021 | |
| 水资源开发利用率/% | 统计数据 | 负 | 0.022 | ||
| 水利建设投资/104元 | 统计数据 | 正 | 0.137 | ||
| 生态安全 | 生态环境补水量/108 m3 | 统计数据 | 正 | 0.187 | |
| 年平均水资源总量/108 m3 | 统计数据 | 正 | 0.021 | ||
| 天然湿地面积/103 hm2 | 统计数据 | 正 | 0.149 | ||
| 节水灌溉面积/103 hm2 | 统计数据 | 正 | 0.126 | ||
| 粮食子系统 | 可供量 | 农作物受灾面积/103 hm2 | 统计数据 | 负 | 0.043 |
| 粮食产量波动系数 | (年粮食总产量–趋势粮食产量)/趋势粮食产量 | 负 | 0.040 | ||
| 人均粮食产量/(kg/人) | 粮食总产量/地区总人口 | 正 | 0.119 | ||
| 粮食播种面积比例/% | 粮食种植面积/地区总面积 | 正 | 0.085 | ||
| 生产可持续性 | 耕地实际灌溉亩均 用水量/(m3/hm2) | 统计数据 | 负 | 0.141 | |
| 农用化肥用量/104 t | 统计数据 | 正 | 0.198 | ||
| 农用机械总动力/104 kW | 统计数据 | 正 | 0.148 | ||
| 贸易平衡性 | 城乡居民消费水平/元 | 统计数据 | 正 | 0.173 | |
| 粮食消费价格指数 | t年粮食消费价格/t–1年粮食消费价格×100 | 负 | 0.029 | ||
| 粮食生产价格指数 | t年粮食生产价格/t–1年粮食生产价格×100 | 负 | 0.024 | ||
| 能源子系统 | 供应稳定性 | 地区能源自给率/% | 地区能源生产量/能源消耗量 | 正 | 0.162 |
| 能源消费增长系数 | 能源消费年增长速度/国民经济发展年增长速度 | 负 | 0.019 | ||
| 水力发电占比/% | 统计数据 | 正 | 0.157 | ||
| 人均能源生产量/(t/人) | 地区能源生产量/地区总人口 | 正 | 0.105 | ||
| 经济可承受性 | 单位工业增加值 能耗/(t/104元) | 工业综合能源消费量/工业增加值 | 负 | 0.019 | |
| 水电燃料消费价格指数 | 统计数据 | 负 | 0.010 | ||
| 能源工业投资额/108元 | 统计数据 | 正 | 0.167 | ||
| 环境承载力 | 工业废水排放达标量/104 t | 统计数据 | 正 | 0.104 | |
| 工业废气排放量/108 m3 | 统计数据 | 正 | 0.025 | ||
| 森林覆盖率/% | 统计数据 | 正 | 0.232 |
表2 第一阶段中国西北地区水—能源—粮食纽带系统协同演化序参量识别结果Table 2 Identification results of sequence parameters of water-energy-food nexus co-evolution in Northwest China in the first stage |
| 序号 | 模型假设 | λ1 | a | λ2 | b | 结论 |
|---|---|---|---|---|---|---|
| ① | q1=w q2=e | 0.3 (0.000) | 0.323 (0.0000) | 0.9 (0.0000) | 0.59 (0.6902) | a. 运动方程不成立 b. 不满足绝热近似假设 c. 模型假设不成立 |
| ② | q1=w q2=f | 0.1 (0.0151) | -0.917 (0.0064) | 1.25 (0.0000) | -0.196 (0.0049) | a. 运动方程成立 b. 满足绝热近似假设 c. 模型假设成立 |
| ③ | q1=e q2=w | 0.84 (0.5752) | -0.62 (0.4849) | 1.65 (0.0000) | -0.015 (0.8510) | a. 运动方程不成立 b. 不满足绝热近似假设 c. 模型假设不成立 |
| ④ | q1=e q2=f | 0.4 (0.0000) | 0.56 (0.0197) | 0.98 (0.9865) | 0.405 (0.0281) | a. 运动方程不成立 b. 不满足绝热近似假设 c. 模型假设不成立 |
| ⑤ | q1=f q2=w | 0.8 (0.0585) | -1.89 (0.0000) | 0.48 (0.0000) | 0.143 (0.0000) | a. 运动方程成立 b. 不满足绝热近似假设 c. 模型假设不成立 |
| ⑥ | q1=f q2=e | 0.61 (0.0895) | 0.9 (0.0647) | 0.6 (0.0205) | 0.36 (0.0000) | a. 运动方程成立 b. 不满足绝热近似假设 c. 模型假设不成立 |
注:选取显著性水平为10%,w代表水资源子系统,e代表能源子系统,f代表粮食子系统,下同。 |
表3 第二阶段西北地区水—能源—粮食纽带系统协同演化序参量识别结果Table 3 Identification results of sequence parameters of water-energy-food nexus co-evolution in Northwest China in the second stage |
| 序号 | 模型假设 | λ1 | a | λ2 | b | 结论 |
|---|---|---|---|---|---|---|
| ① | q1=w q2=e | 0.29 (0.0159) | 0.287 (0.8278) | 1.24 (0.0006) | -0.448 (0.0000) | a. 运动方程不成立 b. 不满足绝热近似假设 c. 模型假设不成立 |
| ② | q1=w q2=f | 0.05 (0.0000) | -0.411 (0.0006) | 0.65 (0.0000) | -0.14 (0.0336) | a. 运动方程成立 b. 满足绝热近似假设 c. 模型假设成立 |
| ③ | q1=e q2=w | 0.62 (0.0000) | 0.148 (0.2345) | 0.3 (0.0345) | 0.219 (0.4626) | a. 运动方程不成立 b. 不满足绝热近似假设 c. 模型假设不成立 |
| ④ | q1=e q2=f | 0.38 (0.0000) | -0.203 (0.0055) | 0.63 (0.0001) | -0.206 (0.0191) | a. 运动方程成立 b. 满足绝热近似假设 c. 模型假设成立 |
| ⑤ | q1=f q2=w | 0.45 (0.000) | -0.66 (0.0543) | 0.16 (0.0001) | 0.23 (0.0053) | a. 运动方程成立 b. 不满足绝热近似假设 c. 模型假设不成立 |
| ⑥ | q1=f q2=e | 0.31 (0.0000) | -0.558 (0.0104) | 0.58 (0.0000) | 0.015 (0.9303) | a. 运动方程不成立 b. 满足绝热近似假设 c. 模型假设不成立 |
表4 第二阶段西北地区水—能源—粮食纽带系统加总序参量识别结果Table 4 Identification results of summation sequence parameter of water-energy-food nexus in Northwest China in the second stage |
| 模型假设 | λ1 | a | λ2 | b | 结论 |
|---|---|---|---|---|---|
| q1=w add e q2=f | 0.14 (0.0000) | -0.303 (0.0441) | 0.66 (0.0000) | -0.048 (0.0013) | a. 运动方程成立 b. 满足绝热近似假设 c. 模型假设成立 |
| [1] |
|
| [2] |
洪思扬, 王红瑞, 来文立, 等. 我国能源耗水空间特征及其协调发展脱钩分析. 自然资源学报, 2017,32(5):800-813.
[
|
| [3] |
|
| [4] |
杨鑫, 穆月英. 灌溉水压力、供给弹性与粮食生产结构: 基于变系数Nerlove模型. 自然资源学报, 2020,35(3):728-742.
[
|
| [5] |
|
| [6] |
|
| [7] |
白景锋, 张海军. 中国水—能源—粮食压力时空变动及驱动力分析. 地理科学, 2018,38(10):1653-1660.
[
|
| [8] |
|
| [9] |
|
| [10] |
张宗勇, 刘俊国, 王凯, 等. 水—粮食—能源关联系统述评: 文献计量及解析. 科学通报, 2020,65(12):1569-1580.
[
|
| [11] |
赵荣钦, 李志萍, 韩宇平, 等. 区域“水—土—能—碳”耦合作用机制分析. 地理学报, 2016,71(9):1613-1628.
[
|
| [12] |
李桂君, 黄道涵, 李玉龙. 水—能源—粮食关联关系: 区域可持续发展研究的新视角. 中央财经大学学报, 2016, ( 12):76-90.
[
|
| [13] |
|
| [14] |
|
| [15] |
|
| [16] |
|
| [17] |
|
| [18] |
|
| [19] |
|
| [20] |
|
| [21] |
|
| [22] |
|
| [23] |
|
| [24] |
施海洋, 罗格平, 郑宏伟, 等. 基于“水—能源—食物—生态”纽带因果关系和贝叶斯网络的锡尔河流域用水分析. 地理学报, 2020,75(5):1036-1052.
[
|
| [25] |
|
| [26] |
王玉宝, 刘显, 史利洁, 等. 西北地区水资源与食物安全可持续发展研究. 中国工程科学, 2019, ( 5):38-44.
[
|
| [27] |
赖玉佩. 中国水—能源—粮食协同需求的区域特征研究. 北京规划建设, 2019, ( 1):74-77.
[
|
| [28] |
胡金星. 产业融合的内在机制研究: 基于自组织理论的视角. 上海: 复旦大学, 2007.
[
|
| [29] |
[
|
| [30] |
于丽丽. 中国海陆经济一体化及驱动机理研究: 基于耦合模型和哈肯模型. 上海: 上海大学, 2016.
[
|
| [31] |
李琳, 刘莹. 中国区域经济协同发展的驱动因素: 基于哈肯模型的分阶段实证研究. 地理研究, 2014,33(9):1603-1616.
[
|
| [32] |
郑玉雯, 薛伟贤. 丝绸之路经济带沿线国家协同发展的驱动因素: 基于哈肯模型的分阶段研究. 中国软科学, 2019, ( 2):78-92.
[
|
| [33] |
姚成胜, 殷伟, 李政通. 中国粮食安全系统脆弱性评价及其驱动机制分析. 自然资源学报. 2019,34(8):1720-1734.
[
|
| [34] |
孙才志, 阎晓东. 中国水资源一能源一粮食耦合系统安全评价及空间关联分析. 水资源保护, 2018,34(5):1-8.
[
|
| [35] |
王慧敏, 洪俊, 刘钢. “水—能源—粮食”纽带关系下区域绿色发展政策仿真研究. 中国人口·资源与环境, 2019,29(6):74-84.
[
|
| [36] |
李桂君, 李玉龙, 贾晓菁, 等. 北京市水—能源—粮食可持续发展系统动力学模型构建与仿真. 管理评论, 2016,28(10):11-26.
[
|
| [37] |
张欣莹, 解建仓, 刘建林, 等. 基于熵权法的节水型社会建设区域类型分析. 自然资源学报, 2017,32(2):301-309.
[
|
/
| 〈 |
|
〉 |
