
JOURNAL OF NATURAL RESOURCES >
Spatio-temporal characteristics of urban green growth level and its influencing factors in Shaanxi province
Received date: 2020-08-16
Request revised date: 2020-11-12
Online published: 2022-03-28
Copyright
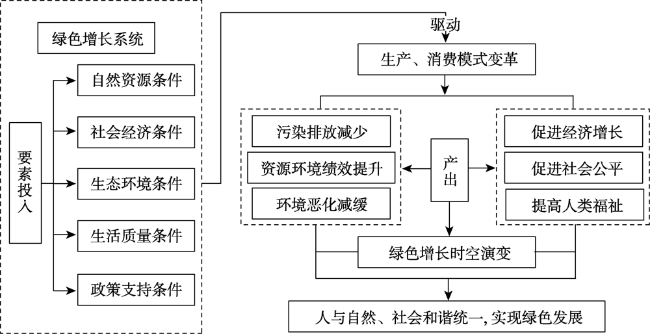
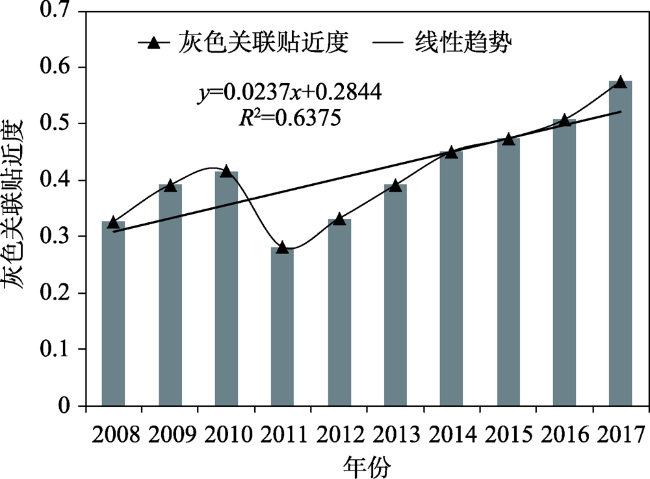
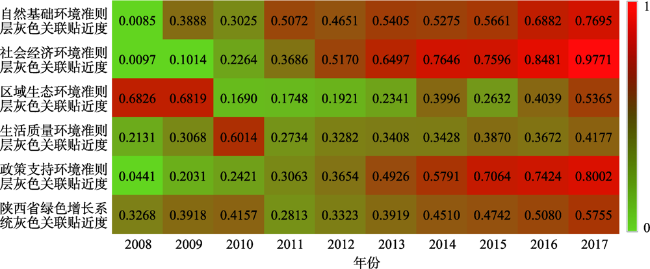
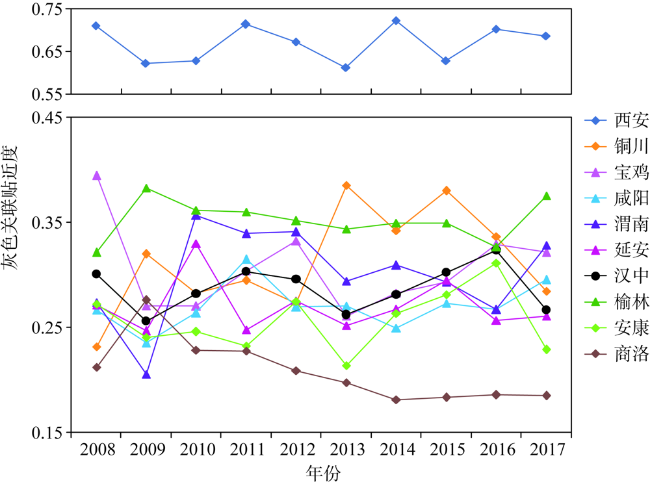
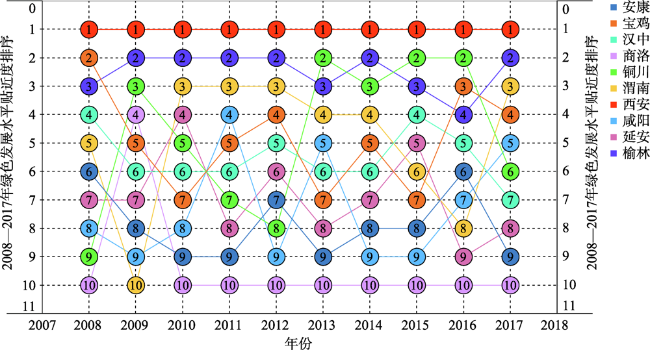
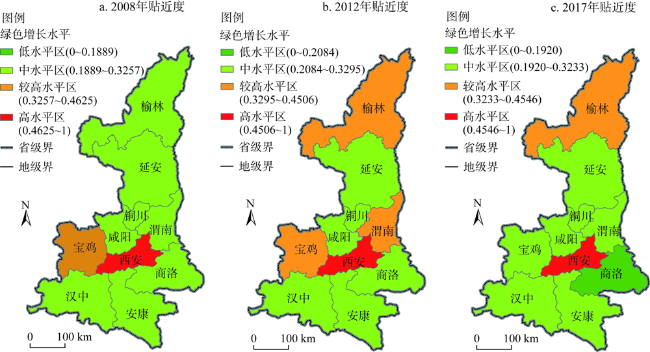
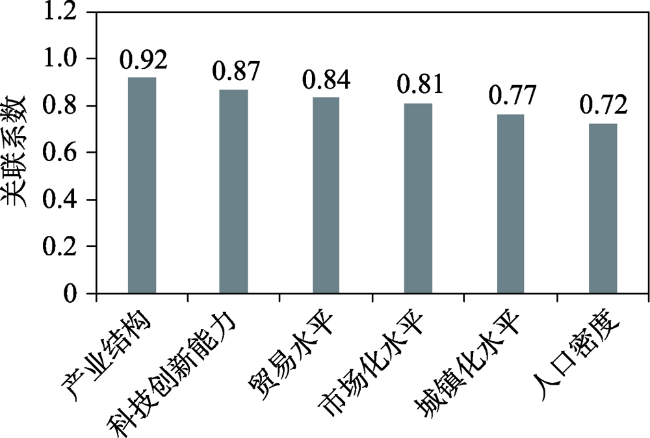
Green growth is a sustainable development mode to realize the coordination between human and land, which plays an important role in promoting regional green development and ecological civilization construction. Taking Shaanxi province as an example, based on the systematic analysis of the connotation and characteristics of green growth, this paper constructs the mechanism framework and evaluation index system of green growth system, and analyzes the spatiotemporal evolution characteristics and influencing factors of urban green growth level from 2008 to 2017 by using TOPSIS grey correlation analysis and Theil index. The results show that: (1) The level of urban green growth in Shaanxi province presents a "rise - drop - rise" fluctuation process. (2) In terms of spatial distribution, there are obvious regional differences in the level of urban green growth, and there is a trend of further expansion; in terms of spatial evolution, the intra-regional differences show a slight downward trend, while the inter-regional differences have an obvious upward trend. (3) Regional ecological environment (X3), quality of life environment (X4) and policy support environment (X5) are the main obstacles to the green growth level of Shaanxi, and there are obvious spatial differences in the barrier effect of different standard layers among cities. (4) On the provincial level, the five factors that hinder the level of urban green growth are the treatment capacity of waste gas treatment facilities (X43), the decline rate of energy consumption per unit GDP (X31), the number of employees engaged in scientific research and technical services (X54), the green coverage rate of built-up areas (X49), and the comprehensive utilization rate of general industrial solid waste (X42); on the urban level, X54 has the strongest blocking effect, followed by X43, X31, the number of buses and taxis per 10000 people (X48) and the per capita GDP (X21). (5) In the aspect of external environment driving, industrial structure, scientific and technological innovation ability contribute the most to Shaanxi's green growth, followed by trade level, marketization level, urbanization level and population density. Finally, the paper puts forward countermeasures and suggestions from five aspects, such as building a diversified energy structure system, improving green growth related policies and systems, and optimizing external environmental conditions.
LIU Yu-feng , YUAN Zhi-hua , GUO Ling-xia , FENG Jian-min , KONG Wei , DANG Chen-meng . Spatio-temporal characteristics of urban green growth level and its influencing factors in Shaanxi province[J]. JOURNAL OF NATURAL RESOURCES, 2022 , 37(1) : 200 -220 . DOI: 10.31497/zrzyxb.20220114
表1 绿色增长内涵界定Table 1 Definition of green growth |
| 机构/学者 | 内涵/侧重点 | 出处 |
|---|---|---|
| 联合国亚洲及太平洋经济社会委员会(UNESCAP) | 绿色增长是为了实现低碳和全社会成员的发展而推行的环境可持续的经济发展过程 | UNESCAP环境与发展部长会议[25,26] |
| 经济合作与发展组织(OECD) | 绿色增长是指在防止代价昂贵的环境破坏、气候变化、生物多样化丧失和以不可持续的方式使用自然资源的同时,追求经济增长和发展;绿色增长是在确保自然资产能继续提供人类福祉所需的资源和环境服务的同时,促进经济增长和发展 | 《绿色增长宣言》《迈向绿色增长》[27,28,29] |
| 韩国 | 绿色增长指通过清洁能源、绿色技术开发以及绿色革新,最小化使用能源、资源,减少气候变化和环境污染,确保增长动力,创造工作岗位,实现经济环境和谐相融的增长方式 | 《低碳绿色增长基本法》[30] |
| 国外代表性学者 | Meyer等[31]认为绿色增长的核心是将经济增长与资源消耗解耦;Reilly等[32]从经济、环境、社会三方面阐述了绿色增长的内涵;Jacobs等[33]指出绿色增长的本质是追求显著环境保护的经济增长 | 见参考文献[31,32,33] |
| 国内代表性学者 | 张江雪等[34]指出科技进步与创新是绿色增长的重要支撑,只有拓宽技术创新的目标,加大科技与环境保护力度,才能实现经济、资源与环境的协调统一;韩晶等[35]认为绿色增长的核心是提升资源环境绩效,激励产业发展向集约、低碳、绿色转型,而实现绿色增长的关键在于绿色创新能力的提升;武春友等[36]对绿色增长给出的定义是:通过绿色技术创新驱动与制度安排,用最小的资源消耗和环境代价,创造出资源效率、环境友好、社会包容与和谐的经济增长与最大发展效益 | 见参考文献[34,35,36] |
表2 绿色增长水平评价指标体系及权重Table 2 Evaluation index system of green growth level and weight calculation results |
| 序号 | 准则层/权重 | 要素层 | 单位 | 指标性质 | 主要参考文献 | 权重 |
|---|---|---|---|---|---|---|
| 1 | 自然基础环境X1/0.0789 | X11:人均水资源供应量* | m3 | 正向指标 | [1,41,42] | 0.0326 |
| 2 | X12:人均耕地面积* | hm²/人 | 正向指标 | [1,25,41] | 0.0198 | |
| 3 | X13:造林面积** | hm² | 正向指标 | [11,41] | 0.0266 | |
| 4 | 社会经济环境 X2/0.1583 | X21:人均GDP* | 元/人 | 正向指标 | [1,29] | 0.0415 |
| 5 | X22:人口自然增长率* | ‰ | 适中指标 | [9,25,29] | 0.0065 | |
| 6 | X23:第三产业占GDP的比例* | % | 适中指标 | [1,29,41] | 0.0069 | |
| 7 | X24:城镇居民人均可支配收入* | 元 | 正向指标 | [25,29,41] | 0.0377 | |
| 8 | X25:农村居民人均纯收入** | 元 | 正向指标 | [41,43,44] | 0.0283 | |
| 9 | X26:全社会固定资产投资** | 108元 | 正向指标 | [19,29,45] | 0.0374 | |
| 10 | 区域生态环境 X3/0.2043 | X31:单位GDP能耗下降率* | % | 正向指标 | [1,25,29] | 0.0761 |
| 11 | X32:二氧化硫排放量** | t | 负向指标 | [9,25,29] | 0.0132 | |
| 12 | X33:氮氧化物排放量** | t | 负向指标 | [25,46] | 0.0166 | |
| 13 | X34:烟(粉)尘排放量** | t | 负向指标 | [9,19] | 0.0221 | |
| 14 | X35:化学需氧量排放量** | t | 负向指标 | [11,25,39] | 0.0227 | |
| 15 | X36:工业固体废弃物产生量** | 104 t | 负向指标 | [25,44] | 0.0111 | |
| 16 | X37:工业废水排放总量** | 104 t | 负向指标 | [25,29,44] | 0.0298 | |
| 17 | X38:规模以上工业企业能源消费量** | 104 tce | 负向指标 | [47] | 0.0126 | |
| 18 | 生活质量环境 X4/0.3510 | X41:生活垃圾无害化处理率* | % | 正向指标 | [1,25,29] | 0.0405 |
| 19 | X42:一般工业固体废物综合利用率* | % | 正向指标 | [19,25,41] | 0.0171 | |
| 20 | X43:废气治理设施处理能力** | 104 m3/h | 正向指标 | [47,48] | 0.0626 | |
| 21 | X44:废水治理设施处理能力** | 104 t/d | 正向指标 | [47,48] | 0.0292 | |
| 22 | X45:用水普及率** | % | 正向指标 | [9,25] | 0.0267 | |
| 23 | X46:燃气普及率** | % | 正向指标 | [9] | 0.0352 | |
| 24 | X47:每万人拥有医疗机构床位数** | 张 | 正向指标 | [9,25,43] | 0.0203 | |
| 25 | X48:每万人拥有公交车和出租车辆数** | 标台 | 正向指标 | [1,9,25] | 0.0445 | |
| 26 | X49:建成区绿化覆盖率* | % | 正向指标 | [1,25,29] | 0.0380 | |
| 27 | X4,10:城市人均公园绿地面积** | m2/人 | 正向指标 | [1,25,29] | 0.0368 | |
| 28 | 政策支持环境 X5/0.2075 | X51:节能环保支出占GDP的比例** | % | 正向指标 | [25,44] | 0.0303 |
| 29 | X52:科学技术支出占GDP的比例** | % | 正向指标 | [9,25,29] | 0.0287 | |
| 30 | X53:水利建设投资完成额** | 104元 | 正向指标 | [48] | 0.0181 | |
| 31 | X54:教育经费支出占GDP的比例** | % | 正向指标 | [25,43,44] | 0.0220 | |
| 32 | X55:科研、技术服务从业人员数** | 104人 | 正向指标 | [25,41] | 0.1084 |
注:*表示指标为国际上相关组织机构采用的指标;**表示指标是已有研究成果中出现频率较高的指标。 |
表3 2008—2017年陕西省城市绿色增长水平分级表Table 3 Grading table of urban green growth level in Shaanxi province from 2008 to 2017 |
| 年份 | 分级标准 | |||
|---|---|---|---|---|
| 低水平区 (0, A-S] | 中等水平区 (A-S, A] | 较高水平区 (A, A+S] | 高水平区 (A+S, 1) | |
| 2008 | (0, 0.1889] | (0.1889, 0.3257] | (0.3257, 0.4625] | (0.4625, 1) |
| 2009 | (0, 0.1899] | (0.1899, 0.3055] | (0.3055, 0.4212] | (0.4212, 1) |
| 2010 | (0, 0.2153] | (0.2153, 0.3251] | (0.3251, 0.4349] | (0.4349, 1) |
| 2011 | (0, 0.2005] | (0.2005, 0.3338] | (0.3338, 0.4670] | (0.4670, 1) |
| 2012 | (0, 0.2084] | (0.2084, 0.3295] | (0.3295, 0.4506] | (0.4506, 1) |
| 2013 | (0, 0.1954] | (0.1954, 0.3092] | (0.3092, 0.4230] | (0.4230, 1) |
| 2014 | (0, 0.1847] | (0.1847, 0.3249] | (0.3249, 0.4650] | (0.4650, 1) |
| 2015 | (0, 0.2168] | (0.2168, 0.3280] | (0.3280, 0.4393] | (0.4393, 1) |
| 2016 | (0, 0.1990] | (0.1990, 0.3306] | (0.3306, 0.4623] | (0.4623, 1) |
| 2017 | (0, 0.1920] | (0.1920, 0.3233] | (0.3233, 0.4546] | (0.4546, 1) |
注:表中A为平均值,S为标准差。 |
表4 陕西省城市绿色增长水平的泰尔指数及结构分解Table 4 Theil index and structure decomposition of urban green growth level in Shaanxi province |
| 年份 | 总体差异 | 数值/贡献率(%) | ||||
|---|---|---|---|---|---|---|
| 地区内差异 | 地区间差异 | 陕北地区 | 关中地区 | 陕南地区 | ||
| 2008 | 0.0719 | 0.0594/82.5 | 0.0126/17.5 | 0.0035/3.2 | 0.0976/87.7 | 0.0102/9.1 |
| 2009 | 0.0602 | 0.0546/90.6 | 0.0057/9.4 | 0.0236/20.3 | 0.0911/78.4 | 0.0016/1.3 |
| 2010 | 0.0486 | 0.0372/76.4 | 0.0115/23.6 | 0.0010/1.5 | 0.0650/92.9 | 0.0039/5.6 |
| 2011 | 0.0651 | 0.0476/73.0 | 0.0176/27.0 | 0.0171/17.4 | 0.0720/73.4 | 0.0090/9.2 |
| 2012 | 0.0562 | 0.0437/77.6 | 0.0126/22.4 | 0.0074/8.5 | 0.0694/79.6 | 0.0104/11.9 |
| 2013 | 0.0586 | 0.0384/65.6 | 0.0202/34.4 | 0.0119/15.2 | 0.0586/75.3 | 0.0073/9.5 |
| 2014 | 0.0760 | 0.0578/76.1 | 0.0181/23.9 | 0.0090/7.8 | 0.0891/77.4 | 0.0170/14.8 |
| 2015 | 0.0505 | 0.0380/75.2 | 0.0125/24.8 | 0.0036/4.4 | 0.0565/69.0 | 0.0218/26.6 |
| 2016 | 0.0660 | 0.0544/82.4 | 0.0116/17.6 | 0.0072/6.3 | 0.0804/69.7 | 0.0277/24.0 |
| 2017 | 0.0693 | 0.0461/66.6 | 0.0231/33.4 | 0.0163/17.0 | 0.0686/71.6 | 0.0109/11.4 |
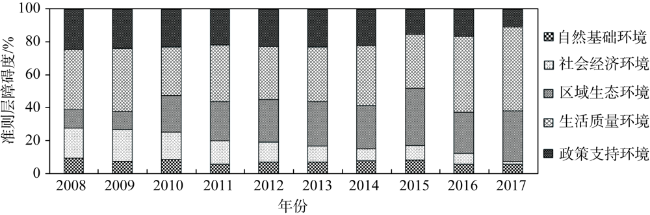
图7 陕西省绿色增长水平准则层障碍度变化Fig. 7 Change of barrier degree of criterion layer of urban green growth level in Shaanxi province |
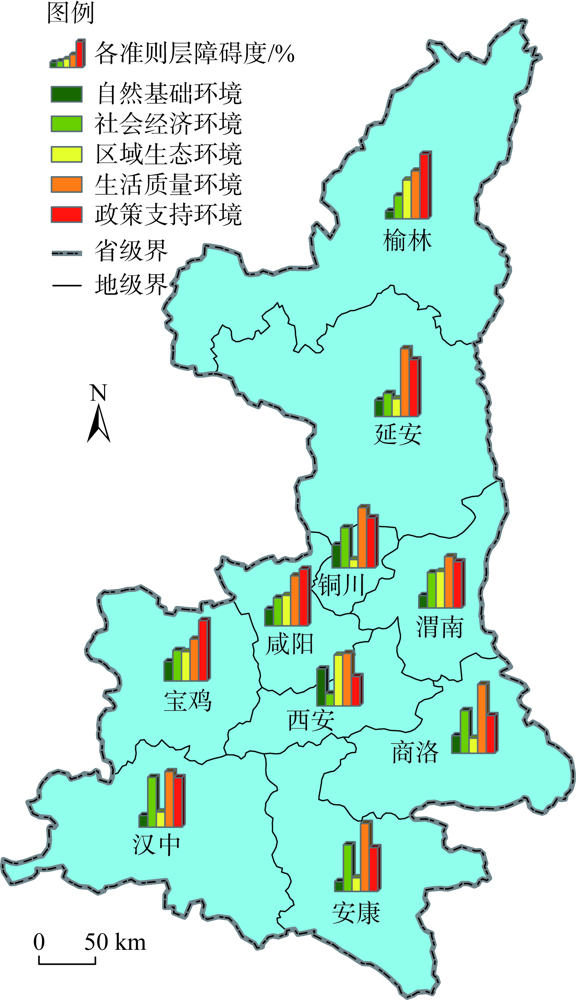
图8 陕西省绿色增长水平准则层障碍度空间差异Fig. 8 Spatial difference of barrier degree of green growth level criterion layer in Shaanxi province |
| [1] |
程钰, 王晶晶, 王亚平, 等. 中国绿色发展时空演变轨迹与影响机理研究. 地理研究, 2019, 38(11):2745-2765.
[
|
| [2] |
|
| [3] |
|
| [4] |
张旭, 李伦. 绿色增长内涵及实现路径研究述评. 科研管理, 2016, 37(8):85-93.
[
|
| [5] |
Word Commission on Environment and Development. Our Common Future. Oxford: Oxford University Press, 1987.
|
| [6] |
|
| [7] |
曾贤刚, 毕瑞亨. 绿色经济发展总体评价与区域差异分析. 环境科学研究, 2014, 27(12):1564-1570.
[
|
| [8] |
赵奥, 郭景福, 武春友. 中国绿色增长评价指标体系构建及实证测度研究. 科技管理研究, 2018, (16):245-250.
[
|
| [9] |
赵奥, 郭景福, 左莉. 高质量发展变革下中国省域绿色增长能力系统评价与时空差异演化研究. 经济问题探索, 2020, (8):144-156.
[
|
| [10] |
陈英姿, 荣婧, 李晓巍. 东三省经济绿色增长水平评价及动力因素研究. 生态经济, 2019, 35(8):50-56.
[
|
| [11] |
蔡烁纯. 我国30个省市绿色增长指数实证研究: 基于纵横向拉开档次法. 西安石油大学学报: 社会科学版, 2019, 28(4):28-36.
[
|
| [12] |
|
| [13] |
周英男, 杨文晶, 王学先. 绿色增长政策研究述评与展望. 中国人口·资源与环境, 2016, 26(s2):91-94.
[
|
| [14] |
苏明. 构建有利于减贫和绿色增长的财税政策. 国家行政学院学报, 2013, (3):44-50.
[
|
| [15] |
李文正, 刘宇峰, 张晓露, 等. 陕西省城市绿色发展水平时空演变及障碍因子分析. 水土保持研究, 2019, 26(6):280-289.
[
|
| [16] |
李文正, 刘宇峰, 陈玲侠. 2006—2015年陕西省城市绿色发展水平演变分析. 河南科学, 2017, 35(11):1838-1844.
[
|
| [17] |
李文正, 刘倩, 纪茜, 等. 陕西省城市绿色发展水平评价: 基于同其他省区的比较. 江西农业学报, 2017, 29(11):124-128.
[
|
| [18] |
周亮, 车磊, 周成虎. 中国城市绿色发展效率时空演变特征及影响因素. 地理学报, 2019, 74(10):2027-2044.
[
|
| [19] |
|
| [20] |
崔兆杰, 张凯. 循环经济理论与方法. 北京: 科学出版社, 2008.
[
|
| [21] |
|
| [22] |
|
| [23] |
|
| [24] |
|
| [25] |
郭玲玲. 中国绿色增长程度评价及实现路径研究. 大连: 大连理工大学, 2016.
[
|
| [26] |
ESCAP, UN, UNEP. Green growth, resources and resilience: Environmental sustainability in Asia and the Pacific. Bangkok: ADB Reports, 2013.
|
| [27] |
OCED. Declaration on green growth. Paris: OCED, 2009.
|
| [28] |
OCED. Towards green growth. Paris: OCED, 2011.
|
| [29] |
吕晓菲. 资源型城市绿色增长能力评价研究. 大连: 大连理工大学, 2015.
[
|
| [30] |
吕福新. 绿色发展的基本关系及模式: 浙商和遂昌的实践. 管理世界, 2013, (11):166-169.
[
|
| [31] |
|
| [32] |
|
| [33] |
|
| [34] |
张江雪, 朱磊. 基于绿色增长的我国各地区工业企业技术创新效率研究. 数量经济技术经济研究, 2012, (2):113-125.
[
|
| [35] |
韩晶, 宋涛, 陈超凡, 等. 基于绿色增长的中国区域创新效率研究. 经济社会体制比较, 2013, (3):100-110.
[
|
| [36] |
武春友, 郭玲玲. 绿色增长理论与实践的国际比较研究. 中国国情国力, 2020, (5):37-41.
[
|
| [37] |
佟贺丰, 杨阳, 王静宜, 等. 中国绿色经济发展展望: 基于系统动力学模型的情景分析. 中国软科学, 2015, (6):20-34.
[
|
| [38] |
黄跃, 李琳. 中国城市群绿色发展水平综合测度与时空演化. 地理研究, 2017, 36(7):1309-1322.
[
|
| [39] |
武春友, 郭玲玲, 于惊涛. 基于TOPSIS-灰色关联分析的区域绿色增长系统评价模型及实证. 管理评论, 2017, 29(1):228-239.
[
|
| [40] |
郭玲玲, 卢小丽, 武春友, 等. 中国绿色增长评价指标体系构建研究. 科研管理, 2016, 37(6):141-150.
[
|
| [41] |
于惊涛, 张艳鸽. 中国绿色增长评价指标体系的构建与实证研究. 工业技术经济, 2016, 35(3):109-117.
[
|
| [42] |
郝芳, 王雪华, 孔丘逸. 基于系统动力学的中国绿色增长评价模型研究. 大连理工大学学报: 社会科学版, 2017, 38(3):39-45.
[
|
| [43] |
周小亮, 吴武林. 中国包容性绿色增长的测度及分析. 数量经济技术经济研究, 2018, 35(8):3-20.
[
|
| [44] |
王珊珊. 基于脱钩的绿色增长及影响因素: 国际比较研究. 大连: 大连理工大学, 2016.
[
|
| [45] |
张国俊, 邓毛颖, 姚洋洋, 等. 广东省产业绿色发展的空间格局及影响因素分析. 自然资源学报, 2019, 34(8):1593-1605.
[
|
| [46] |
郭艳花, 佟连军, 梅林. 吉林省限制开发生态区绿色发展水平评价与障碍因素. 生态学报, 2020, 40(7):2463-2472.
[
|
| [47] |
张政. 湖北汉江生态经济带区域协调发展与绿色增长效应研究. 武汉: 武汉大学, 2017.
[
|
| [48] |
吴淑丽. 绿色经济测度: 定义与指标选择: 《构建共同的绿色增长指标方法》简介. 中国统计, 2013, (9):22-23.
[
|
| [49] |
张欣莹, 解建仓, 刘建林, 等. 基于熵权法的节水型社会建设区域类型分析. 自然资源学报, 2017, 32(2):301-309.
[
|
| [50] |
赵会杰, 于法稳. 基于熵值法的粮食主产区农业绿色发展水平评价. 改革, 2019, (11):136-146.
[
|
| [51] |
张玉玲, 迟国泰, 祝志川. 基于变异系数-AHP 的经济评价模型及中国十五期间实证研究. 管理评论, 2011, 23(1):3-13.
[
|
| [52] |
人民网. 国务院关于印发国家人口发展规划(2016—2030年)的通知, http://politics.people.com.cn/n1/2017/0125/c1001-29049534.html, 2017-01-25.
[People's Network. Notice of the State Council on printing and distributing the national population development plan (2016-2030), http://politics.people.com.cn/n1/2017/0125/c1001-29049534.html, 2017-01-25.]
|
| [53] |
王小鲁, 樊纲, 胡李鹏, 等. 中国分省份市场化指数报告(2018). 北京: 社会科学文献出版社, 2019.
[
|
| [54] |
中国科技发展战略研究小组. 中国区域创新能力评价报告2019. 北京: 科学技术文献出版社, 2019.
[China Science and Technology Development Strategy Research Group. China's Regional Innovation Capability Evaluation Report 2019. Beijing: Science and Technology Literature Press, 2019.]
|
| [55] |
张燕, 陈波, 黄艳非, 等. 西南高原区玉米地方品种农艺性状相关性及灰色关联度分析. 广东农业科学, 2011, (24):12-13.
[
|
/
| 〈 |
|
〉 |
