
JOURNAL OF NATURAL RESOURCES >
Evaluation model and application of water supply and demand suitability for tourism in arid areas: A case study of Xinjiang
Received date: 2020-08-03
Revised date: 2021-01-11
Online published: 2022-02-28
Copyright
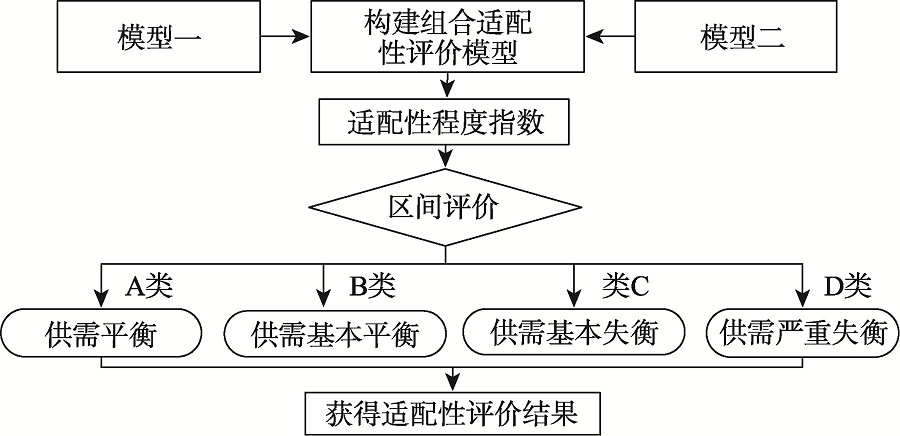
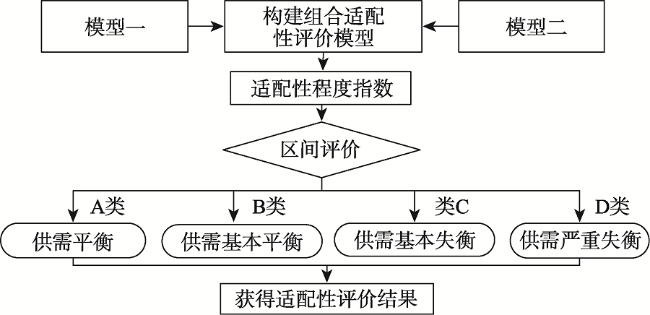
While promoting the regional social and economic development, the tourism in arid areas aggravates the contradiction between the supply and demand of water resources. In view of the characteristics of water resource endowment and tourism industry in arid regions of China, this paper puts forward an evaluation model of water supply and demand suitability of tourism industry in arid regions. According to the contribution rate of tourism output to gross domestic product, the proportion of tourism employees in employment, and the constraint of regional water resource endowment, a comprehensive calculation model for the water supply of tourism in arid areas is built; from the perspective of tourism all-elements, a tourism water demand measurement model is established, which is composed of catering, accommodation, energy, visiting, and shopping water accounts, etc.; aiming to set up the quantitative relationship between "supply" and "demand" water quantity, a combinatorial analysis method was used to construct an index evaluation model for the suitability degree of water supply and demand for tourism industry, and an evaluation threshold was set to evaluate the suitability degree of water supply and demand for tourism industry in arid areas. The empirical prediction of the degree of water supply and demand suitability for tourism in Xinjiang in 2025 is made, and the following conclusions are drawn: the maximum development rate of tourism in Xinjiang should be within 15%; at the same time, the Xinjiang government should keep the average annual water-saving rate of social water consumption at or above 0.95%; in the event of an emergency, the development rate of tourism in Xinjiang in subsequent years can be increased to 20%. Only in this way can the tourism industry maintain the state of "basic balance between supply and demand" or even better.
HE Zhao-li , WANG Rui-fang . Evaluation model and application of water supply and demand suitability for tourism in arid areas: A case study of Xinjiang[J]. JOURNAL OF NATURAL RESOURCES, 2021 , 36(12) : 3215 -3231 . DOI: 10.31497/zrzyxb.20211215
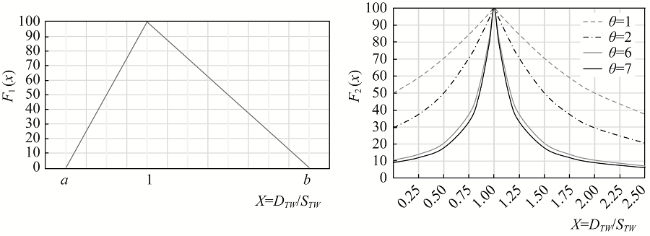
表1 不同适配性类别下x的取值范围Table 1 Value range of variable x under different adaptability categories |
| 类别 | A | B | C | D | |
|---|---|---|---|---|---|
| x取值范围 | 需小于或等于供 | ||||
| 需大于供 | |||||
表2 供给量测算模型中各指标统计性描述Table 2 Statistical description of each indicator in the supply measurement model |
| 变量 | 单位 | 均值 | 标准差 | 最小值 | 最大值 |
|---|---|---|---|---|---|
| 亿元 | 637.64 | 530.31 | 159.34 | 1823.19 | |
| G | 亿元 | 6802.50 | 2677.88 | 3045.26 | 10881.96 |
| 万人 | 4.88 | 0.63 | 3.65 | 5.76 | |
| 万人 | 1017.66 | 176.96 | 811.75 | 1307.56 | |
| 108 m³ | 550.33 | 28.88 | 513.70 | 590.14 |
表3 需求量测算模型中各指标计算方法Table 3 Calculation methods of various indicators in the demand measurement model |
| 指标 | 计算方法 | 数据来源 |
|---|---|---|
| 新疆旅游业共接待游客总人天=(入境旅游人数-入境过夜人数)+入境过夜人天数+国内旅游人数×国内游客平均逗留天数 | 《新疆统计年鉴》(2007—2018年)、 《中国旅游统计年鉴》(2007—2018年) | |
| 直接获取 | 《中国旅游统计年鉴》(2007—2018年) | |
| 365天 | 以全年计算 | |
| 游客在旅游目的地消费各类食物数量取当地居民消耗量 | 参考已有研究[31] | |
| 直接获取各类食物虚拟水含量 | 参考已有研究[32] | |
| 参考新疆三星级宾馆用水定额 | 《新疆维吾尔自治区生活用水定额》 | |
| 过夜游客总人天=入境过夜人天数+国内旅游人数×国内游客平均逗留天数 | 《新疆统计年鉴》(2007—2018年)、《中国旅游统计年鉴》(2007—2018年) | |
| 宾馆员工用水为80~100 L/d,本文取中间值90 L/d | GB50015-2003《建筑给水排水设计规范》 | |
| 根据统计资料直接获取 | 《中国旅游统计年鉴》(2007—2018年) | |
| 365天 | 以全年计算 | |
| 3.18 m³/kg | 生产1 kg塑料约需3 kg石油,石油耗水因子1.06 m³/kg | |
| 宾馆一次性消费品数量=客房数×10 kg(每间客房两支牙刷、一把梳子年消耗10 kg塑料) | 参考有关报道① | |
| 城镇居民人均日生活能源(标准煤)根据统计资料计算而得 | 《新疆统计年鉴》(2007—2018年) | |
| 1.4286 | 按热量换算,1 kg原油=1.4286 kg标准煤 | |
| 根据统计资料直接获取 | 《新疆维吾尔自治区水资源公报》(2012—2016年)、《中国水资源公报》(2006—2017年) | |
| 根据统计资料直接获取 | 《新疆维吾尔自治区水资源公报》(2012—2016年)、《中国水资源公报》(2006—2017年) | |
| 游客购物总消费=入境旅游商品销售(万美元)×美元兑人民币汇率+国内游客总人天×入境过夜游客人均天花费(购物)×美元兑人民币汇率 | 《新疆统计年鉴》(2007—2018年)、《中国旅游统计年鉴》(2007—2018年) |
注:现有统计资料中尚缺乏对新疆“国内旅游商品销售”的统计,故本文以“入境过夜游客人均天花费(购物)”估算。 |
表5 新疆旅游业用水供需适配性分类区间Table 5 Classification interval of water supply and demand adaptability for Xinjiang tourism industry |
| 供需适配性分类 | 供需平衡(A类) | 供需基本平衡(B类) | 供需基本失衡(C类) | 供需严重失衡(D类) | |
|---|---|---|---|---|---|
| 供需适配性程度指数 | [85, 100] | [70, 85) | [55, 70) | [0, 55) | |
| x | 需小于或等于供 | [0.880, 1] | [0.753, 0.880) | [0.615, 0.753) | [0.2, 0.615) |
| 需大于供 | (1, 1.134] | (1.134, 1.277] | (1.277, 1.440] | (1.440, 2] | |
表6 2025年各情景新疆旅游业用水供给量测算结果Table 6 The supply of water resources for Xinjiang's tourism industry in 2025 (108 m³) |
| 政府节 水力度(%) | 旅游业规模发展速度 | ||||||
|---|---|---|---|---|---|---|---|
| 不发生突发性事件(%) | 发生突发性事件(%) | ||||||
| 高(20) | 中(15) | 低(10) | 高·负(20/-7.76) | 中·负(15/-7.76) | 低·负(10/-7.76) | ||
| 强(1.15) | 67.0840 | 54.3931 | 40.9057 | 60.2650 | 43.8408 | 30.7087 | |
| 中(0.95) | 68.1775 | 55.2798 | 41.5725 | 61.2474 | 44.5555 | 31.2093 | |
| 弱(0.75) | 69.2867 | 56.1791 | 42.2488 | 62.2438 | 45.2803 | 31.7170 | |
表7 旅游业用水需求模型中相关指标的预测方法Table 7 Forecasting methods of related indicators in tourism water demand model |
| 指标 | 方法 | 说明 |
|---|---|---|
| | 基准年旅游业总规模为亿人天;各情况下旅游业规模正向发展速度为;E为发生突发事件时,相对于基准年,游客总规模增长倍数期望 | |
| 基准年地区旅游业住宿规模为亿人天;各情况下旅游业规模正向发展速度为 | ||
| 表示2015—2017年三年平均日消耗第种食物数量;借鉴拉萨游客食物浪费程度[37],新疆目前游客浪费食物程度为28.11%;各情况下预测年粮食浪费程度为 | ||
| 2006—2017年新疆每人每天生活用能源年均增长率为6.94%;表示基准年每人每天生活用能源;表示各情况下能耗节约率 | ||
| 基准年游览水足迹为;为地区公厕用水定额 | ||
| 基准年入境旅游商品消费为万元、国内旅游商品消费万元;表示不同旅游业规模发展速度下入境旅游商品消费增长率;表示入境旅游商品消费增长倍数;表示各情况下万元工业增加值用水量年均节水率;基准年万元工业增加值用水量为 |
注:基于2006—2017年基础数据,利用Eviews软件,采用OLS方法,估算“入境旅游商品销费增长率”与“入境游客规模增长率”之间的关系,得到入境旅游商品销费增长率=0.6218×入境游客规模增长率,t=4.264384,p=0.0017。 |
表8 2025年各情景新疆旅游业用水需求量测算结果Table 8 Calculation results of tourism water demand in various scenarios (108 m³) |
| 政府节 水力度(%) | 旅游业规模发展速度 | ||||||
|---|---|---|---|---|---|---|---|
| 不发生突发性事件(%) | 发生突发性事件(%) | ||||||
| 高(20) | 中(15) | 低(10) | 高·负(20/-7.76) | 中·负(15/-7.76) | 低·负(10/-7.76) | ||
| 强(1.15) | 86.7444 | 62.4143 | 43.5992 | 67.9793 | 49.7318 | 35.6206 | |
| 中(0.95) | 96.0145 | 69.0632 | 48.1290 | 75.2008 | 54.9873 | 39.2867 | |
| 弱(0.75) | 109.0589 | 78.4261 | 54.4896 | 85.3602 | 62.3857 | 44.4333 | |
表9 各情景下新疆旅游业用水供需适配性程度指数Table 9 Index of adaptability degree of water supply and demand for Xinjiang's tourism in each scenario |
| 政府节水力度 | 旅游业规模发展速度 | |||||||
|---|---|---|---|---|---|---|---|---|
| 不发生突发性事件 | 发生突发性事件 | |||||||
| 高 (20%) | 中 (15%) | 低 (10%) | 高·负 (20%/-7.76%) | 中·负 (15%/-7.76%) | 低·负 (10%/-7.76%) | |||
| 强 (1.15%) | 1.2931 | 1.1475 | 1.0658 | 1.1280 | 1.1344 | 1.1600 | ||
| 适配性程度指数 | 68.4706 | 83.4974 | 92.5396 | 85.6218 | 84.9244 | 82.1471 | ||
| 类别 | C | B | A | A | B | B | ||
| 中 (0.95%) | 1.4083 | 1.2493 | 1.1577 | 1.2278 | 1.2341 | 1.2588 | ||
| 适配性程度指数 | 57.7876 | 72.8083 | 82.3884 | 75.0001 | 74.3534 | 71.8549 | ||
| 类别 | C | B | B | B | B | B | ||
| 弱 (0.75%) | 1.5740 | 1.3960 | 1.2897 | 1.3714 | 1.3778 | 1.4009 | ||
| 适配性程度指数 | 44.1083 | 58.8780 | 68.7964 | 61.0952 | 60.5160 | 58.4395 | ||
| 类别 | D | C | C | C | C | C | ||
注:A、B、C、D分别代表“供需平衡”“供需基本平衡”“供需基本失衡”“供需严重失衡”状态。 |
| [1] |
龙江智, 朱鹤. 国土空间规划新时代旅游规划的定位与转型. 自然资源学报, 2020,35(7):1541-1555.
[
|
| [2] |
赵磊, 唐承财. 产业结构变迁、旅游业与经济增长: 来自中国的经验证据. 资源科学, 2017,39(10):1918-1929.
[
|
| [3] |
黄震方, 葛军莲, 储少莹. 国家战略背景下旅游资源的理论内涵与科学问题. 自然资源学报, 2020,35(7):1511-1524.
[
|
| [4] |
新疆维吾尔自治区统计局, 国家统计局新疆调查总队. 新疆统计年鉴 2007—2018. 北京: 中国统计出版社, 2007—2018.
[ Statistics Bureau of Xinjiang Uygur Autonomous Region, Xinjiang Survey Team, National Bureau of Statistics. Xinjiang Statistical Yearbook 2007-2018. Beijing: China Statistical Press, 2007-2018.]
|
| [5] |
|
| [6] |
|
| [7] |
|
| [8] |
|
| [9] |
|
| [10] |
|
| [11] |
|
| [12] |
李嫄, 王艳婷. 京津冀旅游行业全寿命水足迹的核算与预测研究. 河北工业大学学报: 社会科学版, 2015,7(2):16-22, 52.
[
|
| [13] |
王群, 吴春柳, 邓洪波, 等. 旅游地水足迹测度模型及实证分析. 地理科学, 2015,35(4):448-455.
[
|
| [14] |
刘俊, 黄莉, 吴俐君, 等. 青城后山遗产地乡村旅游直接和虚拟用水量研究. 旅游学刊, 2018,33(9):108-116.
[
|
| [15] |
|
| [16] |
|
| [17] |
王静, 周庆华. 西安段秦岭北麓旅游水资源承载力. 西北大学学报: 自然科学版, 2015,45(6):996-1000.
[
|
| [18] |
|
| [19] |
|
| [20] |
王慧敏. 落实最严格水资源管理的适应性政策选择研究. 河海大学学报: 哲学社会科学版, 2016, 18(3): 38-43, 90-91.
[
|
| [21] |
左其亭. 水资源适应性利用理论及其在治水实践中的应用前景. 南水北调与水利科技, 2017,15(1):18-24.
[
|
| [22] |
|
| [23] |
|
| [24] |
张玲玲, 王宗志, 李晓惠, 等. 总量控制约束下区域用水结构调控策略及动态模拟. 长江流域资源与环境, 2015,24(1):90-96.
[
|
| [25] |
|
| [26] |
|
| [27] |
黄大勇. 乌江水资源安全与旅游产业的战略互动. 南通大学学报: 社会科学版, 2017,33(5):23-28.
[
|
| [28] |
|
| [29] |
揭秋云. 海南省旅游水资源承载力研究. 海南: 海南大学, 2011.
[
|
| [30] |
程小可, 李玲玲. 会计盈余与股票市场回报非线性关系研究: 与线性关系的对比及来自沪市的证据. 中国软科学, 2004, (2):37-43.
[
|
| [31] |
章锦河, 张捷. 旅游生态足迹模型及黄山市实证分析. 地理学报, 2004,59(5):763-771.
[
|
| [32] |
孙才志, 刘玉玉, 陈丽新, 等. 基于基尼系数和锡尔指数的中国水足迹强度时空差异变化格局. 生态学报, 2010,30(5):1312-1321.
[
|
| [33] |
常玉婷, 刘海隆, 包安明, 等. 基于水足迹理论的西北干旱区水资源承载力的研究. 石河子大学学报: 自然科学版, 2015,33(1):116-121.
[
|
| [34] |
|
| [35] |
阮文奇, 张舒宁, 李勇泉. 自然灾害事件下景区风险管理: 危机信息流扩散与旅游流响应. 南开管理评论, 2020,23(2):63-74.
[
|
| [36] |
孙根年, 舒镜镜, 马丽君, 等. 五大危机事件对美国出入境旅游的影响: 基于本底线模型的高分辨率分析. 地理科学进展, 2010,29(8):987-996.
[
|
| [37] |
张盼盼, 王灵恩, 白军飞, 等. 旅游城市餐饮消费者食物浪费行为研究. 资源科学, 2018,40(6):1186-1195.
[
|
/
| 〈 |
|
〉 |