
JOURNAL OF NATURAL RESOURCES >
How can rural land consolidation increase farmers' income: Heterogeneity analysis based on consolidation modes and geomorphic types
Received date: 2020-06-19
Revised date: 2020-10-31
Online published: 2022-02-28
Copyright
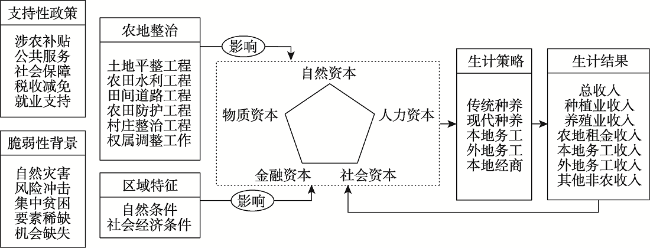
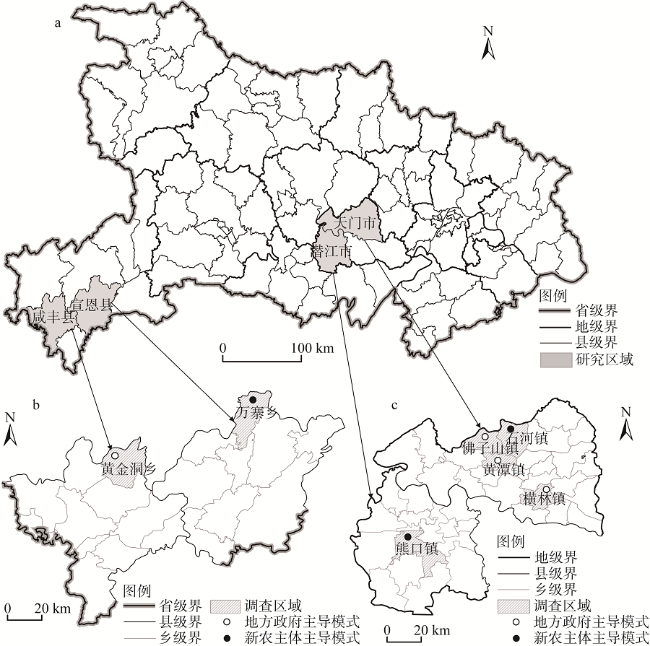
Based on the theoretical foundations underpinning the Department for International Development's sustainable livelihood framework, this paper constructed an influence mechanism of rural land consolidation projects (RLCP) on farmers' income, and further conducted the heterogeneous analysis of its consolidation modes and geomorphic types. Based on the survey data collected from 483 farmers of Tianmen city and Qianjiang city in Jianghan Plain area, Xuan'en and Xianfeng counties in Wuling Mountainous Area, difference-in-differences (DID) model was employed to examine whether the implementation of land consolidation affects farmers' income, the impact of different RLCP modes of the same geomorphic type on farmers' income, and the impact of the same RLCP mode of different geomorphic types on farmers' income. The results indicate that: (1) Both the local government-dominant mode and new agricultural business entity-dominant mode RLCP can significantly increase farmers' income. (2) The income-increasing effect of the new agricultural business entity dominant RLCP is far greater than that of the local government-dominant mode RLCP, and even if in the same geomorphic types, there are significant differences in the degree, direction, and significance of the impact of different RLCP modes on farmers' income. (3) The income-increasing effect of plain RLCP is evidently higher than that of the mountain RLCP, but even if in the same consolidation mode, there are significant differences in the degree, direction, and significance of the impact of different geomorphic RLCP types on farmers' income. Therefore, the income effect of RLCP is affected by the consolidation modes and geomorphic types.
ZHANG Chao-zheng , YANG Gang-qiao . How can rural land consolidation increase farmers' income: Heterogeneity analysis based on consolidation modes and geomorphic types[J]. JOURNAL OF NATURAL RESOURCES, 2021 , 36(12) : 3114 -3130 . DOI: 10.31497/zrzyxb.20211208
表1 变量的定义与说明Table 1 Definition and description of variables |
| 变量类型 | 变量名词 | 代码 | 含义 |
|---|---|---|---|
| 被解释变量 | 人均纯收入 | Y1it | 家庭总收入/总人口/元 |
| 人均种植业纯收入 | Y2it | 家庭种植业收入/总人口/元 | |
| 人均养殖业纯收入 | Y3it | 家庭养殖业(如畜禽和水产养殖)收入/总人口/元 | |
| 人均农地租金收入 | Y4it | 家庭农地租金收入/总人口/元 | |
| 人均本地务工收入 | Y5it | 家庭本地务工收入/总人口/元 | |
| 人均外地务工收入 | Y6it | 家庭外地务工收入/总人口/元 | |
| 人均本地经商收入 | Y7it | 家庭本地经商收入(如民宿、小卖部和农家乐收入)/总人口/元 | |
| 人均其他非农收入 | Y8it | 家庭其他非农收入(如外地经商和农机租赁收入)/总人口/元 | |
| 解释变量 | 组别虚拟变量 | dBit | 对照组=0;处理组=1 |
| 时间虚拟变量 | dTit | 整治前=0;整治后=1 | |
| 交互项 | dBit×dTit | 组别虚拟变量与时间虚拟变量的交互项 | |
| 控制变量 | 劳动力比例 | X1it | 家庭主要劳动力数量/总人口 |
| 劳均年龄 | X2it | 家庭主要劳动力平均年龄/岁 | |
| 劳均受教育年限 | X3it | 家庭主要劳动力平均受教育年限/年 | |
| 人均土地经营面积 | X4it | 家庭实际经营的耕地和园地面积之和/总人口/hm2 |
表2 江汉平原农地整治前后不同组别农户各项收入的统计描述Table 2 With- and between-group difference in income before and after rural land consolidation in Jianghan Plain |
| 比较组别 | 比较项目 | 处理组 | 对照组 | 双重差分值 | ||||
|---|---|---|---|---|---|---|---|---|
| 2014年 | 2017年 | 变化量 | 2014年 | 2017年 | 变化量 | |||
| 处理组1 vs 对照组1 | 人均纯收入 | 17679 | 22205 | 4526 | 16383 | 19488 | 3105 | 1420 |
| 人均种植业纯收入 | 2362 | 2372 | 10 | 2622 | 2695 | 74 | -64 | |
| 人均养殖业纯收入 | 21 | 182 | 161 | 9 | 42 | 32 | 129 | |
| 人均农地租金收入 | 9 | 86 | 77 | 13 | 28 | 15 | 61 | |
| 人均本地务工收入 | 2356 | 3217 | 861 | 1759 | 2238 | 480 | 381 | |
| 人均外地务工收入 | 11819 | 14773 | 2954 | 10608 | 12732 | 2124 | 830 | |
| 人均本地经商收入 | 72 | 92 | 20 | 396 | 486 | 89 | -70 | |
| 人均其他非农收入 | 1040 | 1484 | 444 | 976 | 1267 | 291 | 153 | |
| 处理组2 vs 对照组2 | 人均纯收入 | 20508 | 28659 | 8151 | 19192 | 24405 | 5213 | 2938 |
| 人均种植业纯收入 | 3608 | 1130 | -2478 | 2589 | 2559 | -30 | -2448 | |
| 人均养殖业纯收入 | 241 | 3952 | 3710 | 1237 | 2444 | 1206 | 2504 | |
| 人均农地租金收入 | 46 | 1998 | 1952 | 15 | 68 | 53 | 1899 | |
| 人均本地务工收入 | 2505 | 4352 | 1847 | 2367 | 3011 | 644 | 1203 | |
| 人均外地务工收入 | 11410 | 13253 | 1842 | 11880 | 14857 | 2977 | -1135 | |
| 人均本地经商收入 | 544 | 667 | 123 | 67 | 82 | 15 | 108 | |
| 人均其他非农收入 | 2154 | 3309 | 1155 | 1036 | 1384 | 348 | 807 | |
| 处理组3 vs 对照组3 | 人均纯收入 | 20508 | 28659 | 8151 | 17679 | 22205 | 4526 | 3626 |
| 人均种植业纯收入 | 3608 | 1130 | -2478 | 2362 | 2372 | 10 | -2488 | |
| 人均养殖业纯收入 | 241 | 3952 | 3710 | 21 | 182 | 161 | 3549 | |
| 人均农地租金收入 | 46 | 1998 | 1952 | 9 | 86 | 77 | 1875 | |
| 人均本地务工收入 | 2505 | 4352 | 1847 | 2356 | 3217 | 861 | 986 | |
| 人均外地务工收入 | 11410 | 13253 | 1842 | 11819 | 14773 | 2954 | -1111 | |
| 人均本地经商收入 | 544 | 667 | 123 | 72 | 92 | 20 | 103 | |
| 人均其他非农收入 | 2154 | 3309 | 1155 | 1040 | 1484 | 444 | 711 | |
注:为使结果呈现更为整洁,对各项人均收入进行取整。下同。 |
表3 江汉平原不同农地整治模式对农户收入影响的FD模型估计结果Table 3 Estimation results of rural land consolidation on farmers' income with FD model in Jianghan Plain |
| 比较组别 | 变量 | Y1it | Y2it | Y3it | Y4it | Y5it | Y6it | Y7it | Y8it |
|---|---|---|---|---|---|---|---|---|---|
| 处理组1 vs 对照组1 | dBit×dTit | 1309.22*** | -139.35*** | 68.08 | 66.65** | 397.54** | 842.58*** | -71.62 | 145.35 |
| (4.05) | (-2.70) | (0.74) | (2.49) | (1.98) | (3.03) | (-1.52) | (0.90) | ||
| 处理组2 vs 对照组2 | dBit×dTit | 5115.22*** | -1226.88*** | 4870.27*** | 1598.64*** | 689.75* | -1771.50*** | 116.61 | 838.33* |
| (5.92) | (-6.12) | (4.56) | (12.86) | (1.73) | (-2.67) | (0.99) | (1.82) | ||
| 处理组3 vs 对照组3 | dBit×dTit | 5311.90*** | -1321.42*** | 5489.07*** | 1591.88*** | 507.51 | -1801.08*** | 112.35 | 733.60* |
| (6.80) | (-6.88) | (5.34) | (13.02) | (1.33) | (-2.88) | (0.96) | (1.67) |
注:限于文章篇幅和研究重点,仅汇报交互项dBit×dTit的系数;***、**和*分别1%、5%和10%的显著性水平,括号内为对应的T值,下同。 |
表4 武陵山区农地整治前后不同组别农户各项收入的统计描述Table 4 With- and between-group difference in farmers' income before and after rural land consolidation in Wuling Mountains |
| 比较组别 | 比较项目 | 处理组 | 对照组 | 双重差分值 | ||||
|---|---|---|---|---|---|---|---|---|
| 2014年 | 2017年 | 变化量 | 2014年 | 2017年 | 变化量 | |||
| 处理组1 vs 对照组1 | 人均纯收入 | 16980 | 20640 | 3660 | 14328 | 16148 | 1820 | 1840 |
| 人均种植业纯收入 | 260 | 2714 | 110 | 3907 | 4002 | 95 | 15 | |
| 人均养殖业纯收入 | 0 | 0 | 0 | 0 | 0 | 0 | 0 | |
| 人均农地租金收入 | 7 | 87 | 80 | 0 | 19 | 19 | 61 | |
| 人均本地务工收入 | 1908 | 2591 | 683 | 370 | 444 | 74 | 609 | |
| 人均外地务工收入 | 10281 | 12618 | 2338 | 9648 | 11121 | 1473 | 865 | |
| 人均本地经商收入 | 250 | 432 | 182 | 0 | 0 | 0 | 182 | |
| 人均其他非农收入 | 1930 | 2198 | 268 | 403 | 562 | 159 | 109 | |
| 处理组2 vs 对照组2 | 人均纯收入 | 17843 | 23797 | 5955 | 16583 | 18472 | 1889 | 4066 |
| 人均种植业纯收入 | 3399 | 208 | -1315 | 4221 | 4423 | 202 | -1516 | |
| 人均养殖业纯收入 | 63 | 68 | 5 | 0 | 0 | 0 | 5 | |
| 人均农地租金收入 | 66 | 821 | 755 | 0 | 0 | 0 | 755 | |
| 人均本地务工收入 | 3710 | 6592 | 2882 | 7912 | 8820 | 908 | 1974 | |
| 人均外地务工收入 | 869 | 11760 | 3063 | 4119 | 4774 | 655 | 2408 | |
| 人均本地经商收入 | 988 | 1293 | 305 | 0 | 0 | 0 | 305 | |
| 人均其他非农收入 | 920 | 1179 | 259 | 331 | 455 | 124 | 135 | |
| 处理组3 vs 对照组3 | 人均纯收入 | 17843 | 23797 | 5955 | 16980 | 20640 | 3660 | 2295 |
| 人均种植业纯收入 | 3399 | 2084 | -1315 | 2604 | 2714 | 110 | -1425 | |
| 人均养殖业纯收入 | 63 | 68 | 5 | 0 | 0 | 0 | 5 | |
| 人均农地租金收入 | 66 | 821 | 755 | 7 | 87 | 80 | 675 | |
| 人均本地务工收入 | 3710 | 6592.41 | 2882 | 1908 | 2591 | 683 | 2199 | |
| 人均外地务工收入 | 8697 | 11760 | 3063 | 10281 | 12618 | 2338 | 725 | |
| 人均本地经商收入 | 988 | 1293 | 305 | 250 | 432 | 182 | 123 | |
| 人均其他非农收入 | 920 | 1179 | 259 | 1930 | 2198 | 268 | -9 | |
表5 武陵山区不同农地整治模式对农户各项收入影响的FD模型估计结果Table 5 Estimation results of rural land consolidation on farmers' income with FD model in Wuling Mountains |
| 比较组别 | 变量 | Y1it | Y2it | Y3it | Y4it | Y5it | Y6it | Y7it | Y8it |
|---|---|---|---|---|---|---|---|---|---|
| 处理组1 vs 对照组1 | dBit×dTit | 1896.85*** | 58.51 | — | 29.19 | 701.06** | 768.62 | 200.83 | 138.65 |
| (3.86) | (0.47) | — | (0.84) | (2.33) | (1.43) | (1.42) | (0.71) | ||
| 处理组2 vs 对照组2 | dBit×dTit | 4167.93*** | -85.58 | 6.36 | 223.52*** | 1221.46** | 2456.27*** | 257.03** | 109.31 |
| (4.98) | (-1.06) | (0.97) | (2.91) | (2.16) | (3.05) | (2.38) | (0.96) | ||
| 处理组3vs 对照组3 | dBit×dTit | 2021.39** | -717.41* | 5.79 | 375.07*** | 1803.57*** | 492.27*** | 91.27 | -29.17 |
| (2.46) | (-1.94) | (0.98) | (2.88) | (3.11) | (0.59) | (0.43) | (-0.14) |
表6 不同地貌农地整治前后不同组别农户各项收入的统计描述Table 6 With- and between-group difference in farmers' income before and after rural land consolidation in different geomorphic types |
| 比较组别 | 比较项目 | 处理组 | 对照组 | 双重差分值 | ||||
|---|---|---|---|---|---|---|---|---|
| 2014年 | 2017年 | 变化量 | 2014年 | 2017年 | 变化量 | |||
| 处理组1 vs 对照组1 | 人均纯收入 | 17679 | 22205 | 4526 | 16980 | 20640 | 3660 | 866 |
| 人均种植业纯收入 | 2362 | 2372 | 10 | 2604 | 2714 | 110 | -100 | |
| 人均养殖业纯收入 | 21 | 182 | 161 | 0 | 0 | 0 | 161 | |
| 人均农地租金收入 | 9 | 86 | 77 | 7 | 87 | 80 | -3 | |
| 人均本地务工收入 | 2356 | 3217 | 861 | 1908 | 2591 | 683 | 178 | |
| 人均外地务工收入 | 11819 | 14773 | 2954 | 10281 | 12618 | 2338 | 616 | |
| 人均本地经商收入 | 72 | 92 | 20 | 250 | 432 | 182 | -162 | |
| 人均其他非农收入 | 1040 | 1484 | 444 | 1930 | 2198 | 268 | 176 | |
| 处理组2 vs 对照组2 | 人均纯收入 | 20508 | 28659 | 8151 | 17843 | 23797 | 5955 | 2197 |
| 人均种植业纯收入 | 3608 | 1130 | -2478 | 3399 | 2084 | -1315 | -1163 | |
| 人均养殖业纯收入 | 241 | 3952 | 3710 | 63 | 68 | 5 | 3705 | |
| 人均农地租金收入 | 46 | 1998 | 1952 | 66 | 821 | 755 | 1197 | |
| 人均本地务工收入 | 2505 | 4352 | 1847 | 3710 | 6592 | 2882 | -1035 | |
| 人均外地务工收入 | 11410 | 13253 | 1842 | 8697 | 11760 | 3063 | -1221 | |
| 人均本地经商收入 | 544 | 667 | 123 | 988 | 1293 | 305 | -182 | |
| 人均其他非农收入 | 2154 | 3309 | 1155 | 920 | 1179 | 259 | 896 | |
表7 不同地貌同一农地整治模式对农户各项收入影响的FD模型估计结果Table 7 Estimation results of rural land consolidation on farmers' income with FD model in different geomorphic types |
| 比较组别 | 变量 | Y1it | Y2it | Y3it | Y4it | Y5it | Y6it | Y7it | Y8it |
|---|---|---|---|---|---|---|---|---|---|
| 处理组1 vs 对照组1 | dBit×dTit | 3977.60*** | 163.94** | 210.96 | 53.68* | 743.85*** | 2376.51*** | 189.14 | 239.52 |
| (8.30) | (2.15) | (1.05) | (1.66) | (2.74) | (5.22) | (1.47) | (1.39) | ||
| 处理组2 vs 对照组2 | dBit×dTit | 5878.51** | -778.70** | 520.90* | 562.18*** | 2633.50*** | 2511.51*** | 301.94* | 127.17 |
| (8.76) | (-2.40) | (1.93) | (3.84) | (5.93) | (4.05) | (1.95) | (0.67) |
| [1] |
信桂新, 杨朝现, 魏朝富, 等. 人地协调的土地整治模式与实践. 农业工程学报, 2015,31(19):262-275.
[
|
| [2] |
龙花楼. 论土地整治与乡村空间重构. 地理学报, 2013,63(8):1019-1028l.
[
|
| [3] |
龙花楼, 张英男, 屠爽爽. 论土地整治与乡村振兴. 地理学报, 2018,73(10):1837-1849.
[
|
| [4] |
胡银根, 董文静, 余依云, 等. 土地整治供给侧结构性改革与乡村重构: 潜江“华山模式”实证研究. 地理科学进展, 2018,37(5):731-738.
[
|
| [5] |
刘新卫, 杨华珂, 郧文聚. 土地整治促进贫困地区脱贫的模式及实证. 农业工程学报, 2018,34(5):242-247.
[
|
| [6] |
唐秀美, 潘瑜春, 刘玉, 等. 中国耕地整治投资实施模式与路径分析. 中国土地科学, 2016,30(8):56-62.
[
|
| [7] |
曹凑贵, 江洋, 汪金平, 等. 稻虾共作模式的“双刃性”及可持续发展策略. 中国生态农业学报, 2017,25(9):1245-1253.
[
|
| [8] |
汪箭, 杨钢桥. 农地整治对农户耕地流转行为决策的影响研究: 基于武汉和咸宁部分农户调查的实证. 中国土地科学, 2016,30(8):63-71.
[
|
| [9] |
张超正, 杨钢桥. 不同模式农地整治前后农户生计资本变化研究. 中国土地科学, 2018,32(10):90-96.
[
|
| [10] |
谢金华, 杨钢桥, 许玉光. 不同农地整治模式对农户生计策略的影响研究: 以江汉平原和鄂西南山区部分县市为例. 中国农村经济, 2018, (11):96-111.
[
|
| [11] |
赵雪雁. 地理学视角的可持续生计研究: 现状、问题与领域. 地理研究, 2017,36(10):1859-1872.
[
|
| [12] |
张正峰, 杨红, 谷晓坤. 土地整治对平原区及丘陵区田块利用的影响. 农业工程学报, 2013,29(3):1-8.
[
|
| [13] |
吴诗嫚, 叶艳妹, 张超正, 等. 可持续生计框架下农地整治权属调整对农户生计资本的影响研究. 中国土地科学, 2019,33(11):79-88.
[
|
| [14] |
王庶, 岳希明. 退耕还林、非农就业与农民增收: 基于21省面板数据的双重差分分析. 经济研究, 2017,52(4):106-119.
[
|
| [15] |
杨子, 马贤磊, 诸培新, 等. 土地流转与农民收入变化研究. 中国人口·资源与环境, 2017,27(5):111-120.
[
|
| [16] |
钱忠好, 王兴稳. 农地流转何以促进农户收入增加: 基于苏、桂、鄂、黑四省(区)农户调查数据的实证分析. 中国农村经济, 2016, (10):39-50.
[
|
| [17] |
张超正, 杨钢桥, 陈丹玲. 不同模式农地整治对农民生活满意度的影响差异研究: 基于生计资本总量和结构的中介效应分析. 长江流域资源与环境, 2020,29(6):1462-1472.
[
|
| [18] |
汪文雄, 朱欣, 余利红, 等. 不同模式下农地整治前后土地利用效率的比较研究. 自然资源学报, 2015,30(7):1104-1117.
[
|
| [19] |
张利国, 王占岐, 李冰清. 湖北省土地整治项目碳效应核算及其分析. 自然资源学报, 2018,33(11):2006-2019.
[
|
| [20] |
陈文科, 宋伟, 庹忠辉, 等. 构建统筹城乡发展长效机制的几个问题: 以湖北省为案例的研究. 农业经济问题, 2011, (7):10-15,110.
[
|
| [21] |
信桂新, 杨朝现, 邵景安, 等. 基于农地流转的山地丘陵区土地整治技术体系优化及实证. 农业工程学报, 2017,33(6):246-256.
[
|
| [22] |
高明秀, 赵庚星. 土地整理与新农村建设耦合关系模型研究. 中国土地科学, 2012,26(5):82-87.
[
|
| [23] |
刘晨芳, 赵微. 农地整治对农户生计策略的影响分析: 基于PSM-DID方法的实证研究. 自然资源学报, 2018,33(9):1613-1626.
[
|
| [24] |
张超正, 杨钢桥, 文高辉. 不同农地整治模式对农户生态系统服务依赖度的影响. 农业工程学报, 2019,35(6):261-270.
[
|
| [25] |
范垚, 杨庆媛, 张瑞頠, 等. 基于城乡统筹发展的农村土地综合整治绩效研究: 以重庆市典型项目区为例. 中国土地科学, 2016,30(11):68-77.
[
|
| [26] |
张超正, 杨钢桥, 陈丹玲, 等. 不同模式农地整治的收入分配效应及其区域差异. 农业现代化研究, 2019,40(4):565-573.
[
|
| [27] |
国土资源部土地整治中心. 中国土地整治发展研究报告(No.2). 北京: 社会科学文献出版社, 2014: 218-225.
[ Land Consolidation Center of Ministry of Land and Resources. China land consolidation and development research report (NO.2). Beijing: Social Sciences Academic Press, 2014: 218-225.]
|
| [28] |
臧玉珠, 刘彦随, 杨园园, 等. 中国精准扶贫土地整治的典型模式. 地理研究, 2019,38(4):856-868.
[
|
| [29] |
张晓滨, 叶艳妹, 陈莎, 等. 国外农地整理权属调整技术方法研究进展及借鉴. 中国土地科学, 2018,32(11):81-88.
[
|
| [30] |
吴诗嫚, 李祎琛, 卢新海, 等. 利益均衡下农地整治权属关系调整的研究进展. 中国土地科学, 2016,30(7):88-96.
[
|
| [31] |
文高辉, 杨钢桥, 汪文雄, 等. 基于农户视角的耕地细碎化程度评价: 以湖北省“江夏区—咸安区—通山县”为例. 地理科学进展, 2016,35(9):1129-1143.
[
|
| [32] |
湖北省统计局,国家统计局湖北调查总队. 湖北统计年鉴2018. 北京: 中国统计出版社, 2018.
[ Statistical Bureau of Hubei Province, Survey Office of the National Bureau of Statistics in Hubei. Hubei Statistical Yearbook 2018. Beijing: China Statistics Press, 2018.]
|
| [33] |
国土资源部土地整治中心. 湖北土地整治助推精准扶贫调研报告. 土地整治动态, 2017, (9):1-14.
[ Land Consolidation Center of Ministry of Land and Resources. Report of land consolidation promoting poverty alleviation in Hubei province. Land Consolidation Trends, 2017, (9):1-14.]
|
| [34] |
谢金华, 杨钢桥, 汪箭, 等. 不同农地整治模式对耕地生产价值和生态价值的影响: 基于天门、潜江部分农户的实证分析. 自然资源学报, 2019,34(11):2333-2347.
[
|
| [35] |
|
| [36] |
郭君平, 吴国宝. 社区综合发展减贫方式的农户收入效应评价: 以亚洲开发银行贵州纳雍社区扶贫示范项目为例. 中国农村观察, 2013, (6):22-30.
[
|
| [37] |
胡业翠, 武淑芳, 王静. 基于参与式调查的广西生态移民迁入区农户收入效应评价. 农业工程学报, 2016,32(21):264-270.
[
|
/
| 〈 |
|
〉 |