
JOURNAL OF NATURAL RESOURCES >
Impact of economic agglomeration on land use eco-efficiency of three major urban agglomerations in China
Received date: 2020-02-15
Request revised date: 2020-06-19
Online published: 2022-01-28
Copyright
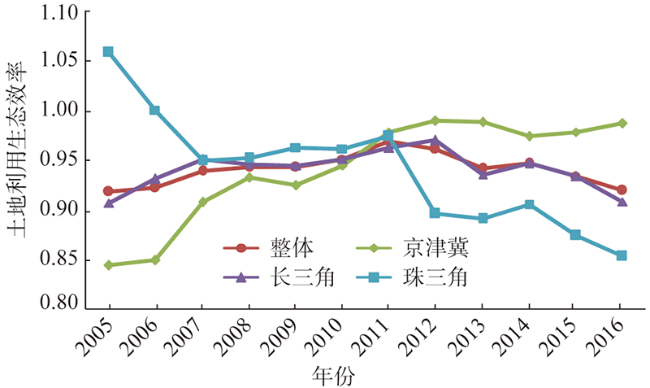
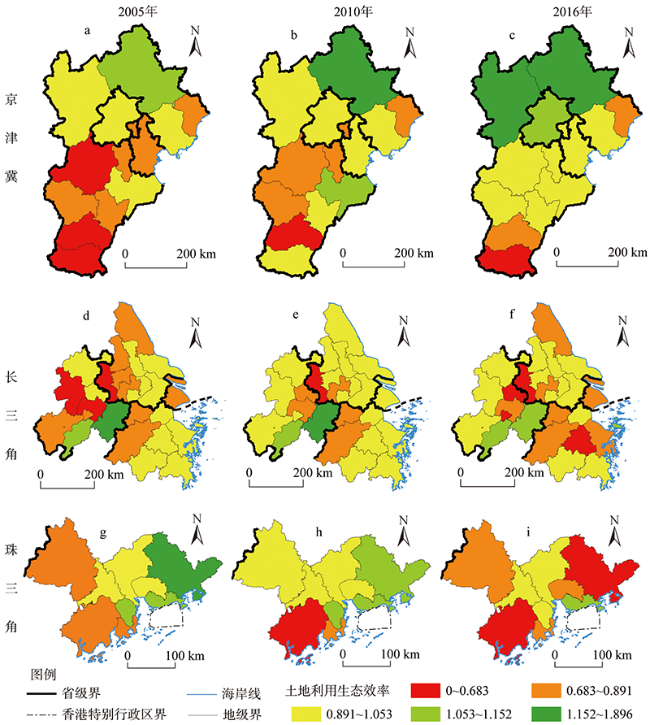
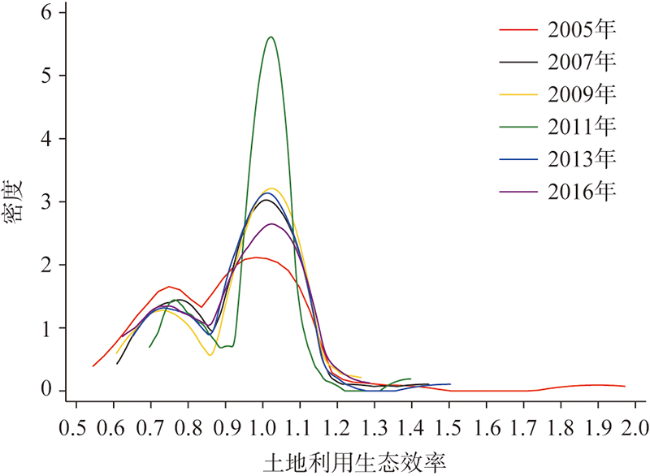
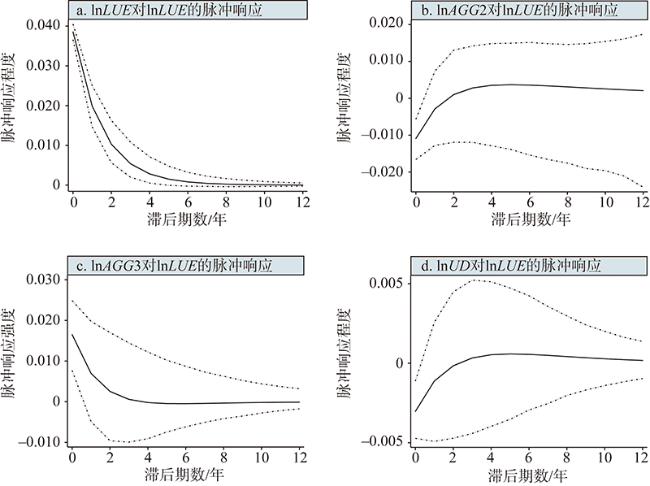
Analyzing the impact of economic agglomeration on land use eco-efficiency in urban agglomerations is helpful in improving cities' competitiveness and the quality of environment. Using the Super-EBM of undesirable output, in this article we measured the land use eco-efficiency of the three major urban agglomerations of China, namely, the Beijing-Tianjin-Hebei Region, the Yangtze River Delta and the Pearl River Delta, from 2005 to 2016. Then it analyzed the spatio-temporal evolutionary characteristics of land use eco-efficiency by using Kernel density function. Finally, panel threshold regression model and panel vector auto regression model (PVAR) were established. We discussed the non-linear impact and linear direct impacts of economic agglomeration on the land use eco-efficiency in the urban agglomerations from the perspective of industry and population. The main results are as follows. (1) During 2005-2016, the land use eco-efficiency of the three major urban agglomerations showed an evolutionary characteristic of convergence and differentiation and each urban agglomeration had its own spatio-temporal evolutionary rules. (2) The tertiary industrial agglomeration level and population agglomeration level showed a single threshold effect on the land use eco-efficiency of the urban agglomerations. Therefore, moderate industrial agglomeration and population agglomeration have a positive promotion effect on the land use eco-efficiency of the urban agglomerations, otherwise, the promotion effect will decline or even have a negative impact. (3) The direct impact of the tertiary industry agglomeration level and land use eco-efficiency on the land use eco-efficiency reached the peak from the beginning and then converged to 0, while the secondary industry agglomeration level and population agglomeration level had negative impacts and then changed to be positive. When formulating policies concerning economic development and land use, the local governments must give full play to the positive impact of economic agglomeration on the environment. In addition, they should pay attention to the appropriateness and dynamics of different economic agglomerations.
SONG Jia-peng , CHEN Song-lin . Impact of economic agglomeration on land use eco-efficiency of three major urban agglomerations in China[J]. JOURNAL OF NATURAL RESOURCES, 2021 , 36(11) : 2865 -2877 . DOI: 10.31497/zrzyxb.20211111
表1 城市群土地利用生态效率评价体系Table 1 Index system of land use eco-efficiency evaluation of urban agglomerations |
| 指标类型 | 一级指标 | 二级指标 |
|---|---|---|
| 投入指标 | 资本要素投入(K) | 地均固定资产投入 |
| 劳动投入(L) | 地均从业人员 | |
| 能源投入(E) | 地均供水总量、地均用电量 | |
| 自然要素投入(M) | 建成区面积 | |
| 产出指标 | 效益产出(期望产出) | 地均地方生产总值 |
| 污染产出(非期望产出) | 地均工业废水排放量、地均工业烟尘排放量、地均工业二氧化硫排放量 |
表2 各变量方差膨胀因子Table 2 Variance inflation factor of variables |
| AGG2 | AGG3 | UD | SCAL | TECH | OPEN | 均值 | |
|---|---|---|---|---|---|---|---|
| VIF | 4.62 | 4.49 | 1.62 | 1.14 | 2.45 | 3.02 | 2.89 |
| 1/VIF | 0.22 | 0.22 | 0.62 | 0.88 | 0.41 | 0.33 | 0.35 |
表3 门槛效应显著性检验结果Table 3 Threshold effect significant test result |
| 门槛变量 | 门槛个数 | F值 | P值 | BS次数/次 | 临界值 | ||
|---|---|---|---|---|---|---|---|
| 1% | 5% | 10% | |||||
| lnAGG2 | 一门槛 | 19.88 | 0.1580 | 500 | 39.3925 | 28.4965 | 23.4223 |
| lnAGG3 | 一门槛 | 43.28** | 0.0120 | 500 | 43.4634 | 24.6741 | 20.8968 |
| 二门槛 | 6.90 | 0.5240 | 500 | 41.1142 | 24.8727 | 17.7062 | |
| lnUD | 一门槛 | 81.22*** | 0.0020 | 500 | 63.9877 | 47.1277 | 37.7572 |
| 二门槛 | 15.44 | 0.6440 | 500 | 212.9259 | 160.1977 | 121.6815 | |
注:***、**分别表示1%、5%的显著性水平,下同;BS是自抽样法(Bootstrap)的简写。 |
表4 门槛值估计Table 4 Estimation of threshold values |
| 门槛变量 | 门槛估计值 | 95%置信区间 |
|---|---|---|
| lnAGG3 | -0.7139 | [-0.779, -0.693] |
| lnUD | 5.6949 | [5.674, 5.762] |
表5 模型参数估计结果Table 5 Estimation of result of model parameters |
| 变量 | 回归系数 | t值 | 变量 | 回归系数 | t值 |
|---|---|---|---|---|---|
| lnSCAL | 0.0030 | 0.07 | lnSCAL | -0.0088 | -0.18 |
| lnTECH | 0.0047 | 1.10 | lnTECH | 0.0066 | 1.58 |
| lnOPEN | 0.0167* | 1.68 | lnOPEN | 0.0082 | 0.84 |
| lnAGG3·1(lnAGG3≤ -0.7139) | 0.2576*** | 5.58 | lnUD·1(lnUD≤ 5.6949) | 0.2087*** | 3.30 |
| lnAGG3·1(lnAGG3>-0.7139) | -0.0729** | -2.28 | lnUD·1(lnUD>5.6949) | 0.1342** | 2.16 |
注:*表示10%的显著性水平,下同。 |
表6 各变量平稳性检验Table 6 Test for stationary of variables |
| 统计量 | LLC检验 | Hadri检验 |
|---|---|---|
| lnLUE | -8.279*** | 24.920*** |
| lnAGG2 | -3.059*** | 29.668*** |
| lnAGG3 | -4.140*** | 29.394*** |
| lnUD | -5.006*** | 21.588*** |
表7 各变量最优滞后项选择Table 7 The choice of lag order of variables |
| LAG | AGG2 | AGG3 | UD | ||||||||
|---|---|---|---|---|---|---|---|---|---|---|---|
| AIC | BIC | HQIC | AIC | BIC | HQIC | AIC | BIC | HQIC | |||
| 1 | -4.30* | -3.43* | -3.95* | -3.40* | -2.53* | -3.05* | -4.63 | -3.76 | -4.29 | ||
| 2 | -4.23 | -3.25 | -3.84 | -3.24 | -2.26 | -2.86 | -6.53* | -5.55* | -6.14* | ||
| 3 | -4.10 | -2.99 | -3.66 | -3.13 | -2.02 | -2.69 | -6.31 | -5.20 | -5.87 | ||
| 4 | -3.84 | -2.57 | -3.33 | -3.12 | -1.85 | -2.61 | -6.02 | -4.75 | -5.51 | ||
| [1] |
张跃, 王图展, 刘莉. 中国市域工业污染对劳动力集聚的影响研究. 地理科学, 2019, 39(10):1654-1662.
[
|
| [2] |
赵娜, 王博, 刘燕. 城市群、集聚效应与“投资潮涌”: 基于中国20个城市群的实证研究. 中国工业经济, 2017, (11):81-99.
[
|
| [3] |
方创琳, 毛其智, 倪鹏飞. 中国城市群科学选择与分级发展的争鸣及探索. 地理学报, 2015, 70(4):515-527.
[
|
| [4] |
乔伟峰, 吴菊, 戈大专, 等. 快速城市化地区土地利用规划管控建设用地扩张成效评估: 以南京市为例. 地理研究, 2019, 38(11):2666-2680.
[
|
| [5] |
王亚华, 袁源, 王映力, 等. 人口城市化与土地城市化耦合发展关系及其机制研究: 以江苏省为例. 地理研究, 2017, 36(1):149-160.
[
|
| [6] |
任宇飞, 方创琳, 蔺雪芹. 中国东部沿海地区四大城市群生态效率评价. 地理学报, 2017, 72(11):2047-2063.
[
|
| [7] |
邵帅, 张可, 豆建民. 经济集聚的节能减排效应: 理论与中国经验. 管理世界, 2019, 35(1):36-60, 226.
[
|
| [8] |
周侃, 王强, 樊杰. 经济集聚对区域水污染物排放的影响及溢出效应. 自然资源学报, 2019, 34(7):1483-1495.
[
|
| [9] |
钟娟, 魏彦杰. 产业集聚与开放经济影响污染减排的空间效应分析. 中国人口·资源与环境, 2019, 29(5):98-107.
[
|
| [10] |
胡熠娜, 彭建, 刘焱序, 等. 区域生态效率研究进展. 生态学报, 2018, 38(23):14-21.
[
|
| [11] |
王耕, 李素娟, 马奇飞. 人类福祉视角下中国生态效率时空演化研究. 地理科学, 2018, 38(10):1597-1605.
[
|
| [12] |
罗能生, 李佳佳, 罗富政. 中国城镇化进程与区域生态效率关系的实证研究. 中国人口·资源与环境, 2013, 23(11):55-62.
[
|
| [13] |
|
| [14] |
|
| [15] |
马勇, 童昀, 任洁. 多源遥感数据支持下的县域尺度生态效率测算及稳健性检验: 以长江中游城市群为例. 自然资源学报, 2019, 34(6):1196-1208.
[
|
| [16] |
盖美, 聂晨. 环渤海地区生态效率评价及空间演化规律. 自然资源学报, 2019, 34(1):106-117.
[
|
| [17] |
杨勇, 邓祥征. 中国城市生态效率时空演变及影响因素的区域差异. 地理科学, 2019, 39(7):1111-1118.
[
|
| [18] |
郑德凤, 郝帅, 孙才志. 基于DEA-ESDA的农业生态效率评价及时空分异研究. 地理科学, 2018, 38(3):102-110.
[
|
| [19] |
盖美, 展亚荣. 中国沿海省区海洋生态效率空间格局演化及影响因素分析. 地理科学, 2019, 39(4):616-625.
[
|
| [20] |
杨皓然, 吴群. 碳排放视角下的江苏省土地利用转型生态效率研究: 基于混合方向性距离函数. 自然资源学报, 2017, 32(10):82-94.
[
|
| [21] |
林伯强, 谭睿鹏. 中国经济集聚与绿色经济效率. 经济研究, 2019, 54(2):119-132.
[
|
| [22] |
关伟, 许淑婷. 中国能源生态效率的空间格局与空间效应. 地理学报, 2015, 70(6):980-992.
[
|
| [23] |
陈万旭, 李江风, 曾杰, 等. 中国土地利用变化生态环境效应的空间分异性与形成机理. 地理研究, 2019, 38(9):63-77.
[
|
| [24] |
杨清可, 段学军, 王磊, 等. 基于“三生空间”的土地利用转型与生态环境效应: 以长江三角洲核心区为例. 地理科学, 2018, 38(1):100-109.
[
|
| [25] |
王德起, 庞晓庆. 京津冀城市群绿色土地利用效率研究. 中国人口·资源与环境, 2019, 29(4):68-76.
[
|
| [26] |
|
| [27] |
|
| [28] |
师博, 沈坤荣. 政府干预、经济集聚与能源效率. 管理世界, 2013, (10):6-18, 187.
[
|
| [29] |
郑慧, 贾珊, 赵昕. 新型城镇化背景下中国区域生态效率分析. 资源科学, 2017, 39(7):90-101.
[
|
| [30] |
|
/
| 〈 |
|
〉 |