
JOURNAL OF NATURAL RESOURCES >
The evaluation of red tourism development efficiency and its influencing factors: A case study of the red tourism region in Northern and Western Guizhou
Received date: 2021-04-19
Request revised date: 2021-08-16
Online published: 2022-01-28
Copyright
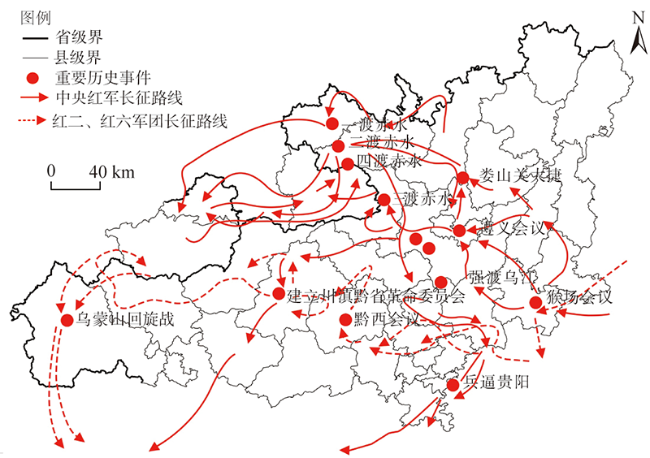
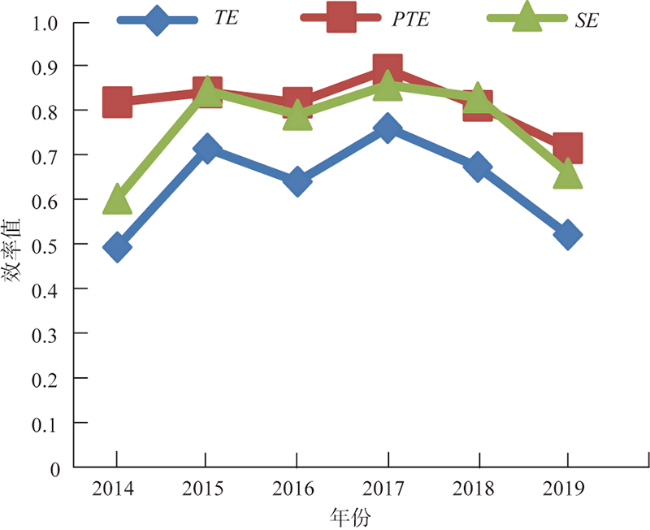
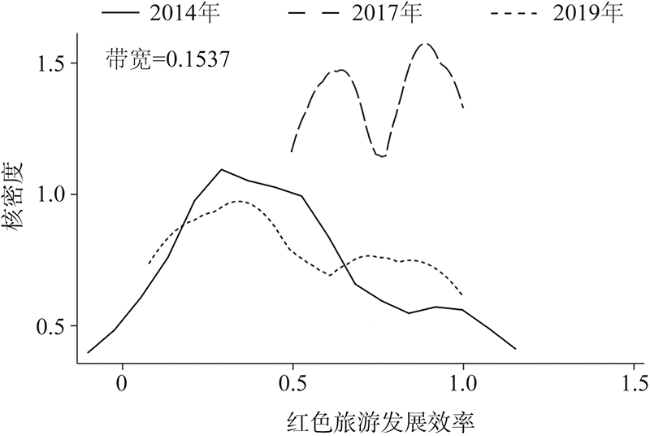
The development efficiency of red tourism represents the high-quality development level of red tourism. Taking the red tourism region in Northern and Western Guizhou province as the research object, we used DEA model and Malmquist index to measure the red tourism development efficiency of 17 counties in the study area from 2014 to 2019, and applied the kernel density function and multiple linear regression model to analyze the characteristics of its spatial evolution and key influencing factors. The research found that: (1) The overall efficiency of red tourism development in the study area is low. Thanks to the technological progress, the development efficiency of red tourism in most of the counties (cities, districts) is steadily improving. (2) The spatial distribution of red tourism development efficiency has the characteristics of agglomeration and heterogeneity, showing an "M" bimodal pattern as a whole, and the distribution of red tourism development efficiency varies greatly among counties (districts and cities). (3) Technological innovation, the advantage of red tourism resources, and the convenience of transportation are the main factors that affect the development efficiency of red tourism in the region. The economic intervention from the government to the tourism, the level of economic development, and the scale of talents have little impact on the efficiency of red tourism development in the region. The positive impact of structure on improving the efficiency of red tourism development in the region has not yet been highlighted.
YANG Li , CHEN Ji-jun , SHI Peng-fei , HUANG Guo-qing . The evaluation of red tourism development efficiency and its influencing factors: A case study of the red tourism region in Northern and Western Guizhou[J]. JOURNAL OF NATURAL RESOURCES, 2021 , 36(11) : 2763 -2777 . DOI: 10.31497/zrzyxb.20211104
表1 红色旅游发展效率投入产出指标Table 1 Input-output indicators of red tourism development efficiency |
| 指标类型 | 指标 | 变量 | 单位 |
|---|---|---|---|
| 投入指标 | 第三产业从业人员 | X1 | 人 |
| 红色旅游固定资产投资 | X2 | 亿元 | |
| 产出指标 | 红色旅游综合收入 | Y1 | 亿元 |
| 红色旅游接待人次 | Y2 | 万人次 |
图2 2014—2019年各年份各项效率均值Fig. 2 Average values of various efficiencies in each year from 2014 to 2019 |
表2 2014—2019年各县(区、市)各项效率均值Table 2 Average values of various efficiencies in the counties (districts and cities) of Guizhou from 2014 to 2019 |
| 地区 | TE | PTE | SE |
|---|---|---|---|
| 红花岗区 | 1.000 | 1.000 | 1.000 |
| 汇川区 | 1.000 | 1.000 | 1.000 |
| 播州区(遵义县) | 0.686 | 0.756 | 0.918 |
| 桐梓县 | 0.557 | 0.648 | 0.836 |
| 务川县 | 0.354 | 0.848 | 0.403 |
| 湄潭县 | 0.452 | 0.766 | 0.596 |
| 余庆县 | 0.610 | 0.916 | 0.643 |
| 仁怀市 | 0.842 | 1.000 | 0.842 |
| 习水县 | 0.548 | 0.607 | 0.906 |
| 赤水市 | 0.444 | 0.746 | 0.599 |
| 息烽县 | 0.590 | 0.914 | 0.642 |
| 清镇市 | 0.376 | 0.874 | 0.410 |
| 瓮安县 | 0.783 | 0.949 | 0.817 |
| 七星关区 | 0.853 | 0.988 | 0.861 |
| 赫章县 | 0.709 | 0.744 | 0.894 |
| 纳雍县 | 0.557 | 0.602 | 0.919 |
| 大方县 均值 | 0.458 0.636 | 0.553 0.818 | 0.740 0.766 |
表3 2014—2019年黔北黔西红色旅游区红色旅游发展效率全要素生产率及其分解Table 3 The Malmquist index and its decomposition of the red tourism development efficiency of the red tourism zone in Northern and Western Guizhou from 2014 to 2019 |
| 时间段/年 | EFFCH | TECH | PECH | SECH | TFP |
|---|---|---|---|---|---|
| 2014—2015 | 0.860 | 1.085 | 0.920 | 0.935 | 0.934 |
| 2015—2016 | 0.898 | 1.473 | 0.969 | 0.927 | 1.323 |
| 2016—2017 | 1.219 | 0.885 | 1.113 | 1.096 | 1.080 |
| 2017—2018 | 0.865 | 1.429 | 0.902 | 0.959 | 1.236 |
| 2018—2019 | 0.618 | 1.700 | 0.835 | 0.740 | 1.051 |
| 均值 | 0.872 | 1.280 | 0.943 | 0.924 | 1.116 |
表4 2014—2019年黔北黔西红色旅游区各县(区、市)红色旅游发展效率变化及其分解Table 4 The development efficiency and decomposition of red tourism in the counties (districts and cities) of the red tourism zone in Northern and Western Guizhou from 2014 to 2019 |
| 地区 | EFFCH | TECH | PECH | SECH | TFP |
|---|---|---|---|---|---|
| 红花岗区 | 1.000 | 1.189 | 1.000 | 1.000 | 1.189 |
| 汇川区 | 1.000 | 1.604 | 1.000 | 1.000 | 1.604 |
| 播州区(遵义县) | 0.928 | 1.216 | 1.009 | 0.920 | 1.129 |
| 桐梓县 | 1.027 | 1.215 | 1.010 | 1.017 | 1.247 |
| 务川县 | 0.818 | 1.517 | 0.924 | 0.886 | 1.241 |
| 湄潭县 | 0.841 | 1.314 | 0.894 | 0.941 | 1.105 |
| 余庆县 | 0.797 | 1.538 | 0.902 | 0.883 | 1.225 |
| 仁怀市 | 1.000 | 1.270 | 1.000 | 1.000 | 1.270 |
| 习水县 | 1.074 | 1.070 | 1.074 | 0.999 | 1.149 |
| 赤水市 | 0.935 | 1.085 | 0.973 | 0.961 | 1.015 |
| 息烽县 | 0.877 | 1.077 | 0.928 | 0.944 | 0.944 |
| 清镇市 | 0.599 | 1.622 | 0.873 | 0.687 | 0.973 |
| 瓮安县 | 0.987 | 1.012 | 1.000 | 0.987 | 0.999 |
| 七星关区 | 0.904 | 1.277 | 1.000 | 0.904 | 1.155 |
| 赫章县 | 0.690 | 1.313 | 0.833 | 0.828 | 0.906 |
| 纳雍县 | 0.881 | 1.127 | 0.882 | 0.999 | 0.993 |
| 大方县 | 0.649 | 1.572 | 0.783 | 0.829 | 1.020 |
| 均值 | 0.872 | 1.280 | 0.943 | 0.924 | 1.116 |
表5 红色旅游发展综合效率影响因素回归结果Table 5 Regression results of factors influencing the comprehensive efficiency of red tourism development |
| 影响因素 | 非标准化系数 | 标准误差 | 标准系数 | T统计量 | P值 | VIF值 | |
|---|---|---|---|---|---|---|---|
| 常量 | 0.214 | 0.304 | 0.704 | 0.499 | 5.897 | ||
| 经济发展水平 | 0.336 | 0.165 | 0.364* | 2.037 | 0.072 | 2.148 | |
| 产业结构 | 2.590 | 1.674 | 0.391 | 1.547 | 0.156 | 1.909 | |
| 政府对旅游经济的干预程度 | 0.366 | 0.139 | 0.264*** | 2.635 | 0.010 | 1.299 | |
| 红色旅游资源优势度 | 0.643 | 0.177 | 0.824*** | 3.628 | 0.006 | 1.576 | |
| 交通便利性 | 0.609 | 0.166 | 0.771*** | 3.671 | 0.005 | 2.971 | |
| 人才规模 | 0.506 | 0.229 | 0.395* | 2.215 | 0.054 | 5.167 | |
| 技术创新 | 2.944 | 0.661 | 1.053*** | 4.456 | 0.002 | 2.123 | |
注:1. 因变量:红色旅游发展综合效率;2. *、**、***分别表示在10%、5%和1%的水平上显著。 |
| [1] |
金鹏, 卢东, 曾小乔. 中国红色旅游研究评述. 资源开发与市场, 2017, 33(6):764-768.
[
|
| [2] |
王少华. 河南省旅游产业效率测度分解与时空演变. 经济经纬, 2019, 36(3):9-16.
[
|
| [3] |
|
| [4] |
|
| [5] |
|
| [6] |
|
| [7] |
|
| [8] |
|
| [9] |
|
| [10] |
邓洪波, 陆林. 基于DEA模型的安徽省城市旅游效率研究. 自然资源学报, 2014, 29(2):313-323.
[
|
| [11] |
鲁小波, 郭迪. 2001—2010年中国区域旅游效率评估. 地域研究与开发, 2014, 33(5):82-87.
[
|
| [12] |
李会琴, 王林, 闫晓冉. 基于DEA分析的湖北省旅游效率评价. 统计与决策, 2016, (2):65-67.
[
|
| [13] |
马晓龙, 保继刚. 中国主要城市旅游效率影响因素的演化. 经济地理, 2009, 29(7):1203-1208.
[
|
| [14] |
徐冬, 黄震方, 胡小海, 等. 浙江省县域旅游效率空间格局演变及其影响因素. 经济地理, 2018, 38(5):197-207.
[
|
| [15] |
游诗咏, 林仲源, 韩兆洲. 广东省城市旅游效率的时空特征及其增长机制. 资源科学, 2017, 39(8):1545-1559.
[
|
| [16] |
孙盼盼, 夏杰长. 中国省际旅游产业效率: 指标构建与实证分析. 经济与管理研究, 2014, (12):70-79.
[
|
| [17] |
张舒宁, 李勇泉, 阮文奇. 成渝经济区旅游发展效率测度及其影响因素研究. 资源开发与市场, 2017, 33(12):1523-1528.
[
|
| [18] |
王兆峰, 赵松松. 基于DEA-Malmquist模型的湖南省旅游产业效率时空动态演化及影响因素. 长江流域资源与环境, 2019, 28(8):1886-1897.
[
|
| [19] |
郭向阳, 穆学青, 明庆忠. 边疆省域旅游效率空间分异及驱动因素: 以云南省为例. 世界地理研究, 2020, 29(2):416-427.
[
|
| [20] |
生延超, 刘晴. 人力资本促进区域旅游经济效率的空间差异研究. 地理科学, 2020, 40(10):1710-1719.
[
|
| [21] |
潘秋玲, 宋玉强, 陈乐, 等. 陕西省县域旅游效率的空间格局及影响因素. 自然资源学报, 2021, 36(4):866-878.
[
|
| [22] |
王耀斌, 孙传玲, 蒋金萍. 基于三阶段DEA 模型的文化旅游效率与实证研究: 以甘肃省为例. 资源开发与市场, 2016, 32(1):125-128.
[
|
| [23] |
杨春梅, 赵宝福. 基于数据包络分析的中国冰雪旅游产业效率分析. 干旱区资源与环境, 2014, 28(1):169-174.
[
|
| [24] |
余汝艺, 梁留科, 孙亚楠, 等. 洛阳市村域尺度旅游效率分析与可达性研究. 地域研究与开发, 2020, 39(5):105-109.
[
|
| [25] |
龙祖坤, 李绪茂, 孔祥婧. 民俗旅游发展效率与规模研究: 以北京市为例. 华侨大学学报: 哲学社会科学版, 2017, (4):81-93.
[
|
| [26] |
国务院关于新时代支持革命老区振兴发展的意见. 中国政府网, http://www.gov.cn/zhengce/content/2021-02/20/content_5587874.htm
[Opinions of the State Council on supporting the revitalization and development of old revolutionary areas in the New Era. China Government Network, http://www.gov.cn/zhengce/content/2021-02/20/content_5587874.htm
|
| [27] |
王忠, 阎友兵. 基于TOPSIS方法的红色旅游绩效评价: 以领袖故里红三角为例. 经济地理, 2009, 29(3):516-520.
[
|
| [28] |
方世敏, 曹红春. 红色旅游景区经营管理绩效评价指标体系构建研究. 忻州师范学院学报, 2009, 25(2):43-47.
[
|
| [29] |
阎友兵, 殷建立. 基于社区居民视角的红色旅游发展绩效评价研究: 以韶山为例. 湖南财政经济学院学报, 2012, 28(4):35-39.
[
|
| [30] |
向延平, 陈友莲. 韶山红色旅游融合发展绩效评价研究. 湖南人文科技学院学报, 2016, 33(3):65-67.
[
|
| [31] |
黔北黔西红色旅游区. 新华网, http://news.cntv.cn/20110616/113037.shtml
[The Red Tourism Region in Northern and Western Guizhou. Xinhuanet, http://news.cntv.cn/20110616/113037.shtml
|
| [32] |
中国工农红军长征史料丛书编审委员会. 中国工农红军长征史料丛书图片. 北京: 解放军出版社, 2016: 21-49.
[Chinese Workers and Peasants Red Army Long March Historical Materials Series. Chinese Workers and Peasants Red Army Long March Historical Materials Series Picture. Beijing: People's Liberation Army Press, 2016: 21-49.]
|
| [33] |
力平, 余熙山, 殷子贤. 中国工农红军长征简史. 北京: 中共党史出版社, 2006: 76-100.
[
|
| [34] |
马占新, 马生昀, 包斯琴高娃. 数据包络分析及其应用案例. 北京: 科学出版社, 2013: 1-7.
[
|
| [35] |
张鹏, 李林欣, 曾永泉. 基于DEA-Malmquist指数的粤港澳大湾区科技创新效率评价研究. 工业技术经济, 2021, 40(2):12-17.
[
|
| [36] |
王兆峰, 刘庆芳. 长江经济带旅游生态效率时空演变及其与旅游经济互动响应. 自然资源学报, 2019, 34(9):1945-1961.
[
|
| [37] |
杜琳琳, 时立文, 薛晓光. SPSS统计分析从入门到精通(第二版). 北京: 清华大学出版社, 2020:176.
[
|
| [38] |
曹芳冬, 黄震方, 吴江, 等. 城市旅游发展效率的时空格局演化特征及其驱动机制: 以泛长江三角洲地区为例. 地理研究, 2012, 31(8):1431-1444.
[
|
| [39] |
谢磊, 李景保, 袁华斌, 等. 长江中游经济区县域经济差异时空演变. 经济地理, 2014, 34(4):19-24, 39.
[
|
| [40] |
刘建国, 刘宇. 2006—2013年杭州城市旅游全要素生产率格局及影响因素. 经济地理, 2015, 35(7):190-197.
[
|
| [41] |
李磊, 陶卓民, 赖志城, 等. 长征国家文化公园红色旅游资源网络关注度及其旅游流网络结构分析. 自然资源学报, 2021, 36(7):1811-1824.
[
|
| [42] |
周骁, 李江风, 姚尧, 等. 贵州省旅游效率时空演变及影响因素分析. 地域研究与开发, 2020, 39(2):88-93.
[
|
| [43] |
唐鸿, 许春晓. 中国红色旅游经典景区网络关注度时空演变及影响因素. 自然资源学报, 2021, 36(7):1792-1810.
[
|
/
| 〈 |
|
〉 |