
JOURNAL OF NATURAL RESOURCES >
Spatio-temporal variation of water yield and its driving factors in Qinling Mountains barrier region
Received date: 2020-10-08
Request revised date: 2021-02-07
Online published: 2021-12-28
Copyright
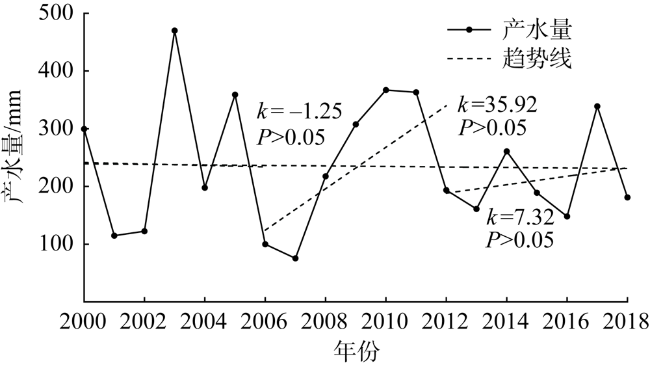
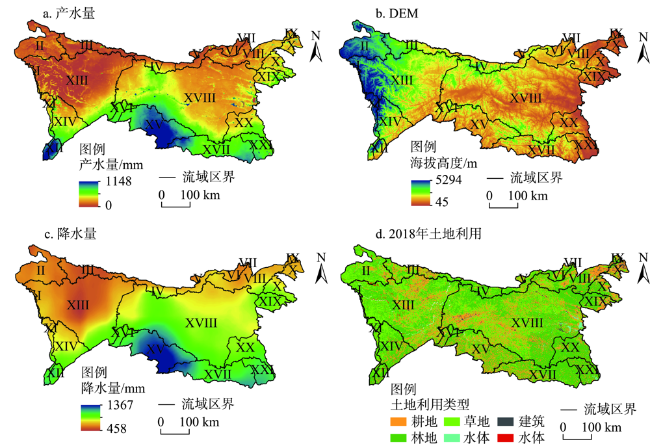
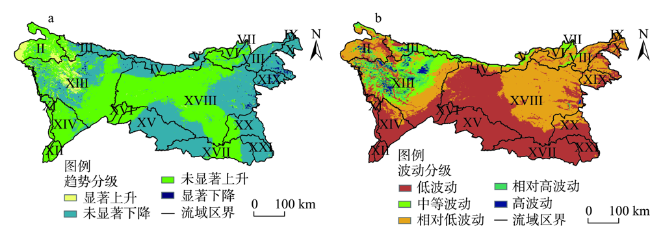
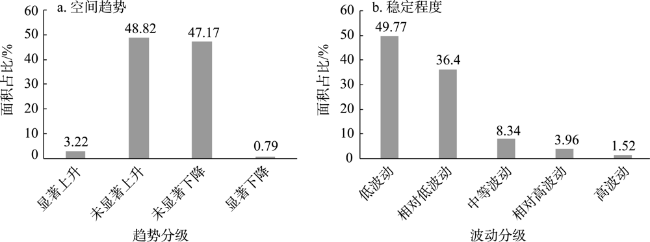
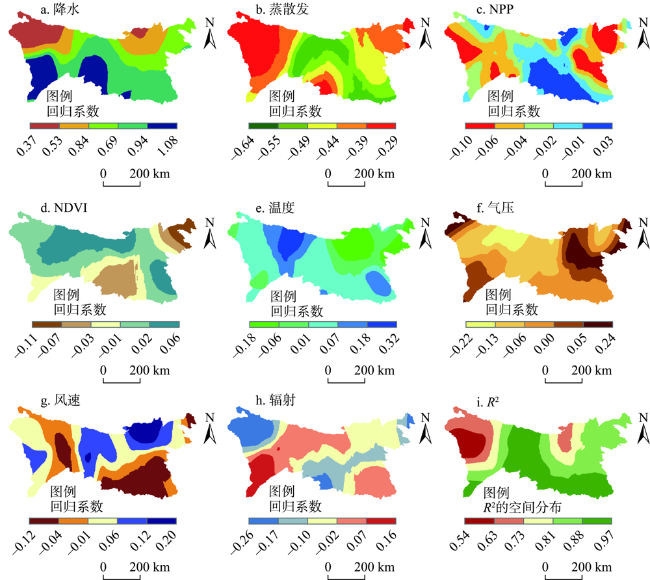
The Qinling Mountains region, an important water conservation region and ecological function support region, as well as a major ecological barrier in China, plays a critical role in conserving water resources. Based on the data of meteorology and land use, this paper estimates the water yield service in the Qinling region based on InVEST model, and uses spatio-temporal analysis method and geographically weighted regression (GWR) to discuss the variation characteristics and driving factors of water-producing services in the study region from 2000 to 2018. The results show that the average annual water yield in Qinling is 235.16 mm, showing a weak downward trend in 2019 with the highest value (470.17 mm) in 2003 and the lowest (75.57 mm) in 2007. The spatial distribution of water yield gradually decreased from the south to the north with obvious "stepped" distribution characteristics. The change trend of water yield has an insignificant increase and decrease (95.99%), and a small number of regions with a significant increase are formed at higher altitude in the Central and Western Qinling region. There are obvious spatial differences in the fluctuation of water yield in the region, which present a trend of "higher in the north than in the south, mainly with medium and low fluctuation and strong fluctuation in the northwest". The influence of various factors on water production services has obvious spatial heterogeneity. The study region is dominated by precipitation (33.18%), which is concentrated in the southern part of Qinling Mountains with more water production, followed by NPP (17.90%) and actual evapotranspiration (16.71%), which are the main influencing factors in the Central and Northern Qinling Mountains. The research results provide theoretical and technical support for the safety and sustainable utilization of water resources in the Qinling region.
WANG Xiao-feng , FU Xin-xin , CHU Bing-yang , LI Yue-hao , YAN Yu , FENG Xiao-ming . Spatio-temporal variation of water yield and its driving factors in Qinling Mountains barrier region[J]. JOURNAL OF NATURAL RESOURCES, 2021 , 36(10) : 2507 -2521 . DOI: 10.31497/zrzyxb.20211005
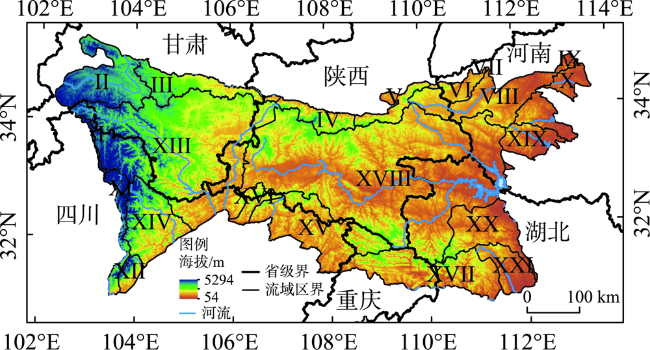
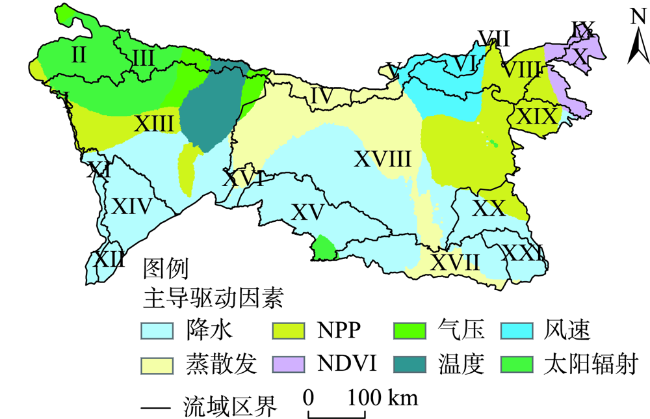
图1 研究区流域概况注:I—河源至玛曲,II—大夏河与洮河,III—渭河宝鸡峡以上,IV—渭河宝鸡峡至咸阳,V—渭河咸阳至潼关,VI—龙门至三门峡干流区间,VII—三门峡至小浪底区间,VIII—伊洛河,IX—小浪底至花园口干流区间,X—王蚌区间北岸,XI—青衣江和岷江干流,XII—沱江,XIII—广元昭化以上,XIV—涪江,XV—渠江,XVI—广元昭化以下干流,XVII—宜宾至宜昌干流,XVIII—丹江口以上,XIX—唐白河,XX—丹江口以下干流,XXI—宜昌至武汉左岸,下同。 Fig. 1 Location and basin of the study area |
表1 秦岭各流域平均海拔、降水、下垫面占比和产水量Table 1 Average elevation, precipitation, proportion of underlying surface and water yield of each basin in Qinling Mountains |
| 流域 | 平均海拔/m | 平均降水/mm | 耕/林/草地占比/% | 平均产水量/mm |
|---|---|---|---|---|
| 河源至玛曲 | 3742.05 | 687.28 | 0/6/90 | 141.15 |
| 大夏河与洮河 | 3153.08 | 613.09 | 11/35/51 | 77.65 |
| 渭河宝鸡峡以上 | 2084.54 | 564.90 | 31/24/42 | 57.06 |
| 渭河宝鸡峡至咸阳 | 1702.31 | 743.37 | 6/65/29 | 166.12 |
| 渭河咸阳至潼关 | 1371.40 | 699.94 | 18/41/39 | 85.87 |
| 龙门至三门峡干流区间 | 1083.33 | 653.91 | 20/49/31 | 95.23 |
| 三门峡至小浪底区间 | 878.91 | 596.95 | 23/36/40 | 59.14 |
| 伊洛河 | 882.27 | 718.47 | 32/45/19 | 149.02 |
| 小浪底至花园口干流区间 | 341.31 | 675.06 | 34/23/39 | 185.51 |
| 王蚌区间北岸 | 499.01 | 774.53 | 43/38/13 | 238.41 |
| 青衣江和岷江干流 | 3123.93 | 849.83 | 4/43/52 | 380.18 |
| 沱江 | 2061.77 | 1019.32 | 11/71/16 | 632.97 |
| 广元昭化以上 | 2032.98 | 653.49 | 20/36/42 | 93.18 |
| 涪江 | 2080.98 | 805.42 | 12/57/30 | 274.00 |
| 渠江 | 1134.33 | 1217.35 | 32/49/19 | 590.96 |
| 广元昭化以下干流 | 1322.71 | 983.36 | 23/56/20 | 401.45 |
| 宜宾至宜昌干流 | 1069.97 | 1069.20 | 21/68/10 | 459.57 |
| 丹江口以上 | 993.80 | 859.18 | 22/45/31 | 231.00 |
| 唐白河 | 536.05 | 892.00 | 29/59/8 | 288.21 |
| 丹江口以下干流 | 775.30 | 911.63 | 12/83/3 | 280.03 |
| 宜昌至武汉左岸 | 543.51 | 1057.67 | 14/80/3 | 438.51 |
表2 相关性分析结果Table 2 Results of correlation analysis |
| 驱动因子 | 温度 | 风速 | 辐射量 | 气压 | 降水 | 蒸散量 | NPP | NDVI |
|---|---|---|---|---|---|---|---|---|
| 相关系数 | -0.073** | 0.066** | -0.143* | 0.097** | 0.935** | -0.426** | 0.196** | 0.012** |
注:**表示相关性在0.01上显著;*表示相关性在0.05上显著。 |
表3 OLS与GWR模型结果对比Table 3 Comparison of the results of OLS and GWR models |
| 模型参数 | 赤池信息准则AICc | 残差估计平方差Sigma | R2 | 校正R2 |
|---|---|---|---|---|
| OLS模型 | 3197 | 0.3461 | 0.8784 | 0.8782 |
| GWR模型 | 1812 | 0.2952 | 0.9134 | 0.9117 |
表4 主导驱动因素面积占比Table 4 Area proportion statistics of driving factors |
| 主导因素 | 降水 | 蒸散量 | NDVI | NPP | 气压 | 辐射量 | 温度 | 风速 |
|---|---|---|---|---|---|---|---|---|
| 面积/km2 | 110345 | 48194 | 7307 | 52508 | 8046 | 31401 | 13111 | 15345 |
| 面积占比/% | 38.55 | 16.84 | 2.55 | 18.34 | 2.81 | 10.97 | 4.58 | 5.36 |
表5 秦岭各流域驱动因素面积占比Table 5 Area proportion of driving factors of each basin in Qinling Mountains (%) |
| 流域 | 降水 | 蒸散量 | NDVI | NPP | 气压 | 辐射量 | 温度 | 风速 |
|---|---|---|---|---|---|---|---|---|
| 河源至玛曲 | 2.75 | 0 | 0 | 79.16 | 0.00 | 18.09 | 0 | 0 |
| 大夏河与洮河 | 0 | 0 | 0 | 5.90 | 5.54 | 88.56 | 0 | 0 |
| 渭河宝鸡峡以上 | 0 | 0.22 | 0 | 0 | 23.61 | 61.81 | 14.36 | 0 |
| 渭河宝鸡峡至咸阳 | 0 | 99.56 | 0 | 0 | 0.44 | 0 | 0 | 0 |
| 渭河咸阳至潼关 | 0 | 62.16 | 0 | 0 | 0 | 0 | 0 | 37.84 |
| 龙门至三门峡干流区间 | 0 | 0 | 0 | 5.59 | 0 | 0 | 0 | 94.41 |
| 三门峡至小浪底区间 | 0 | 0 | 0 | 100.00 | 0 | 0 | 0 | 0 |
| 伊洛河 | 0 | 0 | 10.28 | 53.03 | 0 | 0 | 0 | 36.69 |
| 小浪底至花园口干流区间 | 0 | 0 | 100.00 | 0 | 0 | 0 | 0 | 0 |
| 王蚌区间北岸 | 0 | 0 | 69.68 | 30.18 | 0 | 0.14 | 0 | 0 |
| 青衣江和岷江干流 | 97.23 | 0 | 0 | 2.77 | 0 | 0. | 0 | 0 |
| 沱江 | 100.00 | 0 | 0 | 0 | 0 | 0 | 0 | 0 |
| 广元昭化以上 | 29.08 | 0.79 | 0 | 20.86 | 8.33 | 20.79 | 20.16 | 0 |
| 涪江 | 100.00 | 0 | 0 | 0 | 0 | 0 | 0 | 0 |
| 渠江 | 92.09 | 0 | 0 | 0 | 0 | 7.91 | 0 | 0 |
| 广元昭化以下干流 | 53.83 | 46.17 | 0 | 0 | 0 | 0 | 0 | 0 |
| 宜宾至宜昌干流 | 65.90 | 33.59 | 0 | 0 | 0 | 0.51 | 0 | 0 |
| 丹江口以上 | 33.63 | 36.76 | 0 | 22.50 | 0.42 | 0.10 | 0.05 | 6.53 |
| 唐白河 | 8.44 | 0 | 2.93 | 88.63 | 0 | 0 | 0 | 0 |
| 丹江口以下干流 | 70.31 | 0 | 0 | 29.69 | 0 | 0 | 0 | 0 |
| 宜昌至武汉左岸 | 98.37 | 1.63 | 0 | 0 | 0 | 0 | 0 | 0 |
| [1] |
|
| [2] |
Millennium Ecosystem Assessment. Ecosystems and Human Well-Being. Washington D.C.: Island Press, 2005.
|
| [3] |
傅伯杰, 刘世梁, 马克明. 生态系统综合评价的内容与方法. 生态学报, 2001, 21(11):1885-1892.
[
|
| [4] |
戴尔阜, 王亚慧. 横断山区产水服务空间异质性及归因分析. 地理学报, 2020, 75(3):607-619.
[
|
| [5] |
|
| [6] |
|
| [7] |
吕一河, 胡健, 孙飞翔, 等. 水源涵养与水文调节: 和而不同的陆地生态系统水文服务. 生态学报, 2015, 35(15):5191-5196.
[
|
| [8] |
|
| [9] |
|
| [10] |
吴健, 李英花, 黄利亚, 等. 东北地区产水量时空分布格局及其驱动因素. 生态学杂志, 2017, 36(11):3216-3223.
[
|
| [11] |
孙小银, 郭洪伟, 廉丽姝, 等. 南四湖流域产水量空间格局与驱动因素分析. 自然资源学报, 2017, 32(4):669-679.
[
|
| [12] |
包玉斌, 李婷, 柳辉, 等. 基于InVEST模型的陕北黄土高原水源涵养功能时空变化. 地理研究, 2016, 35(4):664-676.
[
|
| [13] |
宁亚洲, 张福平, 冯起, 等. 秦岭水源涵养功能时空变化及其影响因素. 生态学杂志, 2020, 39(9):3080-3091.
[
|
| [14] |
|
| [15] |
|
| [16] |
侯文娟, 高江波, 戴尔阜, 等. 基于SWAT模型模拟乌江三岔河生态系统产流服务及其空间变异. 地理学报, 2018, 73(7):1268-1282.
[
|
| [17] |
耿甜伟, 陈海, 张行, 等. 基于GWR的陕西省生态系统服务价值时空演变特征及影响因素分析. 自然资源学报, 2020, 35(7):1714-1727.
[
|
| [18] |
|
| [19] |
|
| [20] |
|
| [21] |
|
| [22] |
|
| [23] |
|
| [24] |
邓兴耀, 姚俊强, 刘志辉. 基于GIMMS NDVI的中亚干旱区植被覆盖时空变化. 干旱区研究, 2017, 34(1):10-19.
[
|
| [25] |
马勇, 黄智洵. 长江中游城市群绿色发展指数测度及时空演变探析: 基于GWR模型. 生态环境学报, 2017, 26(5):794-807.
[
|
| [26] |
|
| [27] |
曹晴, 郝振纯, 傅晓洁, 等. 1960—2017年中国极端气候要素时空变化分析. 人民黄河, 2020, 42(2):11-17.
[
|
| [28] |
谢余初, 巩杰, 齐姗姗, 等. 基于InVEST模型的白龙江流域水源供给服务时空分异. 自然资源学报, 2017, 32(8):1337-1347.
[
|
| [29] |
杨洁, 谢保鹏, 张德罡. 基于InVEST模型的黄河流域产水量时空变化及其对降水和土地利用变化的响应. 应用生态学报, 2020, 31(8):2731-2739.
[
|
| [30] |
李怡颖, 范继辉, 廖莹. 基于InVEST模型的张家口市水源涵养功能时空差异分析. 草业科学, 2020, 37(7):1313-1324.
[
|
| [31] |
柳冬青, 曹二佳, 张金茜, 等. 甘肃白龙江流域水源涵养服务时空格局及其影响因素. 自然资源学报, 2020, 35(7):1728-1743.
[
|
| [32] |
|
| [33] |
尹礼唱, 王晓峰, 张琨, 等. 国家屏障区生态系统服务权衡与协同. 地理研究, 2019, 38(9):2162-2172.
[
|
| [34] |
陈心盟, 王晓峰, 冯晓明, 等. 青藏高原生态系统服务权衡与协同关系. 地理研究, 2021, 40(1):18-34.
[
|
| [35] |
黄木易, 岳文泽, 方斌, 等. 1970—2015年大别山区生态服务价值尺度响应特征及地理探测机制. 地理学报, 2019, 74(9):1904-1920.
[
|
/
| 〈 |
|
〉 |