
JOURNAL OF NATURAL RESOURCES >
Spatial allocation efficiency and control strategy of county land resources based on main functional areas of territorial space: A case study of Ganyu, Jiangsu province
Received date: 2020-07-17
Request revised date: 2020-11-18
Online published: 2021-11-28
Copyright
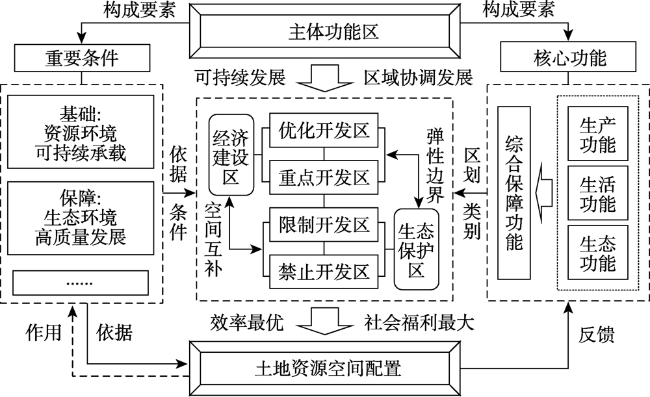
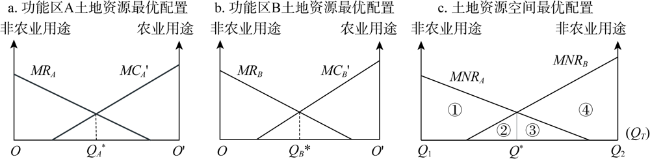
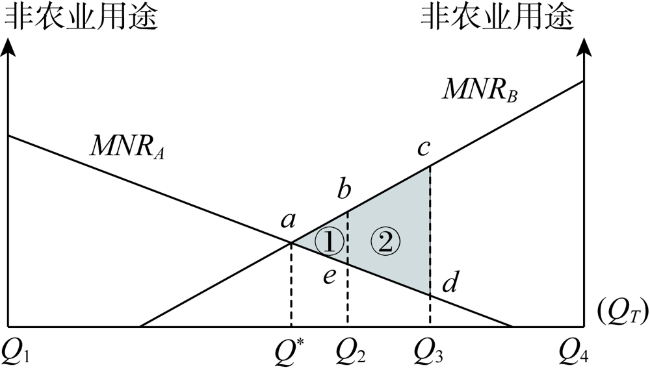
In terms of the county area, widening the concept application of main functional areas and exploring the spatial allocation efficiency of land resources and its control strategies are of great significance to deepening China's territorial space governance system. This paper combs the theoretical relationship between main functional areas and land resources spatial allocation, the spatial allocation efficiency of land resources in main functional areas of Ganyu district, a typical county-level unit in Jiangsu province, was investigated with the C-D production function, and the differentiated control strategy was put forward. The result shows that the essence of main functional areas construction is "based on land", and land resources spatial allocation should follow the transformation degree of equal marginal net income based on the concept of functional zoning, which makes it possible to improve land efficiency and reduce the efficiency loss of spontaneous competitive advantage. A study of Ganyu district found that the excessive allocation of agricultural land to development land in different main functional areas has the pareto improvement space, which is rooted in the inelastic mechanism of the current land planning management to regulate the spatial land use index, resulting in the spatial mismatch in the actual landing. Therefore, the effective allocation of land resources in Ganyu should be based on the overall planning of main functions and the coordination of land space development pattern, including: optimizing development areas should renovate the spatial structure of land and transform the mode of economic and industrial development; key development areas will contribute to the industrialization of cities and towns and ensure the efficiency of land resources use in the region; restricted development areas focus on the safety of grain and economic products and innovate the management mode of agricultural production land; prohibited development areas draw the red line of ecological space in development zones and explore the layout and structure of agricultural and tourism ecological land.
JIANG Hai , CHEN Lei . Spatial allocation efficiency and control strategy of county land resources based on main functional areas of territorial space: A case study of Ganyu, Jiangsu province[J]. JOURNAL OF NATURAL RESOURCES, 2021 , 36(9) : 2424 -2436 . DOI: 10.31497/zrzyxb.20210918
表1 基于农业—非农业用途空间配置均衡的效率测算变量选取Table 1 Variables selection of efficiency measurement based on the spatial balance between agricultural and non-agricultural uses |
| 准则层 | 子准则层 | 指标层 | |
|---|---|---|---|
| 产出 | 总收益 (Y) | 农用地YAL | 第一产业生产总值 |
| 非农建设用地YDL | 二三产业生产总值 | ||
| 投入 | 资本投入 (K) | 农用地KAL | 农村固定资产投资 |
| 非农建设用地KDL | 城镇固定资产投资 | ||
| 劳动力投入 (L) | 农用地LAL | 第一产业从业人员 | |
| 非农建设用地LDL | 二三产业从业人员 | ||
| 土地资源投入 (Land) | 农用地LandAL | 农用地面积 | |
| 非农建设用地LandDL | 建设用地面积 | ||
表2 土地资源边际收益函数估计结果Table 2 Evaluation results of land resources marginal revenue function |
| 方程 | 变量 | 系数 | R2 | F-statistic | D-W | |
|---|---|---|---|---|---|---|
| 式(1) | A | A | 1.443676 | 0.934440 | 72.94258*** | 1.201989 |
| K | a | 0.412086*** | ||||
| L | b | 0.201121** | ||||
| LandAL | c | 0.608623*** | ||||
| 式(2) | B | B | 2.081039* | 0.975187 | 201.1283*** | 1.374717 |
| K | d | 0.615686*** | ||||
| L | e | 0.630872*** | ||||
| LandDL | f | 0.306314** | ||||
注:由Eviews 9.0软件输出结果整理;*、**、***分别表示在10%、5%、1%水平上显著,下同。 |
表3 赣榆区主体功能区农业用途土地资源边际收益Table 3 The marginal revenue of agricultural land resources in main functional areas of Ganyu district (元/年/hm2) |
| 主体功能区 | 2011年 | 2012年 | 2013年 | 2014年 | 2015年 | 2016年 | 2017年 | 平均数 |
|---|---|---|---|---|---|---|---|---|
| 转型发展区 | 835.43 | 790.58 | 976.90 | 1012.53 | 1177.77 | 1287.90 | 1452.40 | 1076.22 |
| 提质发展区 | 767.15 | 769.70 | 825.77 | 811.22 | 861.35 | 1016.24 | 1166.50 | 888.28 |
| 重点建设区 | 901.85 | 999.34 | 1003.84 | 1024.42 | 1085.35 | 1193.55 | 1304.53 | 1073.27 |
| 重点培育区 | 470.93 | 431.40 | 469.11 | 491.68 | 564.87 | 609.71 | 657.35 | 527.86 |
| 一般农业生产区 | 533.93 | 525.94 | 588.37 | 515.61 | 571.39 | 619.33 | 665.85 | 574.35 |
| 果林产业园建设区 | 396.61 | 401.15 | 402.84 | 403.19 | 476.53 | 473.85 | 570.38 | 446.36 |
表4 赣榆区主体功能区非农业用途土地资源边际收益Table 4 The marginal revenue of non-agricultural land resources in main functional areas of Ganyu district (元/年/hm2) |
| 主体功能区 | 2011年 | 2012年 | 2013年 | 2014年 | 2015年 | 2016年 | 2017年 | 平均数 |
|---|---|---|---|---|---|---|---|---|
| 转型发展区 | 325056.10 | 319180.20 | 416598.18 | 437727.61 | 562907.95 | 738764.66 | 889885.14 | 527159.98 |
| 提质发展区 | 369284.09 | 417963.04 | 463244.68 | 451394.03 | 465758.95 | 634480.68 | 765912.42 | 509719.70 |
| 重点建设区 | 695800.18 | 755606.58 | 795700.40 | 820531.36 | 875093.61 | 1100002.99 | 1426657.83 | 924198.99 |
| 重点培育区 | 458483.41 | 408128.37 | 475391.23 | 508719.17 | 607312.79 | 673655.11 | 760844.66 | 556076.39 |
| 一般农业生产区 | 491149.11 | 422501.95 | 526369.22 | 433843.58 | 523408.77 | 569713.03 | 698181.62 | 523595.33 |
| 果林产业园建设区 | 280279.18 | 267848.86 | 295022.79 | 295908.73 | 383300.78 | 381453.67 | 509905.01 | 344817.00 |
表5 赣榆区主体功能区农用地资源生态效益估算结果Table 5 Evaluation results of agricultural land ecological revenue in main functional areas of Ganyu district (元/年/hm2) |
| 主体功能区 | 2011 | 2012 | 2013 | 2014 | 2015 | 2016 | 2017 |
|---|---|---|---|---|---|---|---|
| 转型发展区 | 38204.50 | 38625.15 | 38345.42 | 38659.90 | 38832.10 | 38121.05 | 39018.47 |
| 提质发展区 | 37105.27 | 37769.95 | 37527.24 | 37740.78 | 37821.69 | 37075.26 | 37948.07 |
| 重点建设区 | 26912.01 | 27735.33 | 27747.36 | 27681.57 | 27894.31 | 27675.20 | 28326.71 |
| 重点培育区 | 14781.75 | 14775.90 | 14820.72 | 14801.91 | 14882.46 | 14698.49 | 15044.52 |
| 一般农业生产区 | 32802.87 | 33629.53 | 33374.65 | 32787.10 | 32605.75 | 31580.59 | 32324.04 |
| 果林产业园建设区 | 25226.39 | 25934.95 | 25959.01 | 26025.75 | 26131.89 | 25984.16 | 26595.86 |
表6 赣榆区主体功能区农业用途向非农业用途转化的边际净收益Table 6 Marginal net revenue of the transformation from agricultural use to non-agricultural use of main functional areas in Ganyu district (元/年/hm2) |
| 主体功能区 | 2011年 | 2012年 | 2013年 | 2014年 | 2015年 | 2016年 | 2017年 |
|---|---|---|---|---|---|---|---|
| 转型发展区 | 286016.17 | 279764.48 | 377275.86 | 398055.18 | 522898.07 | 699355.70 | 849414.26 |
| 提质发展区 | 331411.67 | 379423.39 | 424891.67 | 412842.03 | 427075.91 | 596389.17 | 726797.85 |
| 重点建设区 | 667986.32 | 726871.91 | 766949.21 | 791825.37 | 846113.94 | 1071134.25 | 1397026.59 |
| 重点培育区 | 443230.73 | 392921.07 | 460101.41 | 493425.58 | 591865.45 | 658346.91 | 745142.80 |
| 一般农业生产区 | 457812.31 | 388346.48 | 492406.19 | 400540.87 | 490231.63 | 537513.11 | 665191.73 |
| 果林产业园建设区 | 254656.18 | 241512.76 | 268660.94 | 269479.79 | 356692.37 | 354995.67 | 482738.76 |
表7 边际收益曲线和边际成本曲线估计结果Table 7 Evaluation results of marginal revenue curve and marginal cost curve |
| 区域 | 方程 | 系数 | R2 | F-statistic | D-W | |
|---|---|---|---|---|---|---|
| 经济建设区 | 式(5) | C1 | -12.59829* | 0.482632 | 5.441676*** | 2.178506 |
| C2 | 1.196924** | |||||
| 式(6) | C3 | -26.02077* | 0.465838 | 5.087202*** | 2.168751 | |
| C4 | 1.735522** | |||||
| 生态保护区 | 式(5) | C1 | -16.95226*** | 0.652510 | 11.14148*** | 2.087990 |
| C2 | 1.498843*** | |||||
| 式(6) | C3 | -33.77918*** | 0.662307 | 11.63688*** | 2.067969 | |
| C4 | 2.183116*** | |||||
表8 赣榆区主体功能区土地资源空间配置效率状况Table 8 The spatial allocation efficiency of land resources in main functional area of Ganyu district |
| 主体功能区 | 实际配置 数量/hm2 1 | 符合空间配置效率(最优)数量/hm2 2 | 空间配置损失偏差/hm2 1-2 | 空间配置效率指数 1/2 | 与实际相比的幅度/% (2-1)/2 | |
|---|---|---|---|---|---|---|
| 经济 建设区 | 转型发展区 | 251.1750 | 154.9831 | 96.1919 | 1.6207 | -62.0661 |
| 提质发展区 | 372.8487 | 238.0065 | 134.8422 | 1.5665 | -56.6548 | |
| 重点建设区 | 1352.8394 | 951.3850 | 401.4544 | 0.9961 | 0.3909 | |
| 重点培育区 | 107.8315 | 91.5353 | 16.2962 | 1.2530 | -25.3011 | |
| 生态 保护区 | 一般农业生产区 | 290.4275 | 812.6026 | -522.1751 | 0.5930 | 40.6991 |
| 果林产业园建设区 | 119.4389 | 246.0474 | -126.6085 | 0.8054 | 19.4558 | |
| [1] |
谭荣, 曲福田. 农地非农化的空间配置效率与农地损失. 中国软科学, 2006, (5):49-57.
[
|
| [2] |
姜开宏, 陈江龙, 陈雯. 比较优势理论与区域土地资源配置: 以江苏省为例. 中国农村经济, 2004, (12):16-21.
[
|
| [3] |
陈江龙, 曲福田, 陈雯. 农地非农化效率的空间差异及其对土地利用政策调整的启示. 管理世界, 2004, (8):37-42.
[
|
| [4] |
王博, 陈笑筑, 何晓波. 省级以下建设用地空间配置效率测度及优化探讨. 中国人口·资源与环境, 2016, 26(1):89-96.
[
|
| [5] |
张英浩, 陈江龙, 高金龙, 等. 经济转型视角下长三角城市土地利用效率影响机制. 自然资源学报, 2019, 34(6):1157-1170.
[
|
| [6] |
杨怀宇, 杨正勇. 基于投资组合模型的海岸带土地利用效率研究: 以上海临港新城围垦区为例. 自然资源学报, 2015, 30(2):208-217.
[
|
| [7] |
陈磊, 姜海. 从土地资源优势区配置到主体功能区管理: 一个国土空间治理的逻辑框架. 中国土地科学, 2019, 33(6):10-17.
[
|
| [8] |
陈磊, 姜海. 主体功能区导向下的土地资源空间配置: 对土地生长空间演进规律的理性思考. 中国土地科学, 2019, 33(10):22-30.
[
|
| [9] |
陈磊, 姜海. 县域主体功能区治理方案设计与监管体系. 自然资源学报, 2021, 36(8):1988-2005.
[
|
| [10] |
|
| [11] |
才国伟, 舒元. 我国资本的配置效率: 一种新的测算方法. 经济科学, 2009, (4):43-52.
[
|
| [12] |
张恒义. 中国省际建设用地空间配置效率研究. 杭州: 浙江大学, 2011: 109-134.
[
|
| [13] |
李辉, 王良健. 土地资源配置的效率损失与优化途径. 中国土地科学, 2015, 29(7):63-72.
[
|
| [14] |
王荧. 我国农地非农化配置效率. 福建: 福建师范大学, 2011: 138-152.
[
|
| [15] |
张宏斌, 贾生华. 土地非农化调控机制分析. 经济研究, 2001, (12):50-54.
[
|
| [16] |
钱忠好. 中国农地保护: 理论与政策分析. 管理世界, 2003, (10):60-70.
[
|
| [17] |
姚冠荣, 谢花林. 区域土地利用生态管控基本原理初探. 见: 2015年全国土地资源开发整治与新型城镇化建设学术研讨会, 2015: 615-623.
[
|
| [18] |
陈磊, 姜海, 陈文宽, 等. 生态约束下的湖滨土地利用研究: 以四川省仁寿县黑龙滩镇为例. 长江流域资源与环境, 2019, 28(1):231-240.
[
|
/
| 〈 |
|
〉 |