
JOURNAL OF NATURAL RESOURCES >
Research on global grain trade network pattern and its influencing factors
Received date: 2020-09-04
Request revised date: 2021-03-25
Online published: 2021-08-28
Copyright
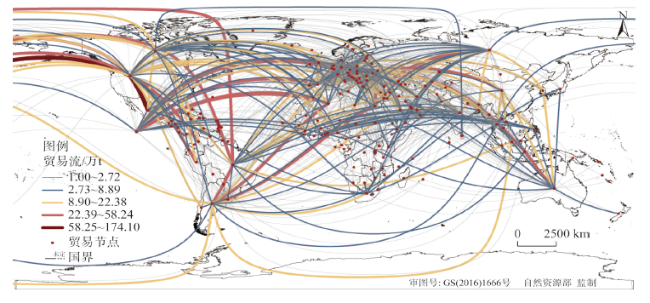
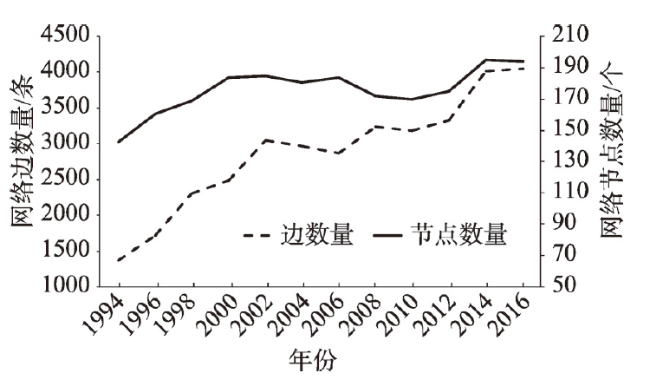
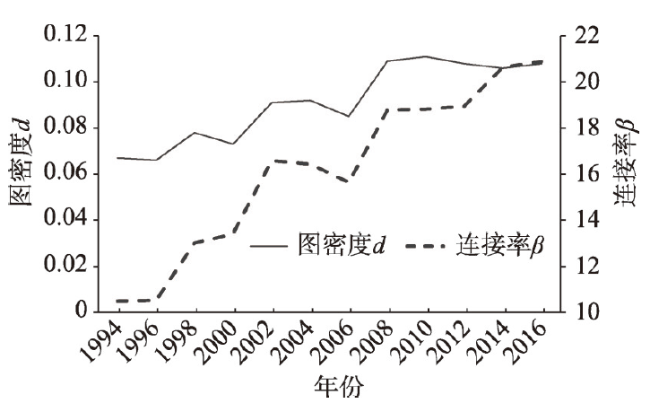
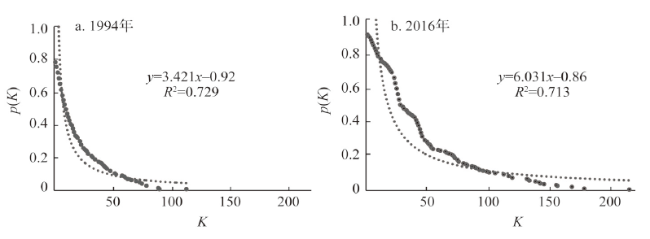
Based on the complex network analysis, this paper constructs the global grain trade network of wheat, rice and corn. The study analyzes the overall characteristics and changing trends of the network pattern, and quantitatively evaluates the influencing factors of the network pattern of global grain trade. The result shows that: Firstly, the global food trade network has become a complex, orderly and interdependent network system. The network scale is increasing, and the degree of connectivity and tightness are strengthening continuously. Secondly, the nodes of the global food trade network show the characteristics of disequilibrium structure. And countries with high strength and high node degree play a leading role in the network, showing the characteristics of network structure dominated by exporting countries. Thirdly, economic and social differences, consistency of trade policies, linguistic and cultural proximity have significant effects on food trade networks. Economic and social differences have driven trade networks to become more interconnected and diversified. Consistency in trade policy contributes to a more sustainable and robust trade network. Therefore, it is suggested that China implement a more diversified and multilateralized grain trade policy. China should strengthen and enhance its centrality among nodes of the global food network, fully integrate into the global food trade network, and promote the building of a global community of shared future for food security.
WANG Jie-yong , DAI Chun , ZHOU Mo-zhu , LIU Zheng-jia . Research on global grain trade network pattern and its influencing factors[J]. JOURNAL OF NATURAL RESOURCES, 2021 , 36(6) : 1545 -1556 . DOI: 10.31497/zrzyxb.20210615
表1 1994年、2016年入强度、出强度排名前10节点Table 1 The top-10 of out-W and in-W values in 1994 and 2016 |
| 排名 | 入强度 | 出强度 | |||||||
|---|---|---|---|---|---|---|---|---|---|
| 1994年 | 2016年 | 1994年 | 2016年 | ||||||
| 1 | 日本 | 0.22 | 日本 | 0.21 | 美国 | 0.57 | 美国 | 0.78 | |
| 2 | 中国 | 0.11 | 埃及 | 0.20 | 法国 | 0.19 | 乌克兰 | 0.32 | |
| 3 | 韩国 | 0.10 | 墨西哥 | 0.20 | 加拿大 | 0.17 | 阿根廷 | 0.28 | |
| 4 | 意大利 | 0.07 | 韩国 | 0.15 | 阿根廷 | 0.09 | 俄罗斯 | 0.26 | |
| 5 | 埃及 | 0.06 | 西班牙 | 0.13 | 中国 | 0.09 | 法国 | 0.25 | |
| 6 | 中国台湾 | 0.06 | 印度尼西亚 | 0.13 | 澳大利亚 | 0.06 | 加拿大 | 0.21 | |
| 7 | 巴西 | 0.06 | 阿尔及利亚 | 0.12 | 英国 | 0.03 | 巴西 | 0.19 | |
| 8 | 南非 | 0.04 | 意大利 | 0.12 | 德国 | 0.03 | 澳大利亚 | 0.14 | |
| 9 | 荷兰 | 0.04 | 巴西 | 0.11 | 泰国 | 0.03 | 德国 | 0.10 | |
| 10 | 阿尔及利亚 | 0.03 | 中国 | 0.10 | 沙特阿拉伯 | 0.01 | 印度 | 0.09 | |
表2 解释变量及说明Table 2 The influencing factors and their explanations |
| 变量名称 | 变量含义 | 计算方法及说明 | 数据来源 |
|---|---|---|---|
| GDP | 国民生产总值 | i和j国家间经济发展水平差值网络/美元 | 世界银行数据库(WDI) |
| EMP | 农业就业人口比例 | i和j国家间农业就业人口百分比差值网络 | 世界银行数据库(WDI) |
| CPI | 消费者价格指数 | i和j国家间消费者价格指数差值网络 | 世界银行数据库(WDI) |
| URBAN | 城镇化率 | i和j国家间城镇化率差值网络 | 世界银行数据库(WDI) |
| WATER | 人均淡水资源 | i和j国家间人均淡水资源差值网络/m3 | 世界银行数据库(WDI) |
| LAND | 人均耕地面积 | i和j国家间人均耕地面积差值网络/hm2 | 世界银行数据库(WDI) |
| TARIFF | 关税税率 | i和j国家间关税税率差值网络 | 世界银行数据库(WDI) |
| DISTCAP | 国家间地理距离 | i和j国家首都间地理距离网络/km | 法国CEPII-Geography |
| TRANS | 班轮运输指数 | i和j国家间班轮运输指数差值网络 | 世界银行数据库(WDI) |
| LANG | 语言临近性 | i和j国家使用共同官方语言计为1,否则为0 | 法国CEPII-Geography |
| GEI | 政治稳定性指数 | i和j国家间政治稳定性指数差值网络 | 世界政治治理指标(WGI)数据库 |
| GSI | 政府效能指数 | i和j国家间政府效能指数差值网络 | 世界政治治理指标(WGI)数据库 |
表3 1994年、2006年、2016年粮食贸易网络QAP多元回归结果Table 3 Multiple QAP regression results of grain trade network in 1994, 2006 and 2016 |
| 变量 | 标准化回归系数 | ||
|---|---|---|---|
| 1994年 | 2006年 | 2016年 | |
| GDP | 0.1108** | 0.0855* | 0.1231** |
| EMP | -0.1257* | 0.0185 | -0.1166* |
| CPI | -0.0262 | -0.0346 | 0.1084* |
| URBAN | 0.1236* | 0.0318 | 0.0688 |
| WATER | 0.0665 | 0.061 | 0.039 |
| LAND | 0.0307 | -0.0243 | 0.0018 |
| TARIFF | — | — | -0.1732*** |
| DISTCAP | 0.054 | 0.0772* | 0.0852* |
| TRANS | — | 0.1002* | -0.0116 |
| LANG | 0.035 | 0.0363 | 0.1074** |
| GEI | 0.0987* | 0.0379 | -0.0879 |
| GSI | -0.097 | -0.1291* | 0.0085 |
| R² | 0.252 | 0.237 | 0.387 |
注:***、**、*分别表示在1%、5%、10%的统计水平上显著;“—”因缺少统计数据未做分析。 |
| [1] |
|
| [2] |
|
| [3] |
刘彦随, 吴传钧. 中国水土资源态势与可持续食物安全. 自然资源学报, 2002,17(3):270-275.
[
|
| [4] |
|
| [5] |
|
| [6] |
|
| [7] |
封志明, 赵霞, 杨艳昭. 近50年全球粮食贸易的时空格局与地域差异. 资源科学, 2010,32(1):2-10.
[
|
| [8] |
|
| [9] |
|
| [10] |
|
| [11] |
|
| [12] |
周墨竹, 王介勇. 基于复杂网络的全球稻米贸易格局演化及其启示. 自然资源学报, 2020,35(5):1055-1067.
[
|
| [13] |
|
| [14] |
|
| [15] |
|
| [16] |
|
| [17] |
刘军. QAP: 测量“关系”之间关系的一种方法. 社会, 2007, (4):164-174.
[
|
| [18] |
袁红林, 辛娜. 中国高端制造业的全球贸易网络格局及其影响因素分析. 经济地理, 2019,39(6):108-117.
[
|
| [19] |
杨文龙, 杜德斌, 马亚华, 等. “一带一路”沿线国家贸易网络空间结构与邻近性. 地理研究, 2018,37(11):2218-2235.
[
|
| [20] |
王俊, 夏杰长. 中国省域旅游经济空间网络结构及其影响因素研究: 基于QAP方法的考察. 旅游学刊, 2018,33(9):13-25.
[
|
| [21] |
汪小帆, 李翔, 陈关荣. 复杂网络理论及其应用. 北京: 清华大学出版社, 2006.
[
|
/
| 〈 |
|
〉 |