
JOURNAL OF NATURAL RESOURCES >
Market integration and virtual flow of resources under the background of international food trade: Evidence from China-Pakistan rice market
Received date: 2020-07-17
Request revised date: 2021-01-25
Online published: 2021-08-28
Copyright
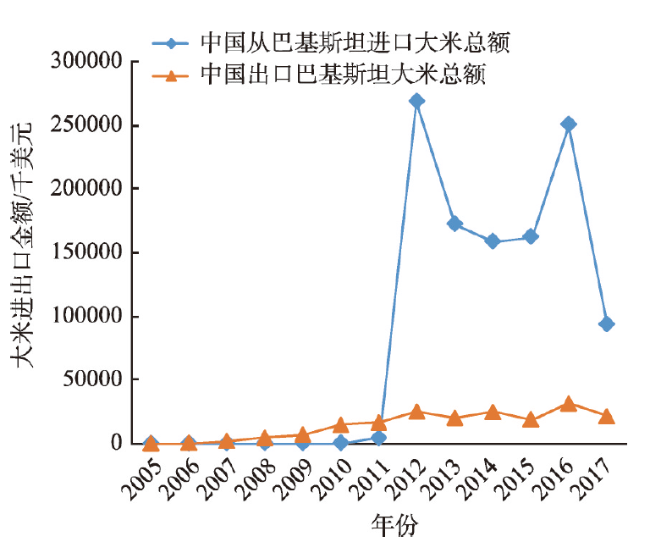
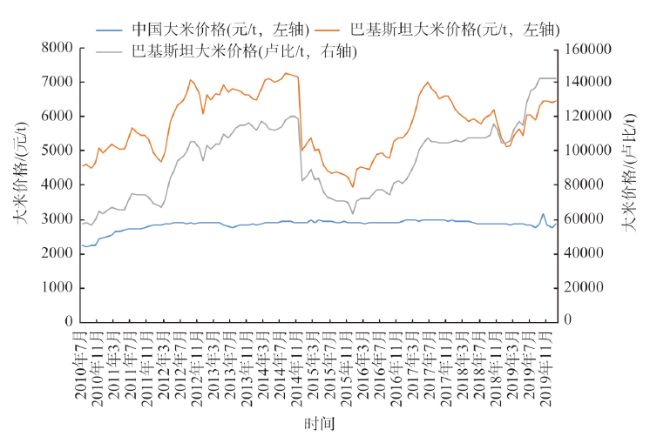
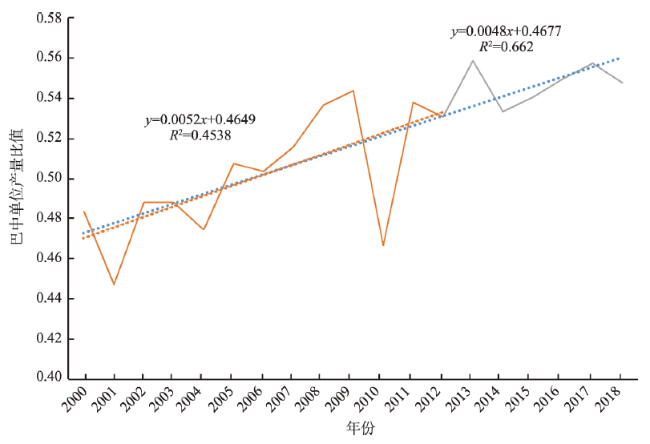
Trade liberalization and regional economic integration will not only lead to market integration and efficiency improvement through comparative advantages, but also produce transaction of "virtual resources", such as "virtual water" and "virtual land". Based on the time series model, and the food trade and prices data covering China and Pakistan, this paper first examines the degree of food market integration of the two countries. Secondly, we calculate the net flow of virtual water and virtual land resources accompanied by the rice trade, and analyze changes in resource efficiency. The results showed that: (1) The rice market between China and Pakistan has been highly integrated, but the price of rice in Pakistan is more fluctuant than that in China, and the price elasticity of rice in Pakistan is 1.097 with respect to that of China. This means that if rice price in China increases by 10%, the one in Pakistan will increase by 10.97%. Since the launch of the Belt and Road Initiative, rice price in Pakistan has fallen by 7.8%, which increases the welfare of the poor. (2) After 1988, China had net imports of 3.54 million tons of rice from Pakistan in total, equivalent to 520000 hectares of domestic cultivated land, or 964000 hectares of agricultural land in Pakistan, 3.44 billion tons of domestic water or 10.17 billion tons of water in Pakistan. The empirical results indicate a great difference in the utilization efficiency of land and water resources between China and Pakistan. Although the utilization efficiency of nature resources has been converging after the implementation of the B&R Initiative and the China-Pakistan Economic Corridor Project, the converging speed is not high enough. China should continue to promote the technology spillover to Pakistan and other B&R Initiative countries, help them overcome difficulties in raising low resources utilization efficiency, and increase the yield of rice to finally achieve the convergence of resource utilization efficiency. In global viewpoint, this not only ensures food security, but also saves natural resources, which is in line with the core goal of B&R Initiative: to make full use of comparative advantages in cooperating countries, to achieve free flow of factors and win-win cooperation, and finally build a community with a shared future, interests and responsibilities for mankind.
YU Xiao-hua , LIU Chang , ZHANG Guo-zheng . Market integration and virtual flow of resources under the background of international food trade: Evidence from China-Pakistan rice market[J]. JOURNAL OF NATURAL RESOURCES, 2021 , 36(6) : 1505 -1520 . DOI: 10.31497/zrzyxb.20210612
表1 2017年中国同巴基斯坦进出口农产品对比Table 1 Comparison of imports and exports between China and Pakistan in 2017 |
| 中国从巴基斯坦进口的主要产品 | 中国向巴基斯坦出口的主要产品 | |||
|---|---|---|---|---|
| 项目 | 价值/千美元 | 项目 | 价值/千美元 | |
| 大米—总量(精米当量) | 93642 | 大蒜 | 52520 | |
| 坚果 | 38722 | 姜 | 37707 | |
| 原材料 | 10391 | 速食品 | 31070 | |
| 精制糖 | 3760 | 原材料 | 28620 | |
| 芝麻 | 3687 | 苹果 | 23834 | |
| 废棉 | 2940 | 带壳核桃 | 22059 | |
| 大米—总量(精米当量) | 21845 | |||
| 油 | 1003 | |||
| 总计 | 153142 | 总计 | 323129 | |
注:根据FAOSTAT中巴贸易数据整理。 |
表2 中巴两国每吨稻米的虚拟水Table 2 Virtual water per ton of rice in China and Pakistan (m³/t) |
| 国家 | 绿水 | 蓝水 | 灰水 | 合计 |
|---|---|---|---|---|
| 中国 | 367 | 487 | 117 | 971 |
| 巴基斯坦 | 421 | 2364 | 88 | 2873 |
表3 中巴大米价格的单位根检验Table 3 Unit root test of rice prices in China and Pakistan |
| 检验方式 | ADF检验值 |
|---|---|
| Log(中国大米价格) | 1.39 |
| Log(巴基斯坦大米价格) | 0.50 |
| Log(中国大米价格) 的一阶差分 | -9.52*** |
| Log(巴基斯坦大米价格) 的一阶差分 | -7.23*** |
注:(1)用软件R计算的结果;(2)假设ADF检验不存在截距项,且滞后项的长短用BIC来选择;(3)***代表1%统计显著性。 |
表4 中巴大米市场的整合回归结果Table 4 Estimation of the rice market integration between China and Pakistan |
| 检验方式 | Log(巴基斯坦大米价格) | |||
|---|---|---|---|---|
| 模型1 | 模型2 | |||
| 系数 | t值 | 系数 | t值 | |
| Log(中国大米价格) | 1.097 | 392.292*** | 1.088 | 615.600*** |
| “一带一路”虚拟变量 | -0.078 | -2.811*** | ||
| 回归残差的ADF检验 | -2.060*** | -2.045** | ||
注:(1)用软件R计算的结果;(2)ADF检验假设不存在截距项,且滞后项的长短用BIC来选择;(3)***、**分别代表1%、5%统计显著性。 |
表5 中巴大米进出口及引致虚拟土地数量Table 5 Rice import and export between China and Pakistan and related virtual land |
| 年份 | 进口大米/t | 出口大米/t | 净进口/t | 净进口虚拟土地/hm2 | ||
|---|---|---|---|---|---|---|
| 中方土地 | 巴方土地 | |||||
| 中与巴各年进出口情况 | 1988 | 0 | 750.00 | -750.00 | -141.86 | -319.00 |
| 1989 | 53017.50 | 0 | 53017.50 | 9624.67 | 23126.50 | |
| 1990 | 0 | 0 | 0 | 0 | 0 | |
| 1991 | 6251.25 | 0 | 6251.25 | 1108.34 | 2694.62 | |
| 1993 | 0 | 22.50 | -22.50 | -3.85 | -8.21 | |
| 1996 | 15000.00 | 0 | 15000.00 | 2414.60 | 5229.21 | |
| 1997 | 73.75 | 10.00 | 63.75 | 10.09 | 22.73 | |
| 2001 | 0 | 3.75 | -3.75 | -0.61 | -1.36 | |
| 2002 | 0 | 31.25 | -31.25 | -5.05 | -10.35 | |
| 2003 | 0 | 91.25 | -91.25 | -15.06 | -30.88 | |
| 2004 | 0 | 26.25 | -26.25 | -4.16 | -8.78 | |
| 2005 | 113.75 | 175.00 | -61.25 | -9.78 | -19.30 | |
| 2006 | 157.50 | 470.00 | -312.50 | -49.76 | -98.88 | |
| 2007 | 342.50 | 1328.75 | -986.25 | -153.31 | -297.28 | |
| 2008 | 577.50 | 2683.75 | -2106.25 | -320.95 | -598.38 | |
| 2009 | 455.00 | 3993.75 | -3538.75 | -537.37 | -988.23 | |
| 2010 | 532.50 | 7146.25 | -6613.75 | -1009.27 | -2162.20 | |
| 2011 | 10835.00 | 6722.50 | 4112.50 | 614.97 | 1144.30 | |
| 2012 | 724478.75 | 9280.00 | 715198.75 | 105534.79 | 198854.13 | |
| 2013 | 521275.00 | 6730.00 | 514545.00 | 76599.97 | 137109.62 | |
| 2014 | 508400.00 | 8775.00 | 499625.00 | 73331.91 | 137490.02 | |
| 2015 | 553266.25 | 6182.50 | 547083.75 | 79387.60 | 146907.56 | |
| 2016 | 879707.50 | 11657.50 | 868050.00 | 126432.85 | 230154.31 | |
| 2017 | 340972.50 | 9315.00 | 331657.50 | 47948.17 | 86086.67 | |
| 累计 | 3615456.25 | 75395.00 | 3540061.25 | 520756.93 | 964276.83 | |
注:(1)数据来源于作者根据FAO数据的整理;(2)由于数据缺失,表中剔除了没有数据的年份;下同。 |
表6 中国从巴基斯坦净进口大米的引致虚拟水资源Table 6 Net imports of rice from Pakistan and related virtual water |
| 年份 | 中国大米净进口量/t | 净进口中国水资源量/万m³ | 净进口巴基斯坦水资源量/万m³ | |||||||
|---|---|---|---|---|---|---|---|---|---|---|
| 绿水 | 蓝水 | 灰水 | 合计 | 绿水 | 蓝水 | 灰水 | 合计 | |||
| 1988 | -750.00 | -27.53 | -36.53 | -8.78 | -72.84 | -31.58 | -177.30 | -6.60 | -215.48 | |
| 1989 | 53017.50 | 1945.74 | 2581.95 | 620.30 | 5147.99 | 2232.04 | 12533.34 | 466.55 | 15231.93 | |
| 1991 | 6251.25 | 229.42 | 304.44 | 73.14 | 607.00 | 263.18 | 1477.80 | 55.01 | 1795.99 | |
| 1993 | -22.50 | -0.83 | -1.10 | -0.26 | -2.19 | -0.95 | -5.32 | -0.20 | -6.47 | |
| 1996 | 15000.00 | 550.50 | 730.50 | 175.50 | 1456.50 | 631.50 | 3546.00 | 132.00 | 4309.50 | |
| 1997 | 63.75 | 2.34 | 3.10 | 0.75 | 6.19 | 2.68 | 15.07 | 0.56 | 18.31 | |
| 2001 | -3.75 | -0.14 | -0.18 | -0.04 | -0.36 | -0.16 | -0.89 | -0.03 | -1.08 | |
| 2002 | -31.25 | -1.15 | -1.52 | -0.37 | -3.04 | -1.32 | -7.39 | -0.28 | -8.99 | |
| 2003 | -91.25 | -3.35 | -4.44 | -1.07 | -8.86 | -3.84 | -21.57 | -0.80 | -26.21 | |
| 2004 | -26.25 | -0.96 | -1.28 | -0.31 | -2.55 | -1.11 | -6.21 | -0.23 | -7.55 | |
| 2005 | -61.25 | -2.25 | -2.98 | -0.72 | -5.95 | -2.58 | -14.48 | -0.54 | -17.60 | |
| 2006 | -312.50 | -11.47 | -15.22 | -3.66 | -30.35 | -13.16 | -73.88 | -2.75 | -89.79 | |
| 2007 | -986.25 | -36.20 | -48.03 | -11.54 | -95.77 | -41.52 | -233.15 | -8.68 | -283.35 | |
| 2008 | -2106.25 | -77.30 | -102.57 | -24.64 | -204.51 | -88.67 | -497.92 | -18.54 | -605.13 | |
| 2009 | -3538.75 | -129.87 | -172.34 | -41.40 | -343.61 | -148.98 | -836.56 | -31.14 | -1016.68 | |
| 2010 | -6613.75 | -242.72 | -322.09 | -77.38 | -642.19 | -278.44 | -1563.49 | -58.20 | -1900.13 | |
| 2011 | 4112.50 | 150.93 | 200.28 | 48.12 | 399.33 | 173.14 | 972.20 | 36.19 | 1181.53 | |
| 2012 | 715198.75 | 26247.79 | 34830.18 | 8367.83 | 69445.80 | 30109.87 | 169072.98 | 6293.75 | 205476.60 | |
| 2013 | 514545.00 | 18883.80 | 25058.34 | 6020.18 | 49962.32 | 21662.34 | 121638.44 | 4528.00 | 147828.78 | |
| 2014 | 499625.00 | 18336.24 | 24331.74 | 5845.61 | 48513.59 | 21034.21 | 118111.35 | 4396.70 | 143542.26 | |
| 2015 | 547083.75 | 20077.97 | 26642.98 | 6400.88 | 53121.83 | 23032.23 | 129330.60 | 4814.34 | 157177.17 | |
| 2016 | 868050.00 | 31857.44 | 42274.04 | 10156.19 | 84287.67 | 36544.91 | 205207.02 | 7638.84 | 249390.77 | |
| 2017 | 331657.50 | 12171.83 | 16151.72 | 3880.39 | 32203.94 | 13962.78 | 78403.83 | 2918.59 | 95285.20 | |
| 累计 | 3540061.25 | 129920.23 | 172400.99 | 41418.72 | 343739.94 | 149036.57 | 836870.47 | 31152.54 | 1017059.58 | |
表7 中巴两国水资源规模Table 7 Scale of water resources in China and Pakistan |
| 水资源规模 | 1988—1992年 | 1993—1997年 | 1998—2002年 | 2003—2007年 | 2008—2012年 | 2013—2017年 |
|---|---|---|---|---|---|---|
| 中国 | ||||||
| 长期年平均降水量深度/(mm/年) | 645 | 645 | 645 | 645 | 645 | 645 |
| 长期年平均降水量体积/(10亿m3/年) | 6192 | 6192 | 6192 | 6192 | 6192 | 6192 |
| 人均可再生水资源总量/(m3/人/年) | 2307 | 2206 | 2139 | 2077 | 2020 | 1971 |
| 农业平均用水量/(10亿m3/年) | 415 | 407.7 | 378.4 | 360 | 388 | 385.2 |
| 农业用水量占总用水量百分比/% | 83 | 77.6 | 68.83 | 63.01 | 64.31 | 64.4 |
| 人均年用水总量/(m3/人/年) | 406.2 | 408.1 | 414 | 417.9 | 429 | 415 |
| 巴基斯坦 | ||||||
| 长期年平均降水量深度/(mm/年) | 494 | 494 | 494 | 494 | 494 | 494 |
| 长期年平均降水量体积/(10亿m3/年) | 393.3 | 393.3 | 393.3 | 393.3 | 393.3 | 393.3 |
| 人均可再生水资源总量/(m3/人/年) | 2170 | 1912 | 1706 | 1539 | 1387 | 1253 |
| 农业平均用水量/(10亿m3/年) | 150.6 | — | 162.7 | — | 172.4 | — |
| 农业用水量占总用水量百分比/% | 96.79 | — | 94.26 | — | 93.95 | — |
| 人均年用水总量/(m3/人/年) | 1368 | — | 1193 | — | 1031 | — |
注:(1)数据来源于FAO水资源数据库;(2)“—”为数据缺失部分。 |
| [1] |
国家发展改革委, 外交部, 商务部. 推动共建丝绸之路经济带和21世纪海上丝绸之路的愿景与行动. 人民日报, 2015-03-29(004).
[ NDRC, MFA, MC. Vision and actions to promote the joint construction of the Silk Road Economic Belt and the 21st- Century Maritime Silk Road. People's Daily, 2015-03-29(004).]
|
| [2] |
张耀铭. 中巴经济走廊建设: 成果、风险与对策. 西北大学学报: 哲学社会科学版, 2019,49(4):14-22.
[
|
| [3] |
|
| [4] |
于晓华. 以市场促进农业发展: 改革开放40年的经验和教训. 农业经济问题, 2018, (10):8-13.
[
|
| [5] |
全世文, 于晓华. 中国农业政策体系及其国际竞争力. 改革, 2016, (11):130-138.
[
|
| [6] |
|
| [7] |
刘红梅, 李国军, 王克强. 中国农业虚拟水国际贸易影响因素研究: 基于引力模型的分析. 管理世界, 2010, (9):76-87, 187.
[
|
| [8] |
孙才志, 刘玉玉, 张蕾. 中国农产品虚拟水与资源环境经济要素的时空匹配分析. 资源科学, 2010,32(3):512-519.
[
|
| [9] |
孙才志, 张蕾. 中国农产品虚拟水—耕地资源区域时空差异演变. 资源科学, 2009,31(1):84-93.
[
|
| [10] |
|
| [11] |
|
| [12] |
|
| [13] |
于晓华, 武宗励, 周洁红. 欧盟农业改革对中国的启示: 国际粮食价格长期波动和国内农业补贴政策的关系. 中国农村经济, 2017, (2):84-96.
[
|
| [14] |
|
| [15] |
于晓华, 钟晓萍, 张越杰. 农村土地政策改革与城乡融合发展: 基于中央“一号文件”的政策分析. 吉林大学社会科学学报, 2019,59(5):150-162-222-223.
[
|
| [16] |
钟晓萍, 于晓华, 唐忠. 地权的阶级属性与农地“三权分置”: 一个制度演化的分析框架. 农业经济问题, 2020, (7):47-57.
[
|
| [17] |
于晓华, 钟晓萍. 马克思产权理论视点下的地权属性研究. 江南大学学报: 人文社会科学版, 2020,19(4):49-55, 76.
[
|
| [18] |
|
| [19] |
|
| [20] |
张文丽, 刘爱民, 成升魁, 等. 中国农产品贸易的虚拟土地资源量化研究. 自然资源学报, 2013,28(8):1289-1297.
[
|
| [21] |
刘玉洁, 代粮, 张婕, 等. 资源承载力监测: 以西藏“一江两河”地区为例. 自然资源学报, 2020,35(7):1699-1713.
[
|
| [22] |
|
| [23] |
程国栋. 虚拟水: 中国水资源安全战略的新思路. 中国科学院院刊, 2003,18(4):260-265.
[
|
| [24] |
|
| [25] |
于晓华, 郭沛. 农业经济学科危机及未来发展之路. 中国农村经济, 2015, (8):89-96.
[
|
| [26] |
田旭, 于晓华, 张晓恒. 中国粮食生产潜能分析: 一个基于“俱乐部收敛” 的视点. 浙江大学学报: 人文社会科学版, 2016,46(5):112-128.
[
|
| [27] |
|
| [28] |
|
| [29] |
刘畅, 付磊. 信息技术、数据要素与乡村治理体系和治理能力现代化研究. 江南大学学报: 人文社会科学版, 2020,19(4):67-76.
[
|
| [30] |
葛良胜, 夏锐. 自然资源综合调查业务体系框架. 自然资源学报, 2020,35(9):2254-2269.
[
|
| [31] |
唐利群, 周洁红, 于晓华. 采用保护性耕作对减少水稻产量损失的实证分析: 基于4省1080个稻农的调研数据. 自然资源学报, 2017,32(6):1016-1028.
[
|
| [32] |
金涛. 中国粮食作物种植结构调整及其水土资源利用效应. 自然资源学报, 2019,34(1):14-25.
[
|
| [33] |
杨艳昭, 封志明, 孙通, 等. “一带一路” 沿线国家水资源禀赋及开发利用分析. 自然资源学报, 2019,34(6):1146-1156.
[
|
| [34] |
魏怡然, 邵玲, 张宝刚, 等. 北京市虚拟水消费与贸易. 自然资源学报, 2019,34(9):1962-1973.
[
|
| [35] |
孟祥麟. 为共同发展的梦想插上翅膀. 人民日报, 2016-02-02(003).
[
|
/
| 〈 |
|
〉 |