
JOURNAL OF NATURAL RESOURCES >
The grain production space reconstruction in China since the reform and opening up
Received date: 2020-08-10
Request revised date: 2020-10-29
Online published: 2021-08-28
Copyright
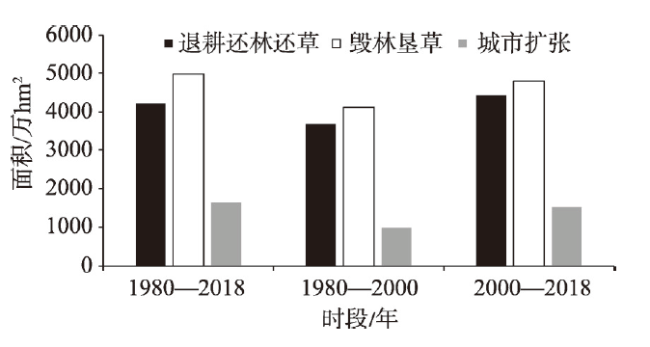
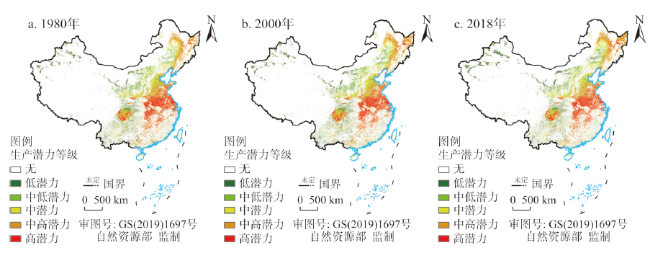
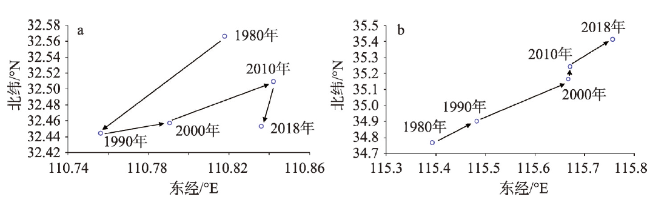
Grain production space reconstruction not only concerns China's food security, but also has a profound impact on regional economic development and ecological protection. From three dimensions of quantity, production potential and spatial pattern, the paper employs GAEZ (Global Agro-Ecological Zones) model, landscape pattern index and gravity center model to discuss the grain production space reconstruction of China from 1980 to 2018. Studies have shown that: (1) In terms of quantity, grain production space gradually decreases from south to north, and the total area remains almost unchanged, but it has frequent internal conversion. The grain production space has been transformed into other land use types, amounting to about 64.58 million hm2, of which the Grain for Green and construction land expansion account for roughly 90%. The other land use types have been converted into grain production space, reaching 66.8 million hm2, of which deforestation and grassland reclamation account for 75%. (2) From production potential, the total amount showed decreasing trends in the past 40 years, while the spatial distribution presents a pattern of "high in the east and low in the west", showing an obvious gradient difference from east to west. The decrease of total production potential of grain production space was mainly caused by the Grain for Green and construction land expansion, resulting in the decrease of grain production space with medium-low, medium and medium-high potential levels; However, its total increase was mainly attributed to the deforestation and grassland reclamation, leading to an increase of grain production space with medium and medium-high potential levels. (3) Due to the aggravation of human activities, the landscape pattern of China's grain production space has undergone significant changes since the 1980s. Its scale gradually decreased, the shape tended to be complex, and the distance gradually became far. Meanwhile, the quantity gravity center has moved southward, but not too far. The gravity center of its production potential has been moving to the northeast, with a distance of 82.74 km. This paper enriches the research setup of land system, and provides the basis for guaranteeing food security and realizing food production space's sustainable and intensive use.
Key words: grain production space; production potential; spatial pattern
ZHANG Qiu-meng , YANG Fang-she , LI Fei . The grain production space reconstruction in China since the reform and opening up[J]. JOURNAL OF NATURAL RESOURCES, 2021 , 36(6) : 1426 -1438 . DOI: 10.31497/zrzyxb.20210606
图3 1980—2018年中国粮食生产空间转换面积Fig. 3 Grain production space conversion area in China from 1980 to 2018 |
表1 1980—2018年中国粮食生产空间转换的区域差异Table 1 The regional differences of grain production space conversion of China in 1980-2018 (km2) |
| 1980—2018年 | 1980—2000年 | 2000—2018年 | |||||||||
|---|---|---|---|---|---|---|---|---|---|---|---|
| 毁林垦草 | 退耕还林还草 | 建设用地扩张 | 毁林垦草 | 退耕还林还草 | 建设用地扩张 | 毁林垦草 | 退耕还林还草 | 建设用地扩张 | |||
| 黑龙江 | 36965 | 11665 | 6657 | 32274 | 14070 | 5674 | 25317 | 18017 | 7251 | ||
| 吉林 | 16909 | 10927 | 5267 | 6694 | 2058 | 1067 | 13548 | 12161 | 5270 | ||
| 辽宁 | 14795 | 14172 | 6949 | 11803 | 8981 | 4390 | 15587 | 17785 | 6985 | ||
| 内蒙古 | 50852 | 32465 | 5715 | 46022 | 35587 | 4301 | 44865 | 36617 | 5363 | ||
| 甘肃 | 25166 | 26349 | 2601 | 26497 | 27111 | 1703 | 24515 | 26399 | 2628 | ||
| 宁夏 | 6294 | 5232 | 1128 | 1974 | 191 | 65 | 5338 | 5943 | 1185 | ||
| 新疆 | 34353 | 8102 | 3296 | 12351 | 8016 | 1051 | 28055 | 6610 | 3170 | ||
| 青海 | 3641 | 2924 | 379 | 467 | 19 | 38 | 3343 | 3044 | 376 | ||
| 西藏 | 5975 | 2812 | 80 | 2686 | 2733 | 40 | 6233 | 3101 | 62 | ||
| 四川 | 27917 | 27844 | 4393 | 30318 | 30067 | 1975 | 31107 | 31422 | 3969 | ||
| 广西 | 21792 | 21415 | 3305 | 1537 | 2078 | 617 | 21686 | 21783 | 2993 | ||
| 贵州 | 23239 | 22900 | 943 | 29213 | 28987 | 199 | 29186 | 29196 | 836 | ||
| 云南 | 33278 | 33747 | 2480 | 1392 | 1489 | 327 | 33376 | 33732 | 2270 | ||
| 重庆 | 13151 | 12762 | 1507 | 12337 | 12380 | 338 | 11788 | 11338 | 1430 | ||
| 陕西 | 25703 | 28871 | 3423 | 29754 | 29581 | 2088 | 28291 | 317173 | 3232 | ||
| 山西 | 17372 | 17628 | 5117 | 21137 | 20700 | 2773 | 20378 | 21120 | 5132 | ||
| 河南 | 5542 | 5763 | 16144 | 7558 | 7228 | 13351 | 7065 | 7193 | 16291 | ||
| 湖北 | 12007 | 12478 | 5816 | 16508 | 16526 | 3388 | 16153 | 16723 | 5287 | ||
| 湖南 | 28446 | 29093 | 2596 | 27466 | 27763 | 1361 | 28601 | 28900 | 2449 | ||
| 江西 | 17030 | 16787 | 3117 | 20026 | 20032 | 1512 | 18283 | 18033 | 2896 | ||
| 安徽 | 6205 | 6344 | 11853 | 7541 | 7584 | 8867 | 6306 | 6471 | 11312 | ||
| 北京 | 636 | 1168 | 2040 | 771 | 907 | 1276 | 639 | 1012 | 1552 | ||
| 天津 | 178 | 255 | 1529 | 201 | 233 | 950 | 197 | 249 | 1605 | ||
| 河北 | 12034 | 13125 | 15300 | 13816 | 13758 | 9725 | 9643 | 10653 | 13066 | ||
| 山东 | 9717 | 5933 | 19158 | 9493 | 9369 | 13200 | 8296 | 4486 | 17148 | ||
| 江苏 | 1477 | 1244 | 15100 | 1689 | 1607 | 9620 | 1466 | 1294 | 14261 | ||
| 上海 | 36 | 85 | 2127 | 69 | 70 | 958 | 52 | 83 | 1621 | ||
| 浙江 | 6047 | 7445 | 5359 | 8256 | 9678 | 2150 | 7813 | 8015 | 4810 | ||
| 福建 | 11046 | 10900 | 2217 | 13256 | 13222 | 1023 | 12868 | 12858 | 1941 | ||
| 广东 | 14479 | 14860 | 6394 | 14831 | 15248 | 3406 | 15549 | 15698 | 5131 | ||
| 海南 | 2593 | 2657 | 546 | 3624 | 3686 | 340 | 3308 | 3327 | 524 | ||
| 台湾 | 573 | 584 | 717 | 27 | 32 | 177 | 555 | 555 | 594 | ||
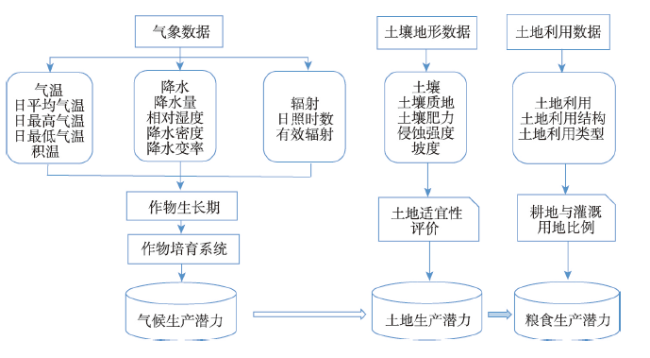
表2 粮食生产空间生产潜力的分类表Table 2 Grain production space's production potential classification table |
| 耕地生产潜力/(kg/hm2) | 耕地分类 |
|---|---|
| <2000 | 低潜力 |
| 2000~4000 | 中低潜力 |
| 4000~6000 | 中潜力 |
| 6000~8000 | 中高潜力 |
| >8000 | 高潜力 |
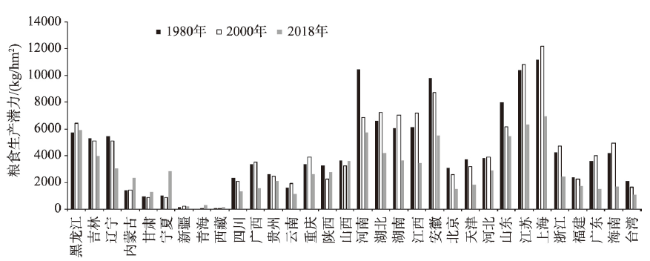
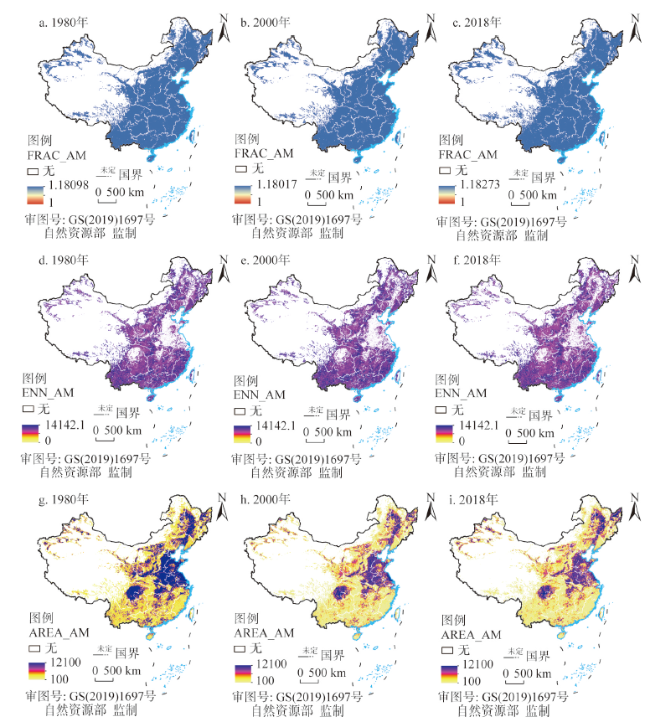
图4 1980—2018年中国不同生产潜力等级的粮食生产空间的区域差异注:本图基于自然资源部标准地图服务下载的标准地图制作,底图无修改,下同。 Fig. 4 The regional differences of grain production space's different production potential level of China in 1980-2018 |
表3 1980—2018年中国粮食生产空间变化导致的不同生产潜力等级的粮食生产空间变化Table 3 The area change of grain production space's different production potential based on grain production potential change of China in 1980-2018 (万hm2) |
| 1980—2018年 | 1980—2000年 | 2000—2018年 | |||||||||
|---|---|---|---|---|---|---|---|---|---|---|---|
| 退耕还林还草 | 建设用地 扩张 | 毁林垦草 | 退耕还林 还草 | 建设用地 扩张 | 毁林垦草 | 退耕还林还草 | 建设用地扩张 | 毁林垦草 | |||
| 低潜力 | 15.56 | 4.04 | 52.59 | 14.85 | 1.75 | 24.51 | 12.61 | 3.74 | 39.39 | ||
| 中低潜力 | 38.7 | 8.03 | 66.56 | 43.14 | 3.84 | 52.88 | 28.94 | 7.9 | 47.3 | ||
| 中潜力 | 64.45 | 25.43 | 154.72 | 85.73 | 20.48 | 141.27 | 79.43 | 25.77 | 109.06 | ||
| 中高潜力 | 94.54 | 44.89 | 336.1 | 130.41 | 38.08 | 301.19 | 143.32 | 46.66 | 224.5 | ||
| 高潜力 | 7.93 | 8.88 | 23.54 | 10.33 | 7.54 | 29.51 | 11.17 | 9.09 | 13.69 | ||
| [1] |
刘超, 霍永伟, 许月卿, 等. 生态退耕前后张家口市耕地变化及影响因素识别. 自然资源学报, 2018,33(10):1806-1820.
[
|
| [2] |
|
| [3] |
|
| [4] |
|
| [5] |
陈军. 基于GlobeLand 30的全球耕地利用格局变化研究. 中国农业科学, 2018,51(6):1089-1090.
[
|
| [6] |
张国平, 刘纪远, 纪增祥. 近10年来中国耕地资源的时空变化分析. 地理学报, 2003,58(3):323-332.
[
|
| [7] |
刘纪远, 张增祥, 庄大方, 等. 20世纪90年代中国土地利用变化时空特征及其成因分析. 地理研究, 2003,22(1):1-12.
[
|
| [8] |
刘纪远, 匡文慧, 张增祥, 等. 20世纪80年代末以来中国土地利用变化的基本特征与空间格局. 地理学报, 2014,69(1):3-13.
[
|
| [9] |
|
| [10] |
刘纪远, 宁佳, 匡文慧, 等. 2010—2015年中国土地利用变化的时空格局与新特征. 地理学报, 2018,73(5):789-802.
[
|
| [11] |
程维明, 高晓雨, 马廷, 等. 基于地貌分区的1990—2015年中国耕地时空特征变化分析. 地理学报, 2018,73(9):1613-1629.
[
|
| [12] |
石淑芹, 陈佑启, 姚艳敏, 等. 东北地区耕地变化对粮食生产能力的影响评价. 地理学报, 2008,63(6):574-586.
[
|
| [13] |
李相玺, 尹忠东, 何长高. 土地生产潜力研究综述. 水土保持学报, 2001,15(5):33-36.
[
|
| [14] |
潘佩佩, 杨桂山, 苏伟忠. 土地利用变化对生产力的影响研究进展. 地理科学进展, 2012,31(5):539-550.
[
|
| [15] |
邓祥征, 黄季焜,
[
|
| [16] |
|
| [17] |
闫慧敏, 刘纪远, 黄河清, 等. 城市化和退耕还林还草对中国耕地生产力的影响. 地理学报, 2012,67(5):579-588.
[
|
| [18] |
曲胜秋, 刘艳芳, 银超慧, 等. 1990—2015年福建省耕地变化的空间格局分析. 中国生态农业学报, 2020,28(4):587-598.
[
|
| [19] |
关兴良, 方创琳, 鲁莎莎. 中国耕地变化的空间格局与重心曲线动态分析. 自然资源学报, 2010,25(12):1997-2006.
[
|
| [20] |
张海燕, 樊江文, 邵全琴. 2000—2010年中国退牧还草工程区土地利用/覆被变化. 地理科学进展, 2015,34(7):840-853.
[
|
| [21] |
李广东, 戚伟. 中国建设用地扩张对景观格局演化的影响. 地理学报, 2019,74(12):2572-2591.
[
|
| [22] |
|
| [23] |
龙禹桥, 吴文斌, 余强毅, 等. 耕地集约化利用研究进展评述. 自然资源学报, 2018,33(2):337-350.
[
|
| [24] |
|
| [25] |
|
| [26] |
|
| [27] |
|
| [28] |
|
| [29] |
|
| [30] |
|
| [31] |
|
| [32] |
|
| [33] |
葛亚宁, 刘洛, 徐新良, 等. 近50 a气候变化背景下我国玉米生产潜力时空演变特征. 自然资源学报, 2015,30(5):784-795.
[
|
| [34] |
|
| [35] |
鞠洪润, 左丽君, 张增详, 等. 中国土地利用空间格局刻画方法研究. 地理学报, 2020,75(1):143-159.
[
|
| [36] |
|
| [37] |
|
| [38] |
刘彦随, 王介勇, 郭丽英. 中国粮食生产与耕地变化的时空动态. 中国农业科学, 2009,42(12):4269-4274.
[
|
| [39] |
|
| [40] |
刘洛, 徐新良, 刘纪远, 等. 1990—2010年中国耕地变化对粮食生产潜力的影响. 地理学报, 2014,69(12):1767-1778.
[
|
| [41] |
鞠洪润. 土地利用空间刻画方法及其在中国的应用. 北京: 中国科学院大学, 2018.
[
|
| [42] |
王朗, 徐延达, 傅伯杰, 等. 半干旱区景观格局与生态水文过程研究进展. 地球科学进展, 2009,24(11):1238-1246.
[
|
/
| 〈 |
|
〉 |