
JOURNAL OF NATURAL RESOURCES >
Spatio-temporal pattern of cereals consumption in countries along the Belt and Road
Received date: 2020-06-08
Request revised date: 2020-08-28
Online published: 2021-08-28
Copyright
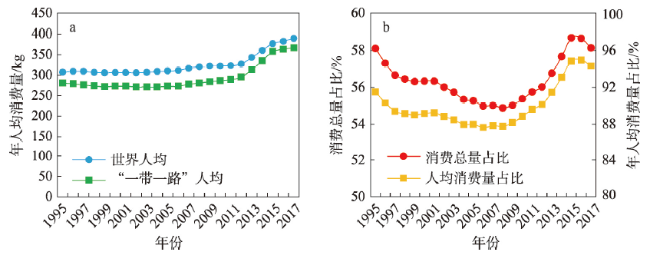
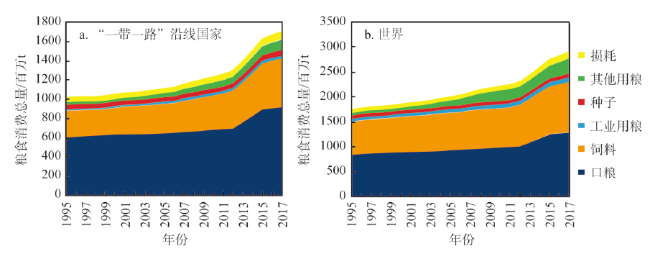
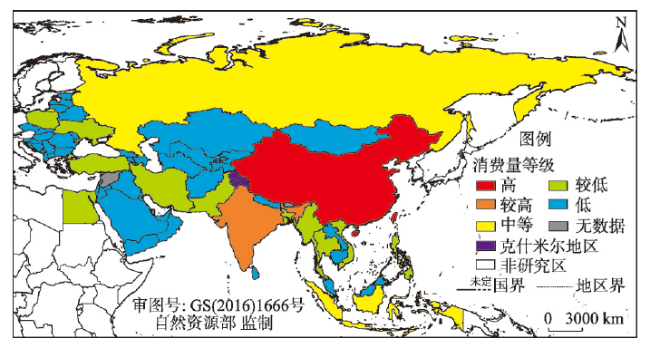
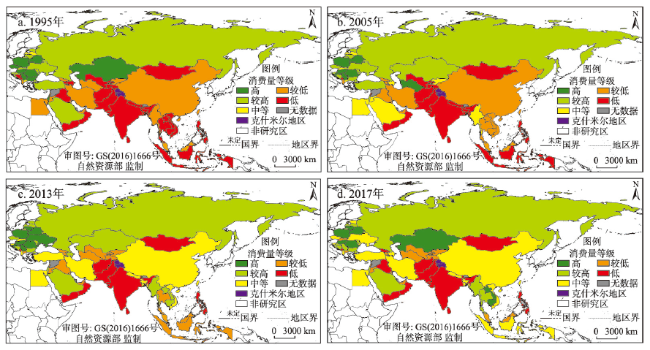
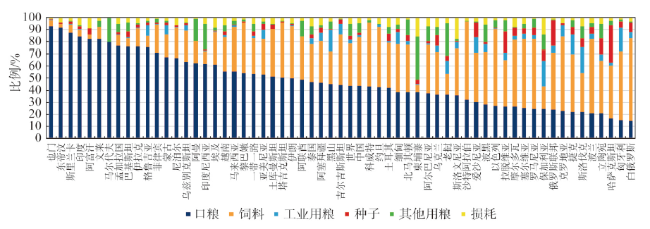
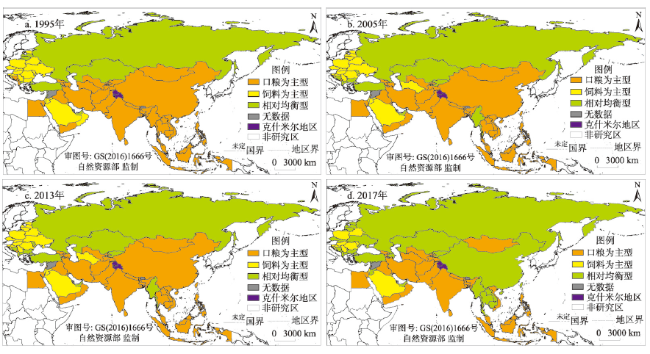
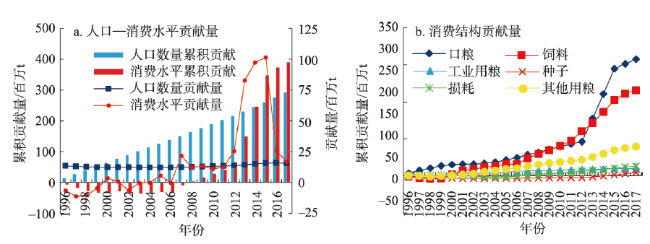
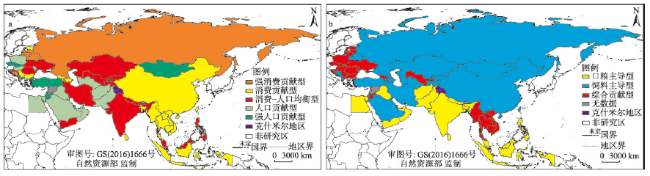
The countries along the Belt and Road are regarded as the world's important food production and consumption areas, so it is of great significance to carry out the regional food security research. The paper aims to focus on cereals consumption, analyze the spatial and temporal patterns of the cereals consumption quantity and structure of these areas during 1995-2017, and reveal their influencing factors. The results show that: (1) From 1995 to 2017, the total cereals consumption and per capita volume presented an increasing trend and the total cereals accounted for about 55%-59% of the world's total. The per capita consumption increased to 367 kg in 2017, which was 95% of the world level. (2) From 1995 to 2017, the other use and processing consumption increased dramatically, feed and food increased rapidly, but the losses and seed increased slowly, which showed a "Food-based and Feed-assisted" cereals consumption structure that was at the primary stage of cereals consumption. (3) The spatial difference of the total cereals consumption is obvious and the per capita consumption is small. The cereals consumption level is very high in Central and Eastern European countries, but it is generally low in countries with a large population, small island areas, or poor cereals production conditions. (4) The spatial difference in per capita consumption of various types of cereals is not obvious except for the total amount of feed. Nearly half of the countries are still dominated by food, and about one-quarter of the countries have completed the upgrade of the cereals consumption structure that has shifted to a relatively balanced consumption structure. (5) The cumulative contribution rate of population and consumption level is about 43% and 57%. In Central Asia, Southeast Asia and South Asia, most countries are jointly affected by consumption level and population. West Asia and the Middle East are significantly affected by population. The cumulative contribution of population and consumption level have large differences in Central and Eastern Europe. The cumulative contribution of food and feed accounted for about 46% and 34%, respectively. South Asia and Southeast Asia were mostly dominated by foods, China-Mongolia-Russia and Central Asia were mostly dominated by feed, and Central and Eastern Europe and Indochina Peninsula were mostly integrated contributors.
ZHANG Chao , YANG Yan-zhao , FENG Zhi-ming , JIA Kun , LANG Ting-ting . Spatio-temporal pattern of cereals consumption in countries along the Belt and Road[J]. JOURNAL OF NATURAL RESOURCES, 2021 , 36(6) : 1398 -1412 . DOI: 10.31497/zrzyxb.20210604
表1 “一带一路”沿线国家Table 1 Countries along the Belt and Road |
| 六大区域 | 国家名称 | 数量/个 |
|---|---|---|
| 中亚 | 哈萨克斯坦、吉尔吉斯斯坦、塔吉克斯坦、乌兹别克斯坦、土库曼斯坦 | 5 |
| 中蒙俄 | 中国、蒙古国、俄罗斯 | 3 |
| 东南亚 | 越南、老挝、柬埔寨、泰国、马来西亚、新加坡、印度尼西亚、文莱、菲律宾、缅甸、东帝汶 | 11 |
| 南亚 | 印度、巴基斯坦、孟加拉国、阿富汗、尼泊尔、不丹、斯里兰卡、马尔代夫 | 8 |
| 中东欧 | 波兰、捷克、斯洛伐克、匈牙利、斯洛文尼亚、克罗地亚、罗马尼亚、保加利亚、塞尔维亚、黑山、北马其顿、波黑、阿尔巴尼亚、爱沙尼亚、立陶宛、拉脱维亚、乌克兰、白俄罗斯、摩尔多瓦 | 19 |
| 西亚及中东 | 土耳其、伊朗、叙利亚、伊拉克、阿联酋、沙特阿拉伯、卡塔尔、巴林、科威特、黎巴嫩、阿曼、也门、约旦、以色列、巴勒斯坦、亚美尼亚、格鲁吉亚、阿塞拜疆、埃及 | 19 |
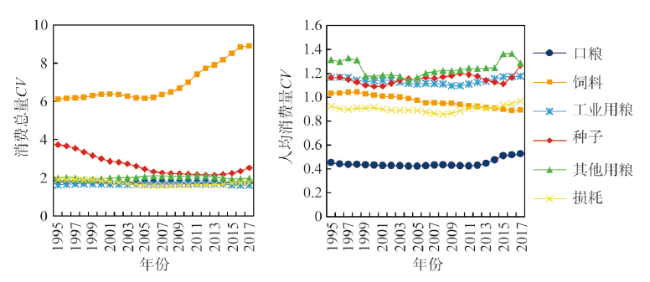
图3 1995—2017年“一带一路”沿线国家粮食消费变异系数Fig. 3 Variation coefficients of cereals consumption of countries along the Belt and Road during 1995-2017 |
| [1] |
傅伯杰, 冷疏影, 宋长青. 新时期地理学的特征与任务. 地理科学, 2015,35(8):939-945.
[
|
| [2] |
孙鸿烈, 封志明. 资源科学研究的现在与未来. 资源科学, 1998,22(1):5-14.
[
|
| [3] |
孙振远. 世界粮食问题概论. 北京: 农业出版社, 1986.
[
|
| [4] |
封志明, 李香莲. 耕地与粮食安全战略: 藏粮于土, 提高中国土地资源的综合生产能力. 地理学与国土研究, 2000,16(3):1-5.
[
|
| [5] |
|
| [6] |
简朴. 粮食消费结构变动对粮食安全的影响及对策研究. 湛江: 广东海洋大学, 2017.
[
|
| [7] |
刘卫东. “一带一路”战略的科学内涵与科学问题. 地理科学进展, 2015,34(5):538-544.
[
|
| [8] |
李富佳, 董锁成, 原琳娜, 等. “一带一路”农业战略格局及对策. 中国科学院院刊, 2016,31(6):678-688.
[
|
| [9] |
中华人民共和国商务部. “一带一路”农业投资合作项目已超650个. http://www.mofcom.gov.cn/article/i/jyjl/e/201907/20190702883466.shtml, 2020-07-10.
[ Ministry of Commerce of the People's Republic of China. China has over 650 agricultural investment cooperation projects in countries along the "Belt and Road". http://www.mofcom.gov.cn/article/i/jyjl/e/201907/20190702883466.shtml, 2020-07-10.]
|
| [10] |
杨光, 柏娜, 陈瑞剑. 我国农业对外投资合作的特点及形势分析. 农业经济, 2019,40(11):131-132.
[
|
| [11] |
詹琳, 杨东群, 秦路. 中国农业企业对“一带一路”沿线国家对外直接投资区位选择问题研究. 农业经济问题, 2020,41(3):82-92.
[
|
| [12] |
贾琨, 杨艳昭, 封志明. “一带一路”沿线国家粮食生产的时空格局分析. 自然资源学报, 2019,34(6):1135-1145.
[
|
| [13] |
FAO. The state of food security and nutrition in the world 2019. Rome, 2019.
|
| [14] |
赵捷, 姜小鱼, 陈秧分. “一带一路”农业投资风险评估及其对农业“走出去”的启示. 农业现代化研究, 2020,41(5):1-9.
[
|
| [15] |
|
| [16] |
|
| [17] |
|
| [18] |
钟甫宁, 向晶. 人口结构、职业结构与粮食消费. 农业经济问题, 2012,33(9):12-16.
[
|
| [19] |
钟甫宁, 向晶. 城镇化对粮食需求的影响: 基于热量消费视角的分析. 农业技术经济, 2012,31(1):4-10.
[
|
| [20] |
陈永红, 刘宏. 中国粮食中长期需求总量与结构分析预测. 中国食物与营养, 2013,19(1):32-36.
[
|
| [21] |
周竹君. 当前我国谷物消费需求分析. 农业技术经济, 2015,34(5):68-75.
[
|
| [22] |
骆建忠. 中国居民粮食消费量与营养水平关系分析. 中国食物与营养, 2008,14(3):37-40.
[
|
| [23] |
宋亮, 曹宝明, 朱强. 粮食安全、消费转型与政策调整. 新疆社会科学, 2019,39(3):23-32.
[
|
| [24] |
姚成胜, 殷伟, 黄琳, 等. 中国粮食生产与消费能力脆弱性的时空格局及耦合协调性演变. 经济地理, 2019,39(12):147-156.
[
|
| [25] |
胡小平, 郭晓慧. 2020年中国粮食需求结构分析及预测: 基于营养标准的视角. 中国农村经济, 2010,26(6):4-15.
[
|
| [26] |
罗其友, 米健, 高明杰. 中国粮食中长期消费需求预测研究. 中国农业资源与区划, 2014,35(5):1-7.
[
|
| [27] |
吕捷, 余中华, 赵阳. 中国粮食需求总量与需求结构演变. 农业经济问题, 2013,34(5):15-19.
[
|
| [28] |
吴宝森. 世界粮食供需形势及安全性分析. 价格理论与实践, 2008,28(3):56-57.
[
|
| [29] |
颜波, 陈玉中, 姜明伦, 等. 全球粮食供求形势分析. 中国粮食经济, 2020,33(3):68-73.
[
|
| [30] |
许世卫. 中美两国粮食消费差异比较与中国粮食问题. 中国食物与营养, 2001,7(2):51-53.
[
|
| [31] |
曹冲. 哈萨克斯坦粮食生产和消费变迁. 欧亚经济, 2014,19(6):78-85.
[
|
| [32] |
何友, 曾福生. 中国粮食生产与消费的区域格局演变. 中国农业资源与区划, 2018,39(3):1-8.
[
|
| [33] |
吴建寨, 张建华, 孔繁涛. 中国粮食生产与消费的空间格局演变. 农业技术经济, 2015,34(11):46-52.
[
|
| [34] |
胡甜, 鞠正山, 周伟. 中国粮食供需的区域格局研究. 地理学报, 2016,71(8):1372-1383.
[
|
| [35] |
孙致陆, 李先德. “一带一路”沿线国家粮食发展潜力分析. 华中农业大学学报: 社会科学版, 2017,37(1):32-43.
[
|
| [36] |
孙致陆, 贾小玲, 李先德. 中国与“一带一路”沿线国家粮食贸易演变趋势及其虚拟耕地资源流量估算. 华中农业大学学报: 社会科学版, 2019 , 39(1):24-32.
[
|
| [37] |
陈艺文, 李二玲. “一带一路”国家粮食贸易网络空间格局及其演化机制. 地理科学进展, 2019,38(10):1643-1654.
[
|
| [38] |
封志明, 孙通, 杨艳昭. 2003—2013年中国粮食增产格局及其贡献因素研究. 自然资源学报, 2016,31(6):895-907.
[
|
| [39] |
段健, 徐勇, 孙晓一. 青藏高原粮食生产、消费及安全风险格局变化. 自然资源学报, 2019,34(4):673-688.
[
|
| [40] |
FAO. Food balance sheets: A handbook. Rome, 2001.
|
| [41] |
刘卫东. 共建绿色丝绸之路: 资源环境基础与社会经济背景. 北京: 商务印书馆, 2019.
[
|
| [42] |
李裕瑞, 卞新民. 江苏省粮食生产地域格局变化研究. 地域研究与开发, 2008,27(2):113-117.
[
|
| [43] |
|
| [44] |
刘玉, 高秉博, 潘瑜春, 等. 基于LMDI模型的中国粮食产量变化及作物构成分解研究. 自然资源学报, 2014,29(10):1709-1720.
[
|
| [45] |
封志明, 肖池伟, 杨艳昭. 东南亚稻米生产时空变化格局分析. 科技导报, 2018,36(3):75-81.
[
|
| [46] |
孙通, 封志明, 杨艳昭. 2003—2013年中国县域单元粮食增产格局及贡献因素研究. 自然资源学报, 2017,32(2):177-185.
[
|
| [47] |
孙倩, 李晓云, 杨志海, 等. 粮食与营养安全研究评述及展望. 自然资源学报, 2019,34(8):1782-1796.
[
|
| [48] |
|
| [49] |
|
/
| 〈 |
|
〉 |
