
JOURNAL OF NATURAL RESOURCES >
The evolution of "Production-Living-Ecological" space, eco-environmental effects and its influencing factors in China
Received date: 2020-05-08
Revised date: 2020-09-28
Online published: 2021-07-28
Copyright
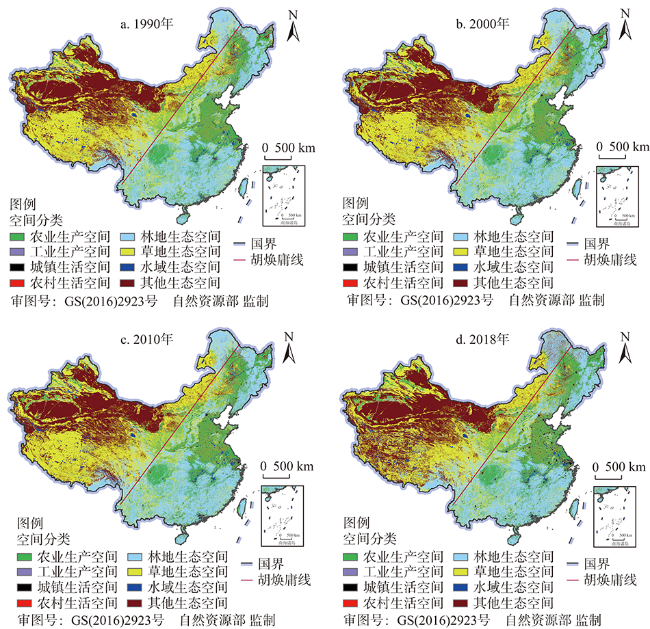
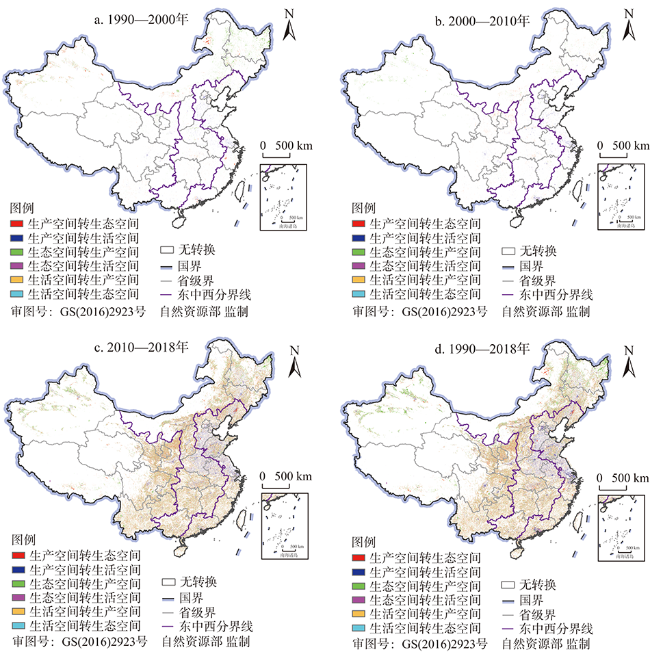
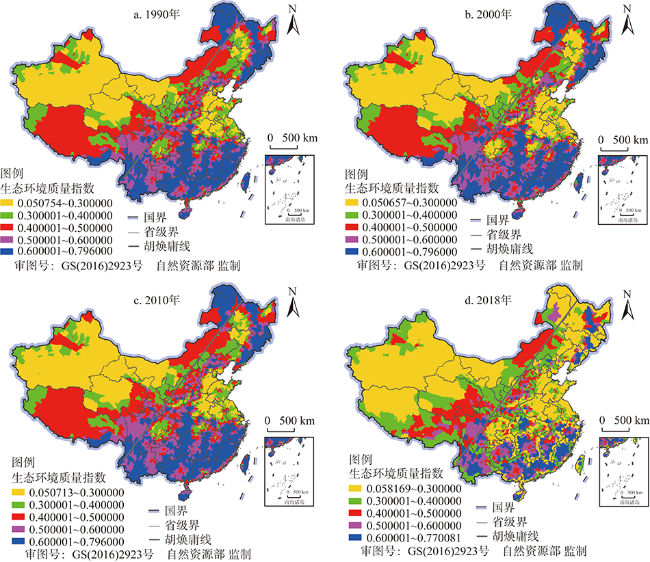
Based on the remote sensing monitoring data of land use change/cover in 1990, 2000, 2010 and 2018, using land use transfer matrix, eco-environmental quality index, and ecological contribution ratio of land use transition, this paper analyzes the spatiotemporal features of "Production-Living-Ecological" space structural transformation and eco-environmental effects of land use/cover change in China from 1990 to 2018. On this basis, we identify the main influencing factors of eco-environmental effects and the spatial heterogeneity by using geographically weighted regression model. The results showed that: (1) The production and living space increased, the ecological space decreased, and the overall situation was insufficient from 1990 to 2018 in the whole country. (2) The high-value areas of eco-environmental quality were concentrated to the east of the Hu Huanyong Line during 1990-2018, and mainly in the south and northeast of China. The low-value areas were mainly distributed to the northwest of Hu Huanyong Line. The squeeze of other ecological space and agricultural production space on grassland and woodland ecological space is an important reason for the deterioration of the eco-environment during the study period. (3) Slope, annual precipitation, land use intensity, elevation, topographic relief, population density, and average annual temperature were the main factors influencing eco-environmental quality pattern in China, and the spatial difference of the effect of each factor was obvious. Chinese policies on economic development should take into account the eco-environmental effect of "Production-Living-Ecological" space transformation and influencing factors in the future, and promote the rational distribution of "Production-Living-Ecological" space and the construction of ecological civilization in China.
KONG Dong-yan , CHEN Hui-guang , WU Kong-sen . The evolution of "Production-Living-Ecological" space, eco-environmental effects and its influencing factors in China[J]. JOURNAL OF NATURAL RESOURCES, 2021 , 36(5) : 1116 -1135 . DOI: 10.31497/zrzyxb.20210503
表1 “三生空间”结构与土地利用类型衔接表Table 1 Corresponding table of "Production-Living-Ecological" space and land use type |
| 一级分类 | 二级分类 | 《全国遥感监测土地利用/覆盖分类体系》的二级地类 | 生态环境质量指数 |
|---|---|---|---|
| 生产空间(P) | 农业生产空间 | 水田、旱地 | 0.263 |
| 工业生产空间 | 工矿、交通建设用地 | 0.150 | |
| 生活空间(L) | 城镇生活空间 | 城镇用地 | 0.200 |
| 农村生活空间 | 农村居民点用地 | 0.200 | |
| 生态空间(E) | 林地生态空间 | 有林地、灌木林、疏林地、其他林地 | 0.796 |
| 草地生态空间 | 高、中、低覆盖度草地 | 0.465 | |
| 水域生态空间 | 河渠、湖泊、水库坑塘、永久性冰川雪地、滩涂、滩地 | 0.697 | |
| 其他生态空间 | 沙地、戈壁、盐碱地、沼泽地、裸土地、裸岩石质地、其他未利用地 | 0.045 |
表2 地理加权回归指标体系Table 2 The index system of GWR model |
| 维度 | 指标 | 计算方法 |
|---|---|---|
| 自然环境特征 | 海拔 | ArcGIS 10.5中使用ArcToolbox/Spatial Analyst工具/区域分析/以表格显示分区统计工具提取 |
| 坡度 | ArcGIS 10.5中使用ArcToolbox/Spatial Analyst工具/表面分析/坡度,并以表格显示分区统计工具提取 | |
| 地形起伏度 | ArcGIS 10.5中使用ArcToolbox/Spatial Analyst工具/区域分析/以表格显示分区统计工具提取 | |
| 年平均降水量 | ArcGIS 10.5中使用ArcToolbox/Spatial Analyst工具/区域分析/以表格显示分区统计工具提取 | |
| 年平均气温 | ArcGIS 10.5中使用ArcToolbox/Spatial Analyst工具/区域分析/以表格显示分区统计工具提取 | |
| 社会经济特征 | 土地利用强度 | 借鉴庄大方等[39]提出的土地利用程度测度模型,测度中国土地系统在社会因素影响下自然平衡保持状态[2] |
| 土地利用多样性 | 借鉴Shannon-Wiener指数,测度中国土地利用的丰富度、复杂度和有序度[2,40] | |
| 人口密度 | ArcGIS 10.5中使用ArcToolbox/Spatial Analyst工具/区域分析/以表格显示分区统计工具提取 | |
| 地均GDP | ArcGIS 10.5中使用ArcToolbox/Spatial Analyst工具/区域分析/以表格显示分区统计工具提取 | |
| 到最近省会中心距离 | ArcGIS 10.5中使用ArcToolbox/分析工具/邻域分析/近邻分析工具提取 |
表3 中国“三生空间”面积占比及变化Table 3 The area proportion and change of "Production-Living-Ecological" space in China (%) |
| 时段/年 | 生产空间(P) | 生活空间(L) | 生态空间(E) | |||||
|---|---|---|---|---|---|---|---|---|
| 农业 | 工业 | 城镇 | 农村 | 林地 | 草地 | 水域 | 其他 | |
| 1990 | 18.657 | 0.126 | 0.270 | 1.267 | 23.704 | 32.072 | 2.835 | 21.070 |
| 2000 | 18.955 | 0.146 | 0.348 | 1.320 | 23.597 | 31.708 | 2.863 | 21.066 |
| 2010 | 18.820 | 0.235 | 0.489 | 1.357 | 23.633 | 31.580 | 2.888 | 21.003 |
| 2018 | 18.805 | 0.508 | 0.827 | 1.499 | 23.981 | 27.979 | 3.093 | 23.417 |
| 1990—2000 | 0.298 | 0.020 | 0.078 | 0.053 | -0.107 | -0.364 | 0.028 | -0.004 |
| 2000—2010 | -0.135 | 0.089 | 0.141 | 0.037 | 0.036 | -0.128 | 0.025 | -0.063 |
| 2010—2018 | -0.015 | 0.273 | 0.338 | 0.142 | 0.348 | -3.601 | 0.205 | 2.414 |
| 1990—2018 | 0.148 | 0.382 | 0.557 | 0.232 | 0.277 | -4.093 | 0.258 | 2.347 |
表4 中国1990—2018年“三生空间”结构变化转移矩阵及内部转换贡献率Table 4 Change matrix and internal conversion contribution rate of each compared "Production-Living-Ecological" space in China during 1990-2018 |
| 2018年 | ||||||||||||
|---|---|---|---|---|---|---|---|---|---|---|---|---|
| 期内增减率/% | 农业生产空间 | 工业生产空间 | 城镇生活空间 | 农村生活空间 | 林地生态空间 | 草地生态空间 | 水域生态空间 | 其他生态空间 | 1990年转换总计/km2 | |||
| 1990年 | 农业生产空间 | 0.784 | 面积/km2 | — | 19531 | 40645 | 98101 | 253841 | 162811 | 40688 | 16498 | 632115 |
| 转入率/% | — | 0.325 | 0.558 | 11.909 | 40.617 | 34.281 | 5.495 | 6.815 | — | |||
| 转出率/% | — | 3.090 | 6.430 | 15.519 | 40.157 | 25.757 | 6.437 | 2.610 | — | |||
| 工业生产空间 | 291.339 | 面积/km2 | 2099 | — | 1260 | 537 | 855 | 610 | 3558 | 463 | 9382 | |
| 转入率/% | 44.665 | — | 1.006 | 3.437 | 18.819 | 17.979 | 5.806 | 8.288 | — | |||
| 转出率/% | 22.373 | — | 13.430 | 5.724 | 9.113 | 6.502 | 37.924 | 4.935 | — | |||
| 城镇生活空间 | 205.319 | 面积/km2 | 3604 | 440 | — | 631 | 1054 | 417 | 779 | 117 | 7042 | |
| 转入率/% | 68.312 | 2.118 | — | 9.219 | 8.637 | 5.822 | 4.664 | 1.229 | — | |||
| 转出率/% | 51.179 | 6.248 | — | 8.961 | 14.967 | 5.922 | 11.062 | 1.661 | — | |||
| 农村生活空间 | 18.283 | 面积/km2 | 76932 | 1503 | 5485 | — | 7230 | 6284 | 3158 | 1410 | 102002 | |
| 转入率/% | 79.152 | 0.433 | 0.509 | — | 7.625 | 8.187 | 2.589 | 1.505 | — | |||
| 转出率/% | 75.422 | 1.474 | 5.377 | — | 7.088 | 6.161 | 3.096 | 1.382 | — | |||
| 林地生态空间 | 1.128 | 面积/km2 | 262375 | 8229 | 5139 | 9450 | — | 252916 | 17465 | 45464 | 601038 | |
| 转入率/% | 40.527 | 0.137 | 0.168 | 1.154 | — | 50.599 | 2.355 | 5.060 | — | |||
| 转出率/% | 43.654 | 1.369 | 0.855 | 1.572 | — | 42.08 | 2.906 | 7.564 | — | |||
| 草地生态空间 | -12.800 | 面积/km2 | 221451 | 7862 | 3464 | 10147 | 316925 | — | 58199 | 570489 | 1188537 | |
| 转入率/% | 20.356 | 0.076 | 0.052 | 0.786 | 31.622 | — | 4.281 | 42.827 | — | |||
| 转出率/% | 18.632 | 0.661 | 0.291 | 0.854 | 26.665 | — | 4.897 | 47.999 | — | |||
| 水域生态空间 | 7.850 | 面积/km2 | 35496 | 2539 | 2775 | 3209 | 14750 | 34237 | — | 45937 | 138943 | |
| 转入率/% | 25.458 | 2.226 | 0.487 | 1.976 | 10.928 | 36.414 | — | 22.511 | — | |||
| 转出率/% | 25.547 | 1.827 | 1.997 | 2.31 | 10.616 | 24.641 | — | 33.062 | — | |||
| 其他生态空间 | 11.018 | 面积/km2 | 44024 | 3624 | 731 | 1865 | 31695 | 342528 | 35979 | — | 460446 | |
| 转入率/% | 2.425 | 0.068 | 0.017 | 0.207 | 6.682 | 83.849 | 6.752 | — | — | |||
| 转出率/% | 9.561 | 0.787 | 0.159 | 0.405 | 6.884 | 74.39 | 7.814 | — | — | |||
| 2018年转换 总计/km2 | 645981 | 43728 | 59499 | 123940 | 626350 | 799803 | 159826 | 680378 | — | |||
| 期内转换量/km2 | 13866 | 34346 | 52457 | 21938 | 25312 | -388734 | 20883 | 219932 | — | |||
表5 影响生态环境质量的主要“三生空间”转型、生态贡献率及比率Table 5 Major "Production-Living-Ecological" land use transformation types influencing eco-environmental quality, their contribution rate and ratio |
| 导致生态环境改善 | 导致生态环境恶化 | ||||
|---|---|---|---|---|---|
| “三生空间”结构转型 | 贡献率 | 占贡献率比例/% | “三生空间”结构转型 | 贡献率 | 占贡献率比例/% |
| 其他生态空间—草地生态空间 | 0.004362 | 32.868 | 草地生态空间—其他生态空间 | -0.008353 | 42.025 |
| 农业生产空间—林地生态空间 | 0.003798 | 28.621 | 林地生态空间—农业生产空间 | -0.003856 | 19.404 |
| 草地生态空间—林地生态空间 | 0.001393 | 10.498 | 草地生态空间—农业生产空间 | -0.002331 | 11.729 |
| 农业生产空间—草地生态空间 | 0.001392 | 10.490 | 林地生态空间—草地生态空间 | -0.001565 | 7.874 |
| 其他生态空间—林地生态空间 | 0.000607 | 4.573 | 林地生态空间—其他生态空间 | -0.000855 | 4.303 |
| 水域生态空间—草地生态空间 | 0.000399 | 3.010 | 草地生态空间—水域生态空间 | -0.000787 | 3.960 |
| 农村生活空间—农业生产空间 | 0.000382 | 2.875 | 农业生产空间—农村生活空间 | -0.000478 | 2.403 |
| 水域生态空间—林地生态空间 | 0.000267 | 2.010 | 林地生态空间—水域生态空间 | -0.000309 | 1.555 |
| 其他生态空间—农业生产空间 | 0.000186 | 1.401 | 农业生产空间—城镇生活空间 | -0.000204 | 1.025 |
| 总计 | 0.012787 | 96.347 | 总计 | -0.018738 | 94.279 |
表6 逐步回归模型估计结果Table 6 The estimation results of stepwise regression model |
| 变量 | 非标准化系数 | 标准系数 | t | Sig. | |
|---|---|---|---|---|---|
| B | 标准错误 | β | |||
| 常量 | 0.536 | 0.045 | 11.991 | 0.000 | |
| 坡度 | 0.020 | 0.001 | 0.769 | 19.399 | 0.000 |
| 年平均降水量 | 0.000 | 0.000 | 0.523 | 11.072 | 0.000 |
| 地形起伏度 | 0.000 | 0.000 | -0.322 | -6.367 | 0.000 |
| 土地利用强度 | -0.001 | 0.000 | -0.216 | -4.882 | 0.000 |
| DEM | 0.000 | 0.000 | -0.252 | -5.368 | 0.000 |
| 年平均气温 | 0.000 | 0.000 | -0.215 | -4.435 | 0.000 |
| 人口密度 | 0.000 | 0.000 | -0.077 | -2.363 | 0.019 |
| R2 | 0.765 | ||||
| 调整后的R2 | 0.761 | ||||
| F | 163.191 | ||||
| Sig. | 0.000 | ||||
表7 GWR模型估计结果Table 7 The estimation results of GWR model |
| 变量 | 平均值 | 最小值 | 上四分位 | 中位数 | 下四分位 | 最大值 |
|---|---|---|---|---|---|---|
| 地形起伏度 | -0.2675 | -0.3536 | -0.3091 | -0.2648 | -0.2285 | -0.1474 |
| 海拔 | -0.3396 | -0.5655 | -0.4267 | -0.3552 | -0.2639 | 0.0035 |
| 坡度 | 0.7531 | 0.6254 | 0.7112 | 0.7517 | 0.7964 | 0.9301 |
| 人口密度 | -0.1290 | -0.5443 | -0.1617 | -0.1086 | -0.0831 | 0.0136 |
| 土地利用强度 | -0.3674 | -0.5959 | -0.4742 | -0.3688 | -0.3023 | 0.1563 |
| 年平均降水量 | 0.4625 | 0.2875 | 0.3980 | 0.4647 | 0.5267 | 0.7014 |
| 年平均气温 | -0.1229 | -0.4971 | -0.2423 | -0.1307 | 0.0009 | 0.2024 |
| 带宽 | 2180862.421 | |||||
| 残差平方和 | 2.505 | |||||
| Sigma | 0.085 | |||||
| 赤池信息准则AICc | -735.241 | |||||
| R2 | 0.863 | |||||
| 校正R2 | 0.858 | |||||
图4 基于GWR模型的2010年中国生态环境质量影响因素的标准化残差及回归系数空间分布Fig. 4 Spatial distribution of standardized residual and regression coefficients of driving factors of eco-environmental quality based on GWR model in China |
表8 影响因素回归系数均值分区统计Table 8 Mean zoning statistics of regression coefficients of influencing factors |
| 分区 | 地形起伏度 | 海拔 | 坡度 | 人口密度 | 土地利用强度 | 年均降水量 | 年均气温 | 常数项 |
|---|---|---|---|---|---|---|---|---|
| 全国 | -0.2675 | -0.3396 | 0.7531 | -0.1290 | -0.3674 | 0.4625 | -0.1229 | 0.6320 |
| 东北 | -0.2093 | -0.5121 | 0.8566 | -0.0353 | -0.3384 | 0.5390 | -0.3873 | 0.7085 |
| 西南 | -0.3160 | -0.1907 | 0.7289 | -0.1926 | -0.2941 | 0.4535 | 0.0121 | 0.5445 |
| 华东 | -0.2273 | -0.4320 | 0.7401 | -0.0802 | -0.4718 | 0.4225 | -0.1347 | 0.7182 |
| 西北 | -0.3304 | -0.2256 | 0.7754 | -0.2482 | -0.1491 | 0.5828 | -0.2083 | 0.5244 |
| 中南 | -0.2527 | -0.3264 | 0.7025 | -0.1083 | -0.4739 | 0.3816 | 0.0096 | 0.6433 |
| 华北 | -0.2910 | -0.3949 | 0.8261 | -0.1169 | -0.2957 | 0.5418 | -0.2897 | 0.6433 |
| [1] |
|
| [2] |
陈万旭, 李江风, 曾杰, 等. 中国土地利用变化生态环境效应的空间分异性与形成机理. 地理研究, 2019,38(9):2173-2187.
[
|
| [3] |
胡锋, 安裕伦, 赵海兵. 基于土地利用转型视角的“亚喀斯特”区域生态环境效应研究: 以黔中部分地区为例. 地球与环境, 2016,44(4):447-454.
[
|
| [4] |
王福红, 赵锐锋, 张丽华, 等. 黑河中游土地利用转型过程及其对区域生态质量的影响. 应用生态学报, 2017,28(12):4057-4066.
[
|
| [5] |
|
| [6] |
龙花楼, 曲艺, 屠爽爽, 等. 城镇化背景下中国农区土地利用转型及其环境效应研究: 进展与展望. 地球科学进展, 2018,33(5):455-463.
[
|
| [7] |
纪迪, 张慧, 沈渭寿, 等. 太湖流域下垫面改变与气候变化的响应关系. 自然资源学报, 2013,28(1):51-62.
[
|
| [8] |
|
| [9] |
高俊峰. 太湖流域土地利用变化及洪涝灾害响应. 自然资源学报, 2002,17(2):150-156.
[
|
| [10] |
欧维新, 杨桂山, 于兴修, 等. 盐城海岸带土地利用变化的生态环境效应研究. 资源科学, 2004,26(3):76-83.
[
|
| [11] |
史洋洋, 吕晓, 黄贤金, 等. 江苏沿海地区耕地利用转型及其生态系统服务价值变化响应. 自然资源学报, 2017,32(6):961-976.
[
|
| [12] |
戴文远, 江方奇, 黄万里, 等. 基于“三生空间”的土地利用功能转型及生态服务价值研究: 以福州新区为例. 自然资源学报, 2018,33(12):2098-2109.
[
|
| [13] |
杨清可, 段学军, 王磊, 等. 基于“三生空间”的土地利用转型与生态环境效应: 以长江三角洲核心区为例. 地理科学, 2018,38(1):97-106.
[
|
| [14] |
谭静, 官冬杰, 虎帅. 重庆三峡库区土地利用时空转型及其生态环境响应研究: 以重庆市忠县为例. 资源开发与市场, 2017,33(3):311-315, 342.
[
|
| [15] |
罗刚, 廖和平, 李强, 等. 基于“三生空间”的土地利用主导功能转型及其生态环境响应: 以重庆市巴南区为例. 西南大学学报: 自然科学版, 2018,40(4):105-113.
[
|
| [16] |
何青泽, 谢德体, 王三, 等. 重庆市北碚区土地利用转型及生态环境效应. 水土保持研究, 2019,26(2):290-296.
[
|
| [17] |
袁悦, 井立蛟, 杨鸿雁, 等. 昌黎县土地利用转型对生态环境效应的影响. 水土保持研究, 2019,26(2):194-201.
[
|
| [18] |
吕立刚, 周生路, 周兵兵, 等. 区域发展过程中土地利用转型及其生态环境响应研究: 以江苏省为例. 地理科学, 2013,33(12):1442-1449.
[
|
| [19] |
李晓文, 方精云, 朴世龙. 近10年来长江下游土地利用变化及其生态环境效应. 地理学报, 2003,58(5):659-667.
[
|
| [20] |
郭泽呈, 魏伟, 张学渊, 等. 基于RS和GIS的石羊河流域生态环境质量空间分布特征及其影响因素. 应用生态学报, 2019,30(9):3075-3086.
[
|
| [21] |
朱青, 国佳欣, 郭熙, 等. 鄱阳湖区生态环境质量的空间分异特征及其影响因素. 应用生态学报, 2019,30(12):4108-4116.
[
|
| [22] |
宋媛, 石惠春, 谢敏慧, 等. 2000—2017年甘肃省生态环境质量时空演变格局及其影响因素. 生态学杂志, 2019,38(12):3800-3808.
[
|
| [23] |
刘辉, 车高红, 高辰晶, 等. 河北省生态环境质量变化及影响因素分析. 生态科学, 2016,35(2):89-97.
[
|
| [24] |
杨万平, 赵金凯. 中国人居生态环境质量的时空差异及影响因素研究. 华东经济管理, 2018,32(2):58-67.
[
|
| [25] |
彭超, 张琛. 农村人居环境质量及其影响因素研究. 宏观质量研究, 2019,7(3):66-78.
[
|
| [26] |
后立胜, 蔡运龙. 土地利用/覆被变化研究的实质分析与进展评述. 地理科学进展, 2004,23(6):96-104.
[
|
| [27] |
马贤磊, 唐亮, 孙萌丽. 城镇土地生态环境效应的影响因素研究: 基于LMDI分解模型. 南京农业大学学报: 社会科学版, 2018,18(2):117-128, 161.
[
|
| [28] |
高艺宁, 赵萌莉, 王宏亮, 等. 景观生态视角下草地生态质量的空间差异及其影响因素: 以内蒙古四子王旗为例. 生态学报, 2019,39(14):5288-5300.
[
|
| [29] |
李华, 高强, 吴梵. 环渤海地区海洋经济发展进程中的生态环境响应及其影响因素. 中国人口·资源与环境, 2017,27(8):36-43.
[
|
| [30] |
江曼琦, 刘勇. “三生”空间内涵与空间范围的辨析. 城市发展研究, 2020,27(4):43-48, 61.
[
|
| [31] |
陈婧, 史培军. 土地利用功能分类探讨. 北京师范大学学报: 自然科学版, 2005,41(5):536-540.
[
|
| [32] |
李晓文, 方创琳, 黄金川, 等. 西北干旱区城市土地利用变化及其区域生态环境效应: 甘肃河西地区为例. 第四纪研究, 2003, 23(3): 280-290, 348-349.
[
|
| [33] |
苑韶峰, 唐奕钰, 申屠楚宁. 土地利用转型时空演变及其生态环境效应: 基于长江经济带127个地级市的实证研究. 经济地理, 2019,39(9):174-181.
[
|
| [34] |
|
| [35] |
杨晴青, 刘倩, 尹莎, 等. 秦巴山区乡村交通环境脆弱性及影响因素: 以陕西省洛南县为例. 地理学报, 2019,74(6):1236-1251.
[
|
| [36] |
耿甜伟, 陈海, 张行, 等. 基于GWR的陕西省生态系统服务价值时空演变特征及影响因素分析. 自然资源学报, 2020,35(7):1714-1727.
[
|
| [37] |
郑德凤, 刘晓星, 王燕燕, 等. 基于三维生态足迹的中国自然资本利用时空演变及驱动力分析. 地理科学进展, 2018,37(10):1328-1339.
[
|
| [38] |
李震, 杨永春. 中国人力资本结构高级化格局演变及其空间分异机制. 经济地理, 2019,39(10):104-111.
[
|
| [39] |
庄大方, 刘纪远. 中国土地利用程度的区域分异模型研究. 自然资源学报, 1997,12(2):10-16.
[
|
| [40] |
|
| [41] |
武鹏, 李同昇, 李卫民. 县域农村贫困化空间分异及其影响因素: 以陕西山阳县为例. 地理研究, 2018,37(3):593-606.
[
|
/
| 〈 |
|
〉 |
