
JOURNAL OF NATURAL RESOURCES >
Multi-scenario urban expansion simulation for SDGs: Taking the Central Asian region along the Belt and Road as an example
Received date: 2019-12-24
Request revised date: 2020-04-20
Online published: 2021-06-28
Copyright
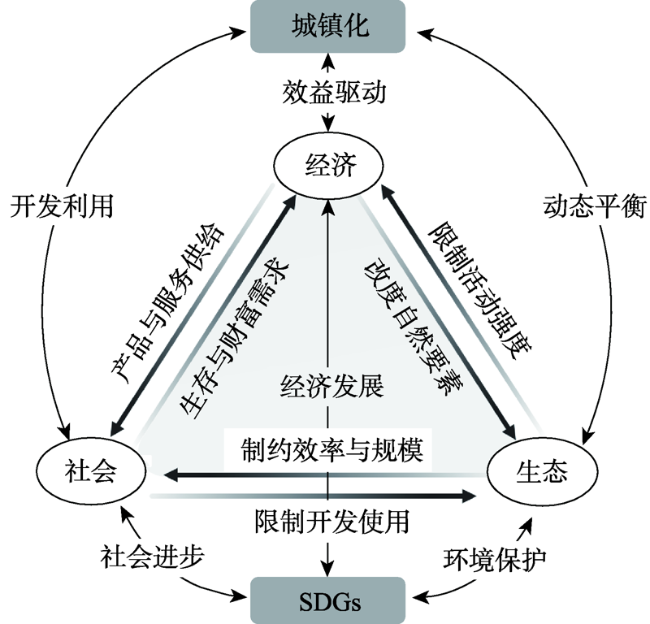
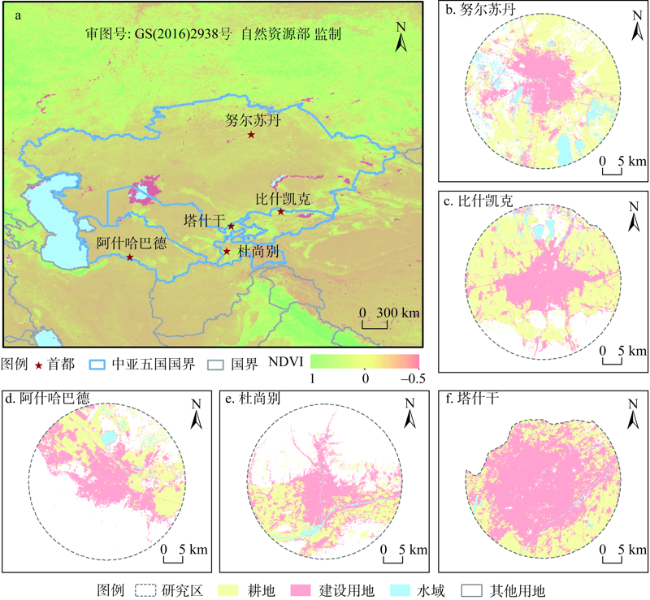
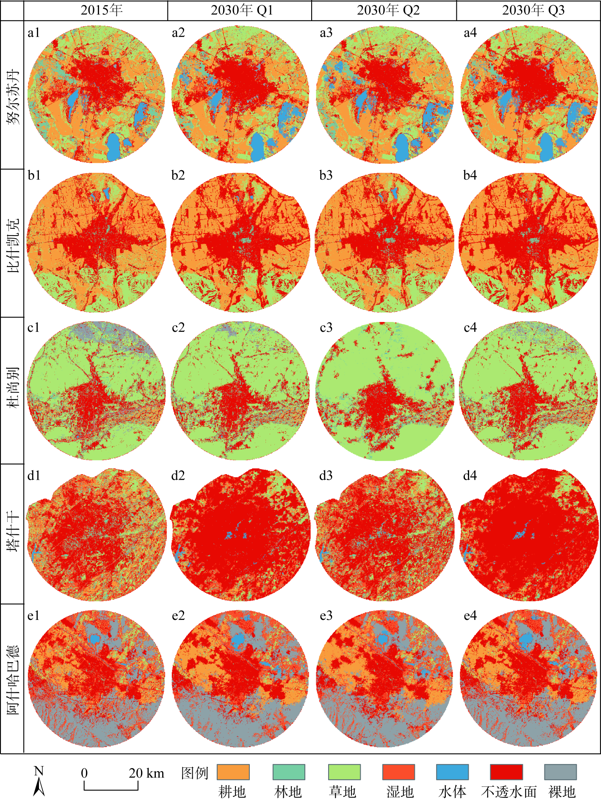
In the context of the global initiative for the Sustainable Development Goals (SDGs), cities, as the main place for human activities, are not only the focal point of the SDGs, but also the focus of implementation of the SDGs in countries around the world. Taking the urban areas of the capitals of five Central Asian countries along the Belt and Road as an example, this study sets development scenarios and corresponding parameters towards SDGs, and uses the Markov-FLUS model to simulate the urban development pattern under natural development scenarios, ecological priority scenarios and economic priority scenarios in 2030. The change patterns of urban land use under the SDGs are estimated. The study provide a basis for decision-making in urban development through coordinating the city's society, ecology, and economy from a spatial perspective. The results show that: (1) From 2010 to 2015, the total amount of construction land in the study area increased and the total amount of ecological land decreased. (2) Ecological land fragmentation caused by the expansion of construction land occurred in future scenario simulations, ecological priority scenarios effectively inhibited the expansion of construction land, land converted to bare land has been reduced in the economic priority scenario, and construction land has been continuously expanding. (3) Future urban development should coordinate ecological protection and economic development, integrate ecological protection concepts into urban construction, and implement national policies to promote land resources sustainable use and promotion of the 2030 United Nations Sustainable Development Goals.
XIONG Jin-hui , YUE Wen-ze , CHEN Yang , LIAO Rong , FANG Kai . Multi-scenario urban expansion simulation for SDGs: Taking the Central Asian region along the Belt and Road as an example[J]. JOURNAL OF NATURAL RESOURCES, 2021 , 36(4) : 841 -853 . DOI: 10.31497/zrzyxb.20210403
表1 情景模拟的主要数据Table 1 The database used for multi-scenario simulation |
| 数据类型 | 指标 | 数据来源 | 指标内涵 |
|---|---|---|---|
| 土地利用 | — | Landsat 5 30 m分辨率遥感影像(地理空间数据云) | |
| — | Landsat 8 30 m分辨率遥感影像(美国地质调查局) | ||
| 自然因子 | 高程 | 30 m分辨率DEM数据(地理空间数据云) | 驱动土地利用变化的地形因素[25] |
| 坡度 | |||
| 坡向 | |||
| 经济因子 | 人口密度 | 人口分布数据(欧盟联合研究中心,http://data.jrc.ec.europa.eu/) | 研究区域内人口数量的空间量化,反映城市发展的人口集中程度[30] |
| 建筑密度 | 建成区密度数据(欧盟联合研究中心,http://data.jrc.ec.europa.eu/) | 研究区域内建设用地的空间量化,反映城市发展的城市建设强度[29] | |
| 兴趣点密度 | POI数据(谷歌地图API) | 城市内部兴趣点的分布密度,反映城市功能结构的分布情况[31] | |
| 社会因子 | 道路可达性 | 路网数据(Open Street Map) | 城市内部到城市道路(交通线、城际交通线以公路、县道,等)、水系(河流、湖泊,等)、铁路的欧式距离,反映城市基础功能的可达程度[25] |
| 水体可达性 | 水体数据(Open Street Map) | ||
| 铁路可达性 | 铁路数据(Open Street Map) | ||
| 城市发展 | 夜间灯光数据(美国海洋大气管理局,https://www.noaa.gov/) | 城市建成区夜间灯光空间量化,捕捉城市社会活动强度[32] |
表2 2030年各情景城市用地总需求Table 2 Total urban land demand in the capitals of five Central Asian countries in 2030 (hm2) |
| 情景 | 耕地 | 林地 | 草地 | 湿地 | 水面 | 建设用地 | 裸地 | |
|---|---|---|---|---|---|---|---|---|
| 努尔苏丹 | Q1 | 116267 | 13018 | 69724 | 7516 | 25773 | 83478 | 3733 |
| Q2 | 115587 | 20233 | 70657 | 7666 | 26837 | 74801 | 3729 | |
| Q3 | 114553 | 11415 | 69650 | 7487 | 25551 | 87315 | 3538 | |
| 比什凯克 | Q1 | 98857 | 2863 | 36346 | 4230 | 220 | 88904 | 281 |
| Q2 | 98851 | 3490 | 46357 | 4406 | 713 | 77604 | 280 | |
| Q3 | 96748 | 2724 | 34121 | 4192 | 110 | 93564 | 241 | |
| 杜尚别 | Q1 | 6184 | 18306 | 134441 | 689 | 53 | 42703 | 3982 |
| Q2 | 5508 | 19923 | 139161 | 818 | 55 | 40869 | 24 | |
| Q3 | 6149 | 18035 | 134326 | 668 | 53 | 43241 | 3886 | |
| 塔什干 | Q1 | 9998 | 6241 | 11541 | 24405 | 1732 | 148945 | 1025 |
| Q2 | 9036 | 17489 | 29106 | 44364 | 1798 | 101072 | 1023 | |
| Q3 | 6533 | 3741 | 7761 | 20055 | 1723 | 163141 | 932 | |
| 阿什哈巴德 | Q1 | 52108 | 1817 | 5434 | 75 | 1231 | 58052 | 84014 |
| Q2 | 52653 | 1905 | 7780 | 75 | 1898 | 55024 | 83396 | |
| Q3 | 51871 | 1803 | 4923 | 75 | 1083 | 66926 | 76050 |
表3 邻域权重值设置Table 3 The value of the neighborhood weight |
| 耕地 | 林地 | 草地 | 湿地 | 水体 | 建设用地 | 裸地 | |
|---|---|---|---|---|---|---|---|
| 努尔苏丹 | 1.000 | 0.000 | 0.430 | 0.614 | 0.645 | 0.705 | 0.586 |
| 比什凯克 | 1.000 | 0.473 | 0.000 | 0.441 | 0.488 | 0.771 | 0.382 |
| 杜尚别 | 0.000 | 0.636 | 1.000 | 0.465 | 0.458 | 0.580 | 0.071 |
| 塔什干 | 0.386 | 0.000 | 0.104 | 1.000 | 0.440 | 0.790 | 0.366 |
| 阿什哈巴德 | 0.596 | 0.564 | 0.375 | 0.495 | 0.433 | 1.000 | 0.000 |
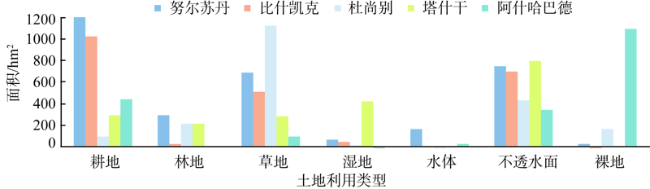
表4 2010—2015年研究区土地利用变化率结果Table 4 Land use change rate in the capitals of five Central Asian countries between 2010 and 2015 |
| 2010—2015年 变化率 | 2010年 | ||||||
|---|---|---|---|---|---|---|---|
| 耕地 | 林地 | 草地 | 湿地 | 水体 | 建设用地 | 裸地 | |
| 努尔苏丹 | 0.528 | -0.655 | -0.161 | 1.617 | 0.852 | 0.214 | 2.623 |
| 比什凯克 | 0.452 | -0.490 | -0.393 | -0.509 | -0.617 | 0.327 | -0.976 |
| 杜尚别 | -0.807 | 2.616 | 0.746 | 0.417 | -0.387 | 0.333 | -0.668 |
| 塔什干 | -0.110 | -0.578 | -0.446 | 8.055 | -0.092 | 0.418 | -0.820 |
| 阿什哈巴德 | 0.036 | 1.837 | -0.193 | 0.021 | -0.334 | 0.233 | -0.072 |
| [1] |
|
| [2] |
|
| [3] |
|
| [4] |
|
| [5] |
|
| [6] |
|
| [7] |
高峰, 赵雪雁, 宋晓谕, 等. 面向SDGs的美丽中国内涵与评价指标体系. 地球科学进展, 2019,34(3):295-305.
[
|
| [8] |
朱婧, 孙新章, 何正. SDGs框架下中国可持续发展评价指标研究. 中国人口·资源与环境, 2018,28(12):9-18.
[
|
| [9] |
|
| [10] |
|
| [11] |
|
| [12] |
|
| [13] |
|
| [14] |
|
| [15] |
|
| [16] |
陈耀亮, 罗格平, 叶辉, 等. 1975—2005年中亚土地利用/覆被变化对森林生态系统碳储量的影响. 自然资源学报, 2015,30(3):387-408.
[
|
| [17] |
United Nations (UN). World Population Prospects 2019. United Nations: New York, 2019.
|
| [18] |
|
| [19] |
|
| [20] |
陈桃, 包安明, 郭浩, 等. 中亚跨境流域生态脆弱性评价及其时空特征分析: 以阿姆河流域为例. 自然资源学报, 2019,34(12):2643-2657.
[
|
| [21] |
|
| [22] |
程维明, 周成虎, 刘海江, 等. 玛纳斯河流域50年绿洲扩张及生态环境演变研究. 中国科学, 2005,35(11):1074-1086.
[
|
| [23] |
|
| [24] |
段亚明, 刘勇, 刘秀华, 等. 基于POI大数据的重庆主城区多中心识别. 自然资源学报, 2018,33(5):788-800.
[
|
| [25] |
|
| [26] |
|
| [27] |
陈颖彪, 郑子豪, 吴志峰, 等. 夜间灯光遥感数据应用综述和展望. 地理科学进展, 2019,38(2):205-223.
[
|
| [28] |
邓红兵, 陈春娣, 刘昕. 区域生态用地的概念及分类. 生态学报, 2009,29(3):1519-1524.
[
|
| [29] |
|
| [30] |
|
| [31] |
|
| [32] |
|
| [33] |
刘晓娟, 黎夏, 梁迅, 等. 基于FLUS-InVEST模型的中国未来土地利用变化及其对碳储量影响的模拟. 热带地理, 2019,39(3):397-409.
[
|
| [34] |
王保盛, 廖江福, 祝薇, 等. 基于历史情景的FLUS模型邻域权重设置: 以闽三角城市群2030年土地利用模拟为例. 生态学报, 2019,39(12):4284-4298.
[
|
| [35] |
曹帅, 金晓斌, 杨绪红, 等. 耦合MOP与GeoSOS-FLUS模型的县级土地利用结构与布局复合优化. 自然资源学报, 2019,34(6):1171-1185.
[
|
| [36] |
郭晓娜, 陈睿山, 李强, 等. 土地退化过程、机制与影响: 以土地退化与恢复专题评估报告为基础. 生态学报, 2019,39(17):6567-6575.
[
|
/
| 〈 |
|
〉 |